

US Dollar Talking Points:
- The US Dollar is holding support at a key spot on the chart and there’s a couple of headline items on the calendar for tomorrow that can keep the currency in-focus ahead of the holiday weekend.
- EUR/USD has been in a quiet range so far this week but GBP/USD is pushing lower after this morning’s disappointing UK GDP report. USD/CAD is putting in a support bounce from a key spot and USD/JPY appears to be trying to start a recovery move after the early-week drubbing.
- The analysis contained in article relies on price action and chart formations. To learn more about price action or chart patterns, check out our DailyFX Education section.
Recommended by James Stanley
Get Your Free USD Forecast
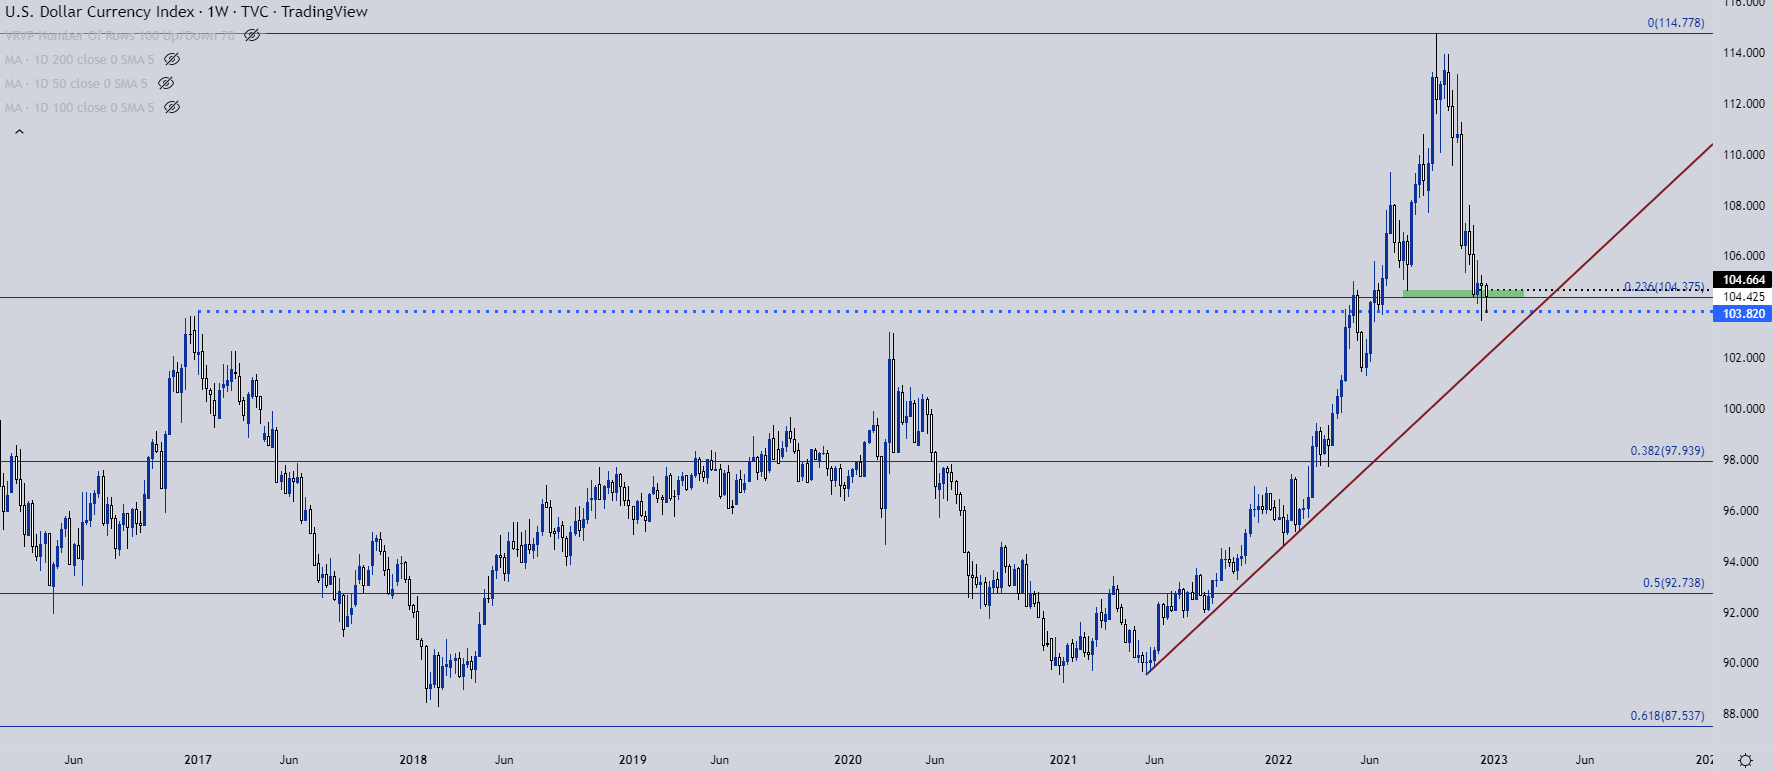
The US Dollar is holding support a week later which, for what was a previously a punishing downtrend, could be considered as a positive first step for bullish themes. The price of 103.82 was the swing high in 2017 before coming back as resistance in April of this year and then support in June. More recently, this price came back into the equation last week, helping to hold the lows even with a slight breach last Wednesday, producing a dragonfly doji on the weekly chart.
So far this week, 103.82 came into the equation again and created a technical higher-low, holding price above last week’s low.
US Dollar Weekly Price Chart
Chart prepared by James Stanley; USD, DXY on Tradingview
USD Shorter-Term
The sell-off in Q4 was a punishing move for the Greenback and it’s somewhat related to the massive surge that showed from February through September. In just a few months, more than 50% of the bullish run that priced-in this year has been taken-out, and the 50% marker of that move sits a bit-higher on the chart, just inside of the 105 psychological level at 104.71.
Sellers have still continued to hit USD at tests of resistance, which has led to the bearish trendline on the below chart. But, they’re now making little ground at support and this sets the stage for a possible turn – provided that DXY can get some help from a particularly counterpart.
US Dollar Daily Price Chart
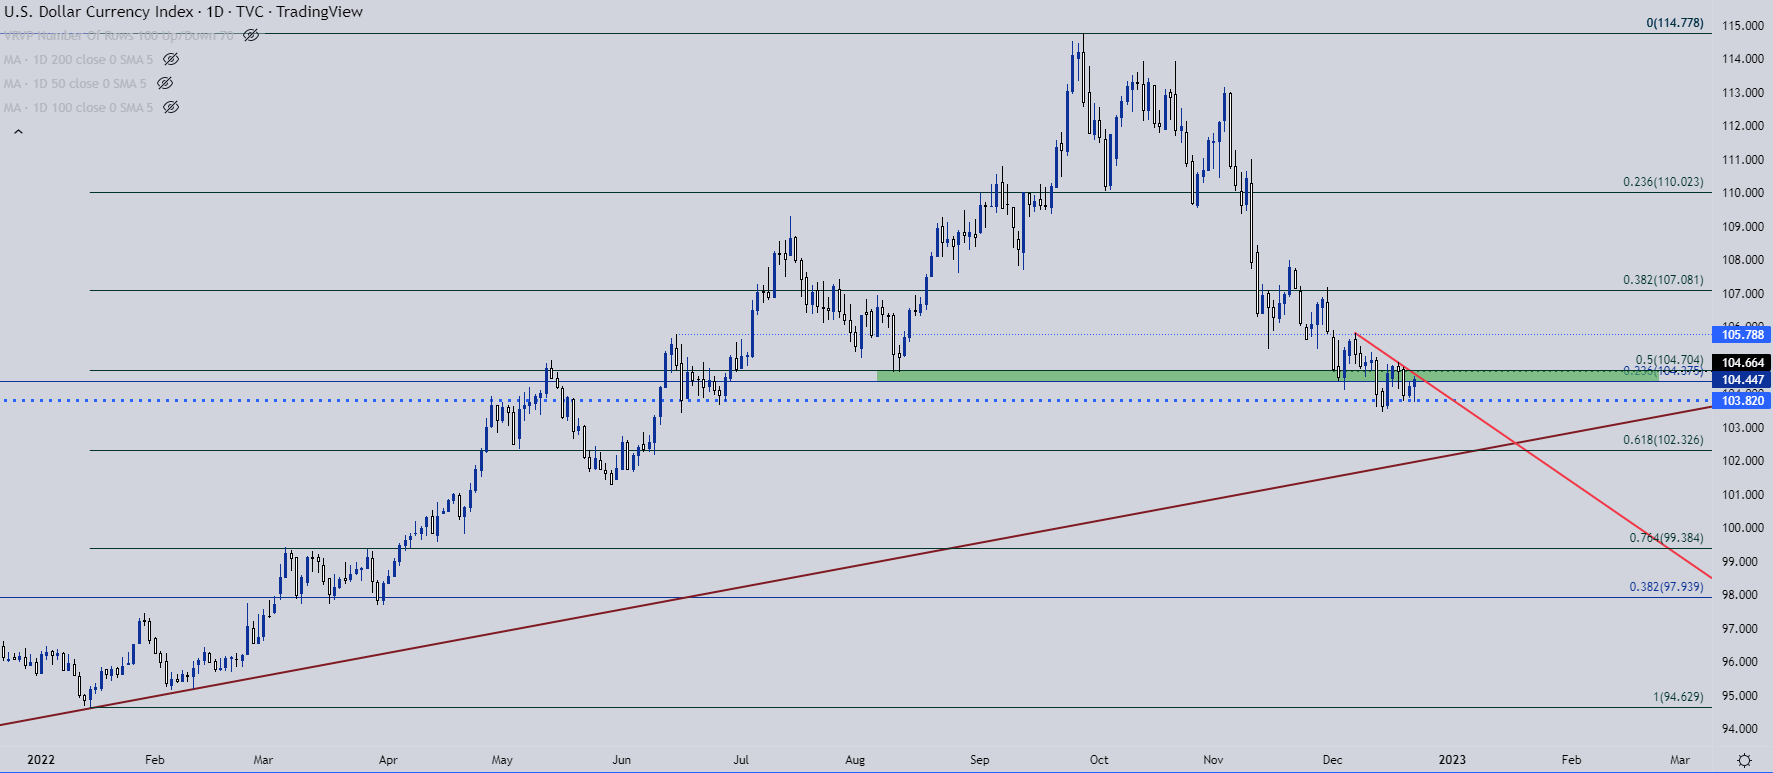
Chart prepared by James Stanley; USD, DXY on Tradingview
EUR/USD Range
If the USD is going to breakout with any type of continuation potential we’re probably going to need to see EUR/USD start to show a greater pullback. After last week it seemed as though that potential was there, particularly with the bearish engulfing candlestick on the daily from the ECB rate decision. This week, however, has brought a fairly consistent range as support at the 1.0579 Fibonacci level has held the lows. The other side of that, however, is the lower-high resistance that’s held at around 1.0650, which keeps the door open for bears.
There’s some additional support to contend with below 1.0579 – namely the trendline projection after which another Fibonacci level shows at 1.0515 followed by the psychological level at 1.0500. If bears can punch EUR/USD below this wide zone of support potential, there’s not much for support potential until we get down to around the familiar 1.0350 area on the chart.
Recommended by James Stanley
How to Trade EUR/USD
EUR/USD Daily Price Chart
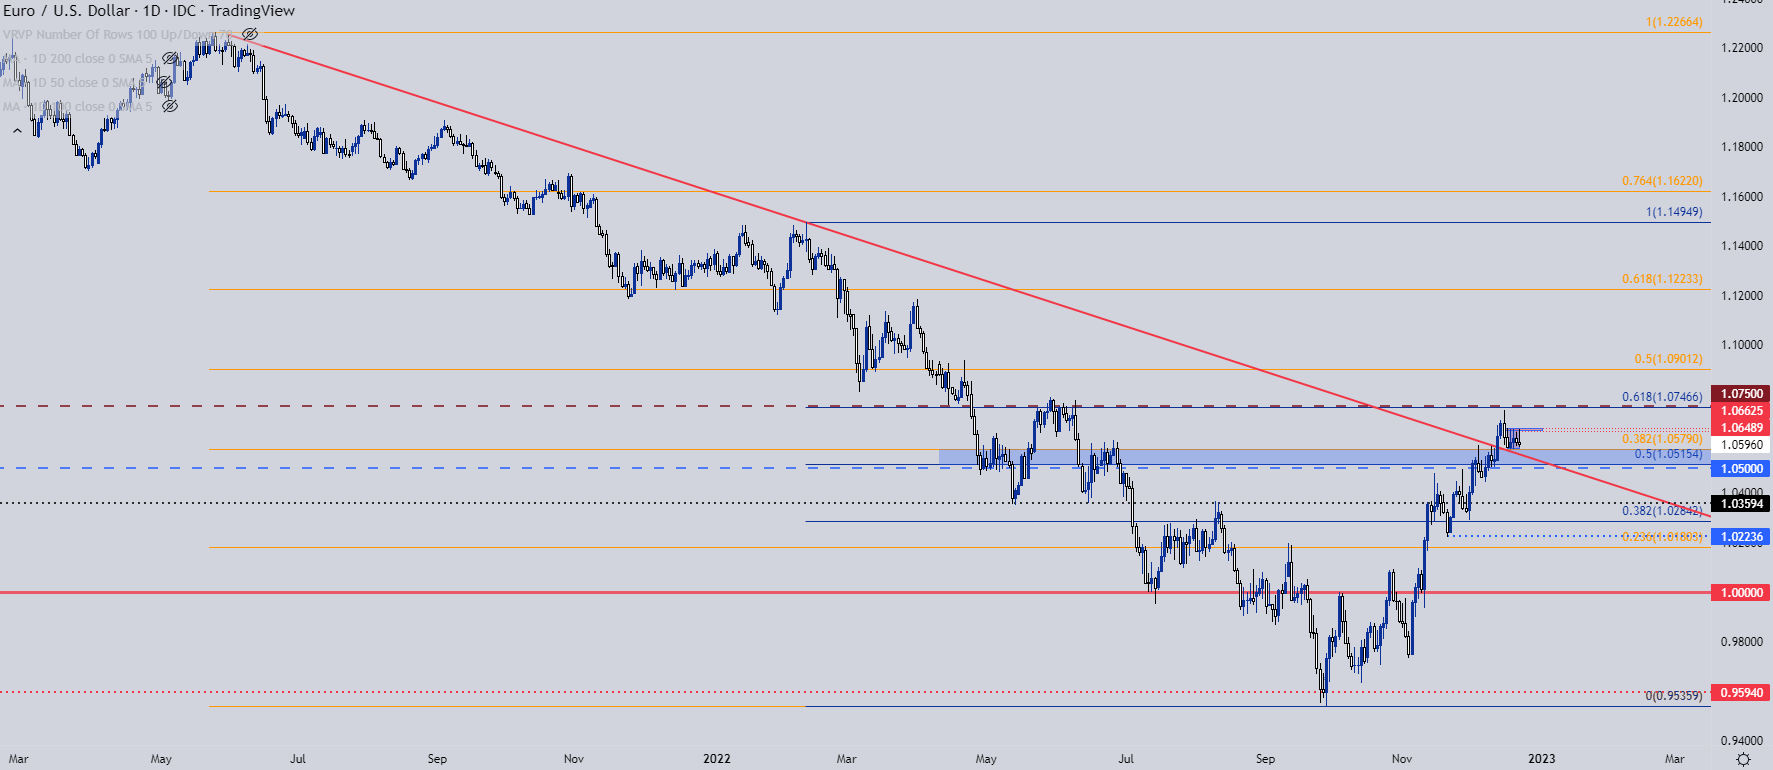
Chart prepared by James Stanley; EURUSD on Tradingview
GBP/USD Breakdown – Support Test
I had looked into GBP/USD on Monday, looking for a breach of support at 1.2100 to lead to a support test at the 1.2000 psychological level.
That happened this morning after the Q3 GDP final read for the UK came out well-below expectations, printing at 1.9% v/s an expected 2.4% expected, which was then followed by the polar opposite out of the US with Q3 GDP coming in at 3.2% v/s 2.9% expected.
This speaks to the continued deviation between UK and US economies and this is something that denotes rate hike potential into next year. With a weaker economy the UK will have a more difficult time hiking rates to tackle inflation without triggering adverse events, and that’s being reflected in this morning’s move.
Chasing cable lower here could be challenging, especially considering that we’ve just started to re-test the big figure. But – that prior spot of support, around the 1.2100 area, now becomes shorter-term resistance potential.
Recommended by James Stanley
How to Trade GBP/USD
GBP/USD Two-Hour Price Chart
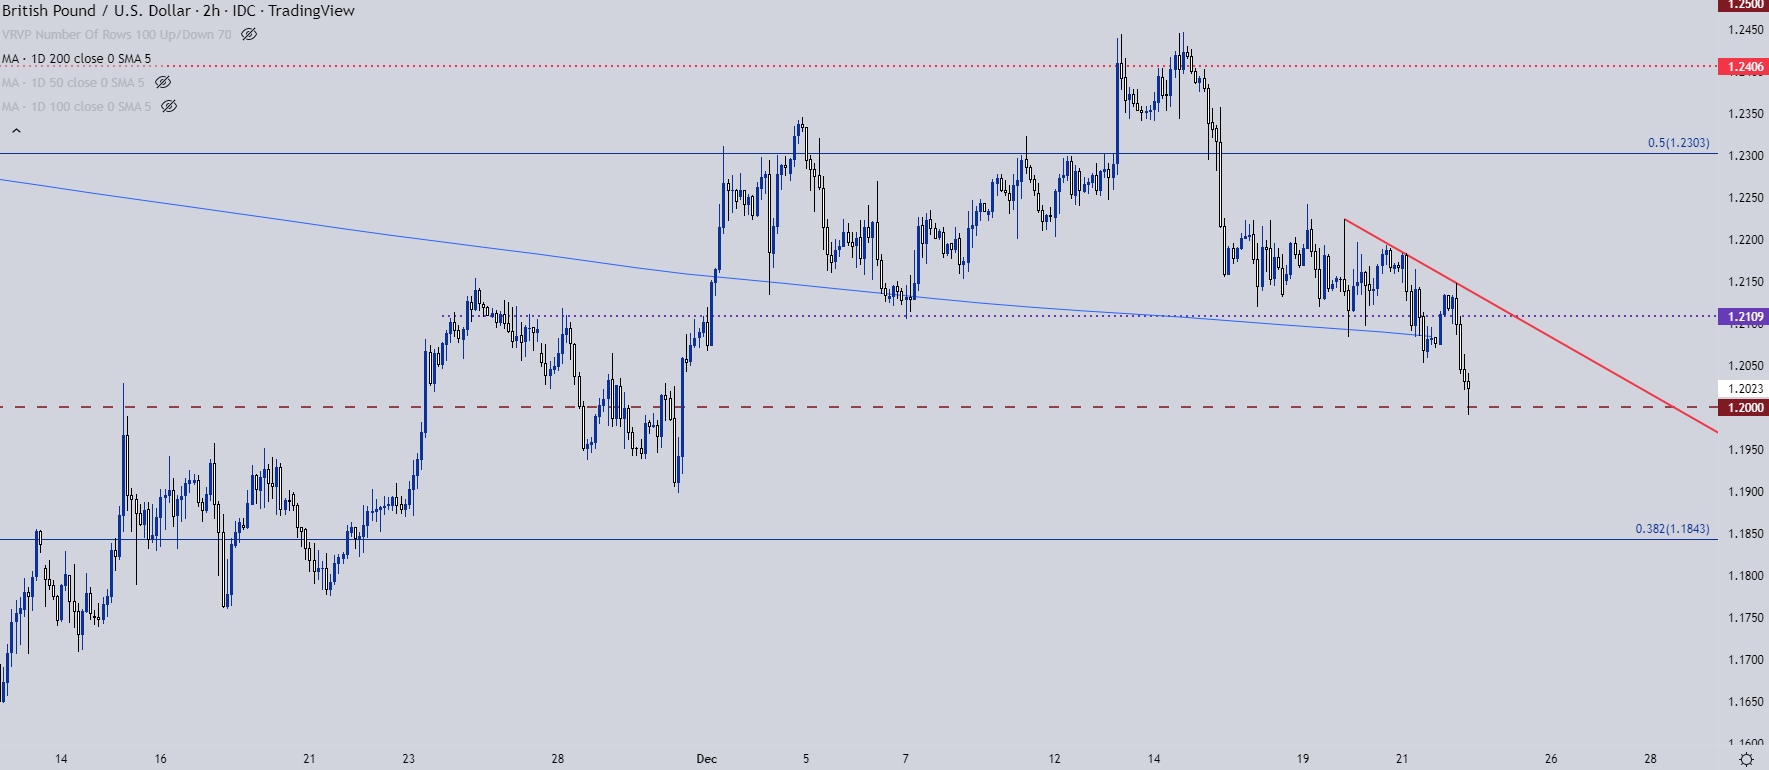
Chart prepared by James Stanley; GBPUSD on Tradingview
USD/CAD
I looked into CAD on Monday and then again on Tuesday, both times remarking that this appears to be one of the more attractive pairs for scenarios of USD-strength. That statement remains true today.
The 1.3700 level remains a key point of resistance that buyers just have not been able to breakthrough. There was another test there on Monday and Tuesday, which led to a pullback. That pullback ran right to the support zone that I’ve been tracking at 1.3578.
This keeps the door open for another resistance test and, perhaps even breakout potential going into the weekend given tomorrow’s calendar. There’s an ascending triangle here, often approached with the aim of bullish breakout potential. And today’s bar is working on a morning star formation following yesterday’s doji which is similar looked at in a bullish direction.
USD/CAD Daily Price Chart
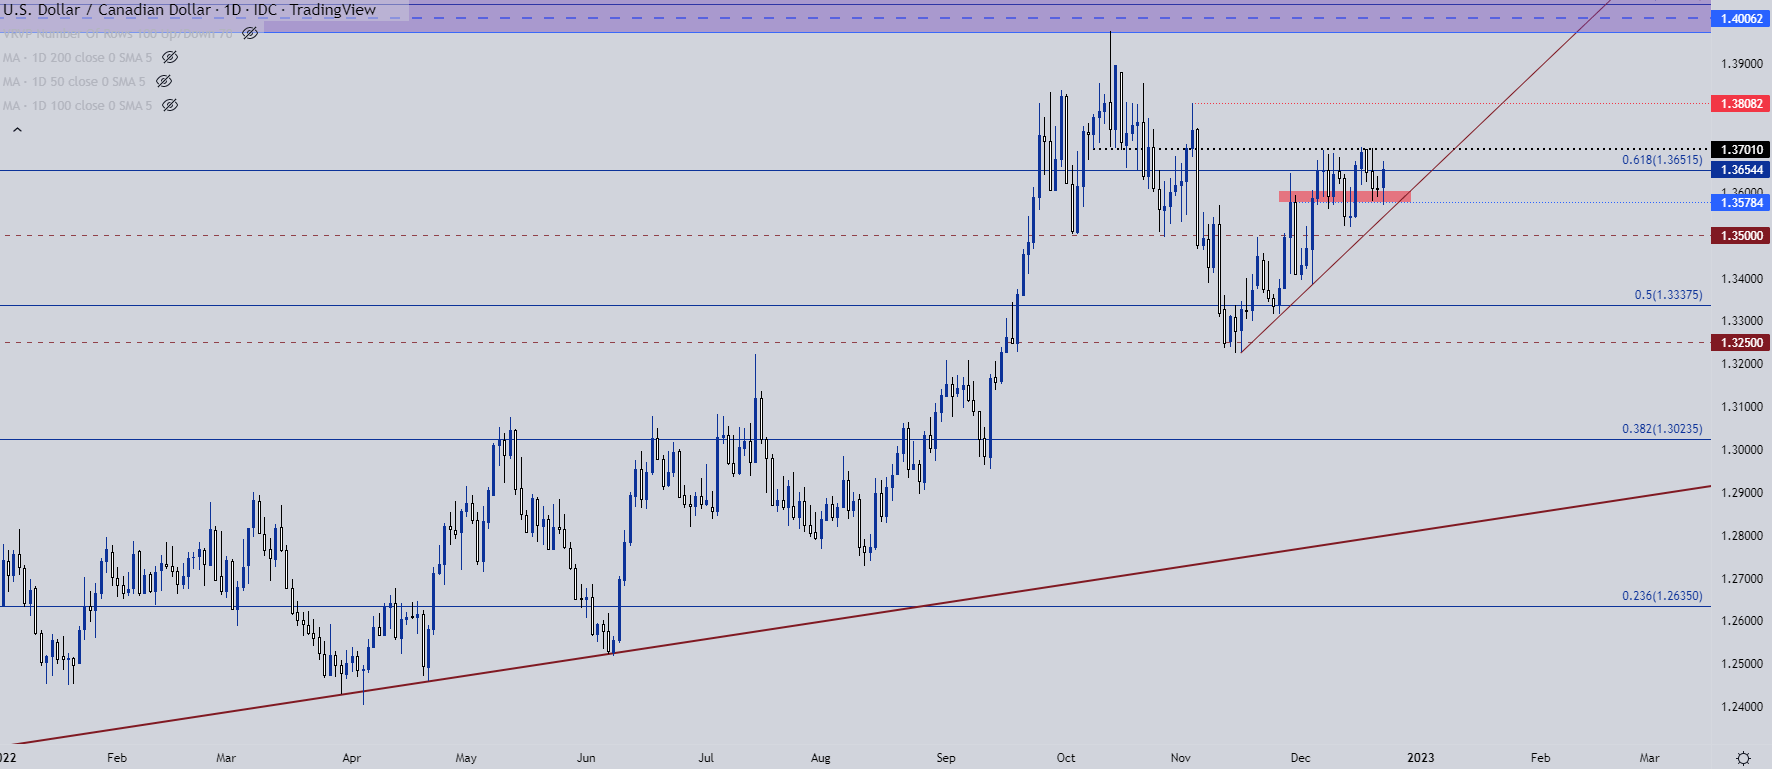
Chart prepared by James Stanley; USDCAD on Tradingview
USD/JPY
USD/JPY put in a nasty spill to start the week and a couple of days later, still hasn’t really recovered. There has been a stand at support which as noted at the beginning of this article, is a key first step for bulls.
That support in USD/JPY has so far held at the 131.25 swing which has some historical relevance. This was a double top formation in April that became support in August, just before price launched up to fresh multi-decade highs. It came back into the picture on Tuesday morning when the pair was spiraling lower.
USD/JPY Daily Price Chart
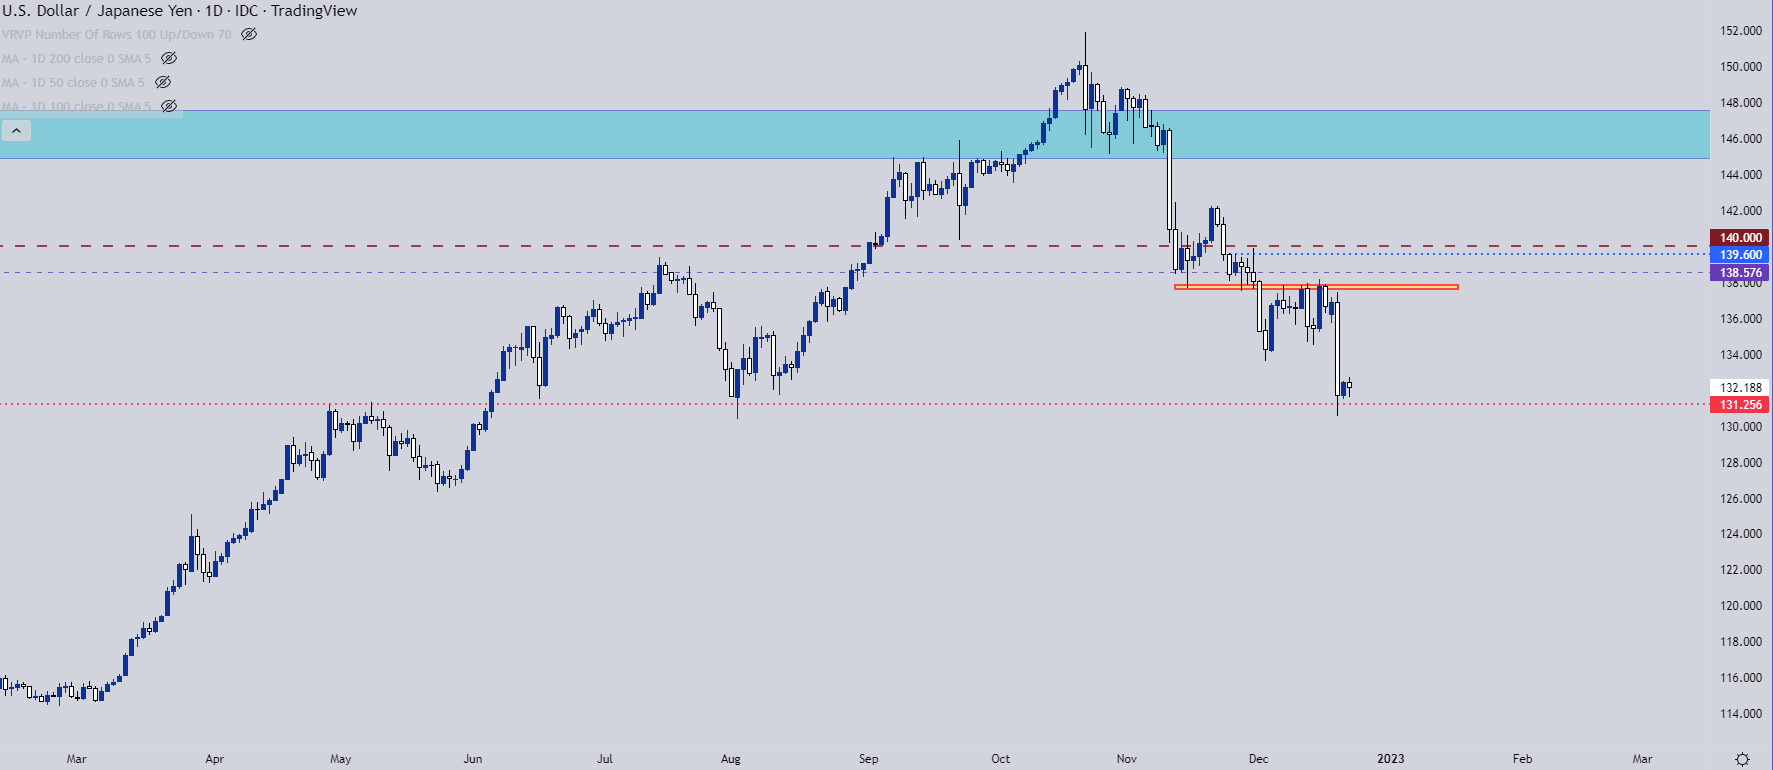
Chart prepared by James Stanley; USDJPY on Tradingview
USD/JPY Shorter-Term
Going down to the four hour chart highlights an attempt at recovery that’s still not overly convincing, particularly when compared with how USD-strength is currently pricing into GBP/USD or USD/CAD above.
But, there is potential – USD/JPY is showing an ascending triangle formation which is often approached with aim of bullish breakouts. Resistance is a bit messier and there was a failed attempt to breakout this morning and now the focus goes back to whether bulls can hold higher-low support.
Recommended by James Stanley
How to Trade USD/JPY
USD/JPY Four-Hour Chart
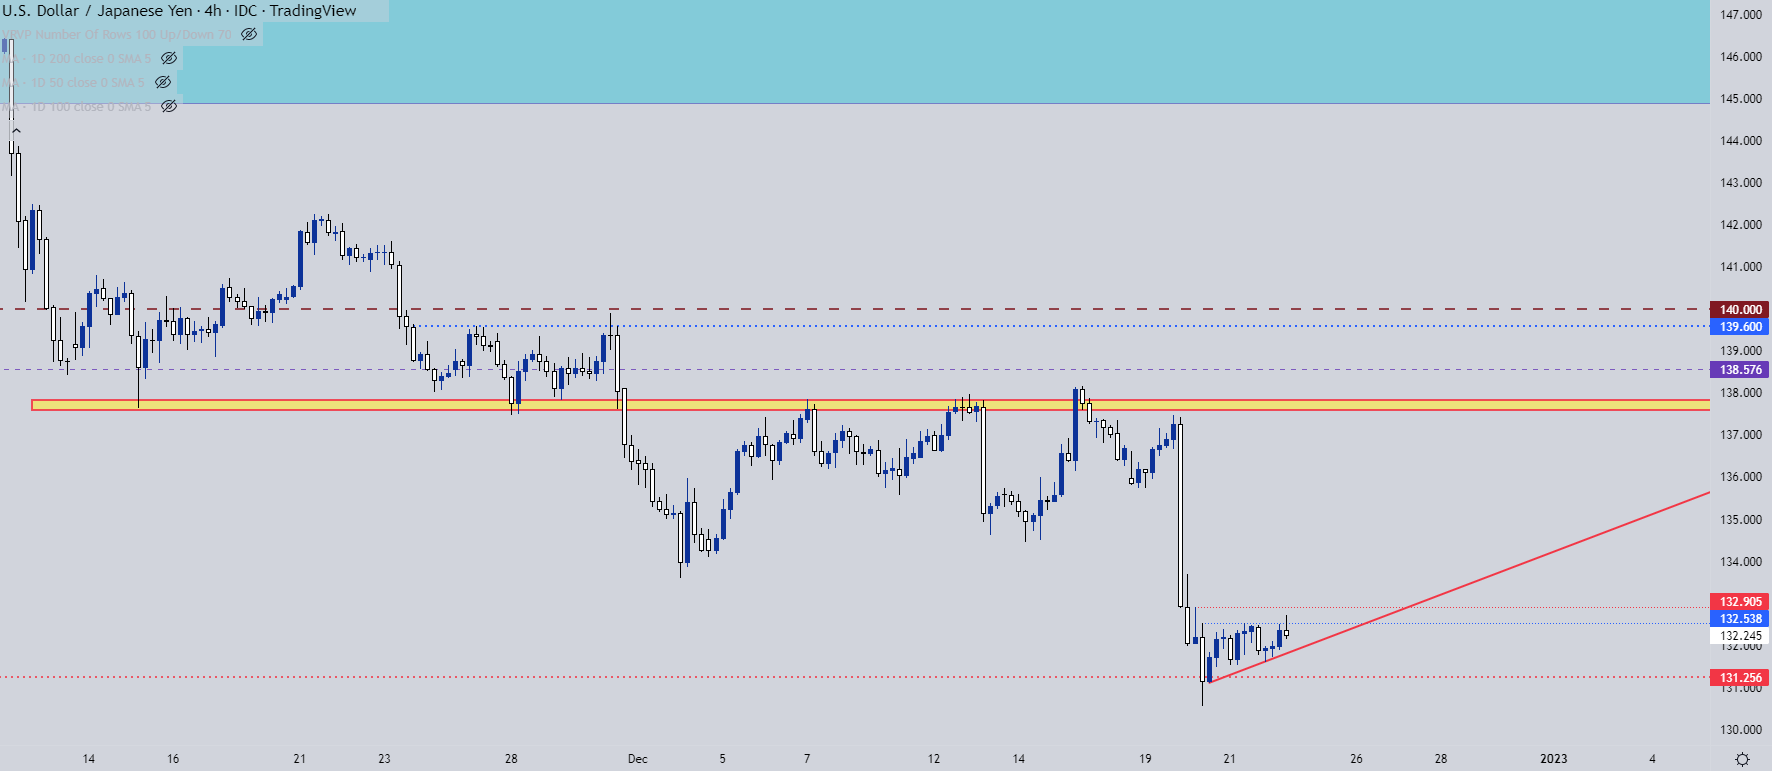
Chart prepared by James Stanley; USDJPY on Tradingview
— Written by James Stanley
Contact and follow James on Twitter: @JStanleyFX
Be the first to comment