

US Dollar Talking Points:
- The US Dollar is back above the 97 handle and while USD bulls haven’t had much success beyond this price level yet, buyers have persistently held the bid in the currency.
- It’s a big week for the Greenback with NFP on Friday after this morning’s PMI report. As our own Brendan Fagan highlighted this morning, a strong PMI read helped to bring another rush of strength into the USD.
- The analysis contained in article relies on price action and chart formations. To learn more about price action or chart patterns, check out our DailyFX Education section.
The US Dollar continues to move as a combination of strong US data and safe-haven flows have boosted the currency. While US rates continue to fall in a move clearly showing investors and funds driving into Treasuries, the US Dollar has started to show signs of breaking out of the impasse that I looked at last Wednesday. Bulls forced a topside break on Thursday and soon ran into a key Fibonacci level at 97.72, which remains of issue today. But I’m going to start with a longer-term chart here to help set the stage for what might matter most on shorter-term variations.
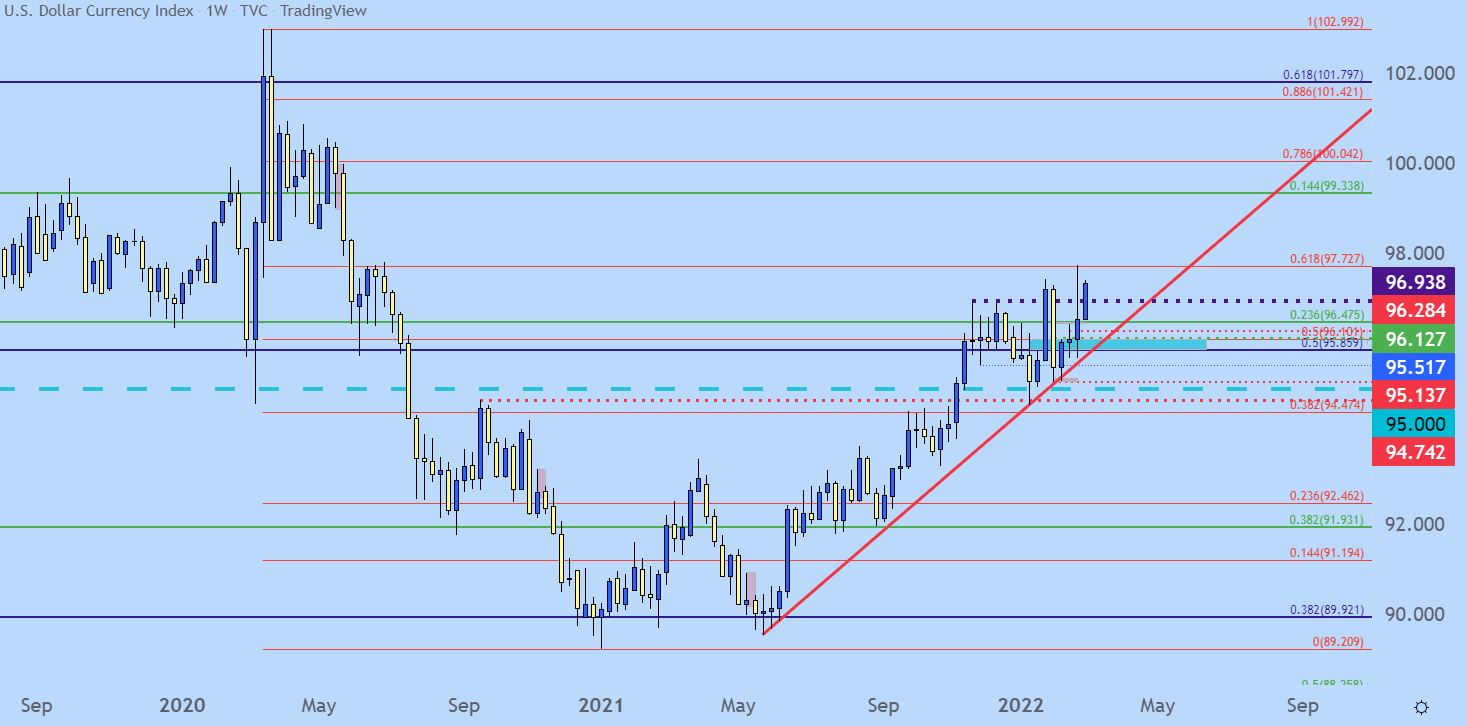
From the weekly chart below we can gain a bit of context. That USD bullish trend was very hot in the second-half of last year with an extension in the move in early-Q4 trade. But, after hitting a fresh yearly high in November at 96.94, bulls have largely been held in-check, with a range developing that’s seen considerable mean reversion over the past few months.
With the door opening into March, might bulls be ready to take a stronger hand here? While the same rate hike bets that were driving the currency last year have started to dissipate, there’s another reason for holding long USDs now as the tensions in Ukraine don’t appear ready to leave the headlines anytime soon.
US Dollar Weekly Price Chart
Chart prepared by James Stanley; USD, DXY on Tradingview
USD Shorter-Term
I think the daily chart is somewhat indicative of what I was referring to early, as buyers have continually been stymied at levels around or above the 97 handle on the chart.
Last week’s resistance inflection showed right at the 61.8% Fibonacci retracement of the 2020-2021 major move, and the reaction sent the currency down towards 96.50 before recovery themes began to show.
The reaction showing today opens the door for continued bullish breakout potential. For those that would like a bit of confirmation, waiting for today’s daily candle to close above 97.00 could be a signal of that potential for strength.
US Dollar Daily Price Chart
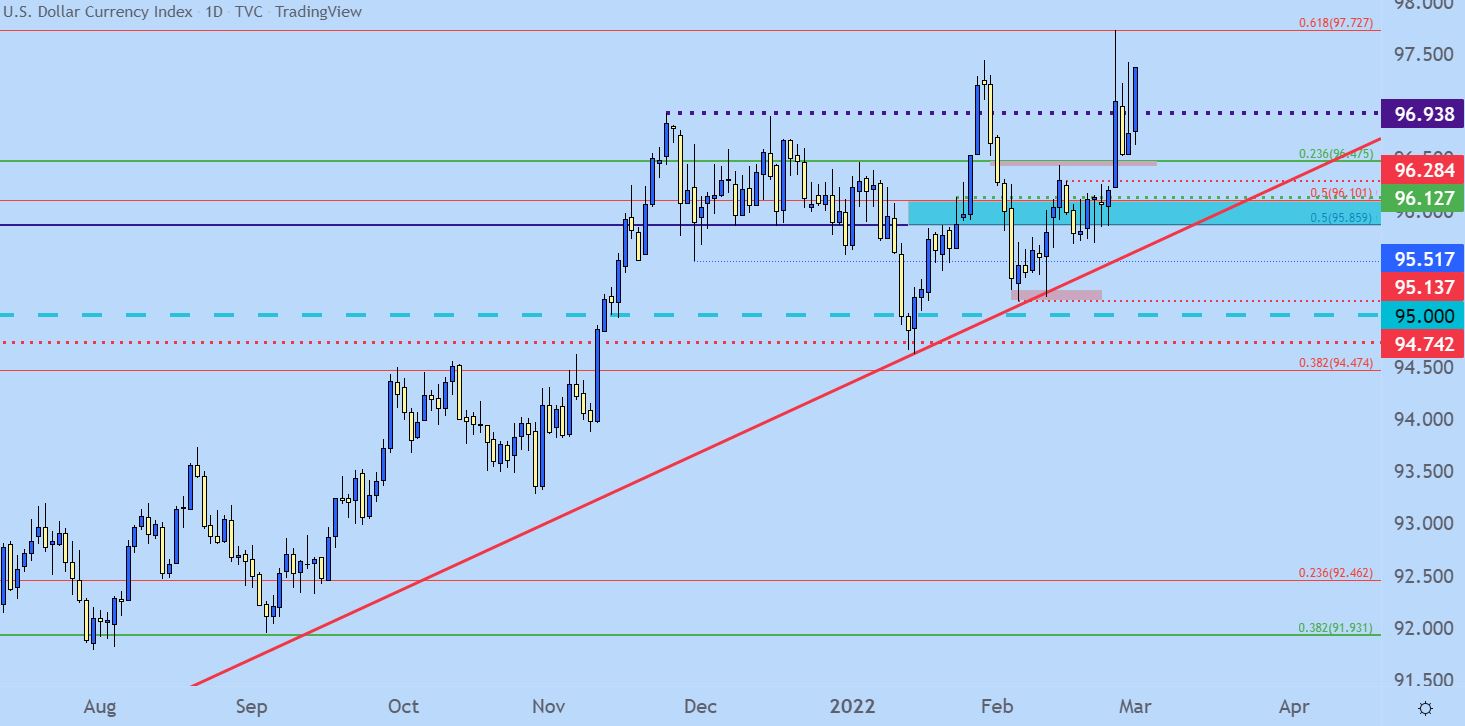
Chart prepared by James Stanley; USD, DXY on Tradingview
EUR/USD Falls to Fresh Low
Going along with that rush of USD-strength has been EUR/USD weakness, with the pair closing in on a fresh 20-month-low as of this writing. I’m anticipating that this low will be set by the time you read this, so I’m going to draw this up as if the pair had just touched down to a fresh low.
Chasing such matters can be dangerous as the pair has already fallen by more than 150 pips over the past two days. And given the severity of the situation, there certainly is a chance that the breakout continues to go down, with prices falling further to fresh lows.
But as a rule I don’t chase markets and this is no different. So, there’s two rational ways to move forward if chasing is out of the equation, and the first is likely unsavory to those experiencing FOMO but it’s to wait for prices to pullback. The prior support zone of 1.1187-1.1212 remains of interest for such themes. Alternatively, if traders did want to play for a continued breakdown – find a support level and implement breakout logic, which we discuss in the guide that’s available from the below link. But key for such an approach is solid risk management so that if the breakout does turn out to be false, loss mitigation can remain of a priority and the trader can simply wait for resistance to come back into play in order to utilize the first option.
EUR/USD Daily Price Chart
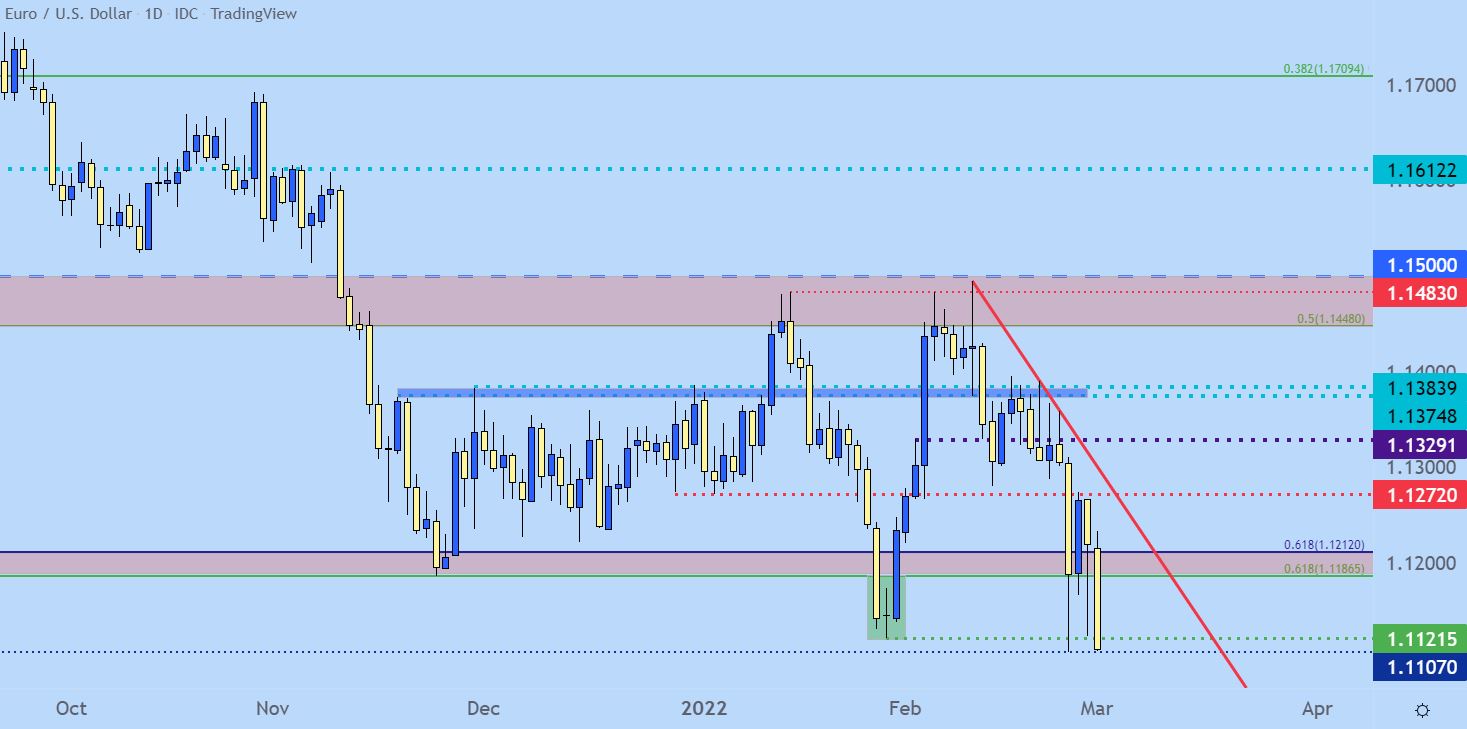
Chart prepared by James Stanley; EURUSD on Tradingview
GBP/USD
On the long side of the USD I’ve continued to favor bearish GBP/USD scenarios. The pair is more than 300 pips off of last week’s high and unlike EUR/USD, the pair isn’t near some massively important long-term support levels.
Such a zone does exist around 150 pips lower, however, around the same 1.3162 zone that held the lows so well back in December. Notably, price action is pushing below the bullish trendline that has held the lows since the depths of the pandemic move two years ago.
GBP/USD Daily Price Chart
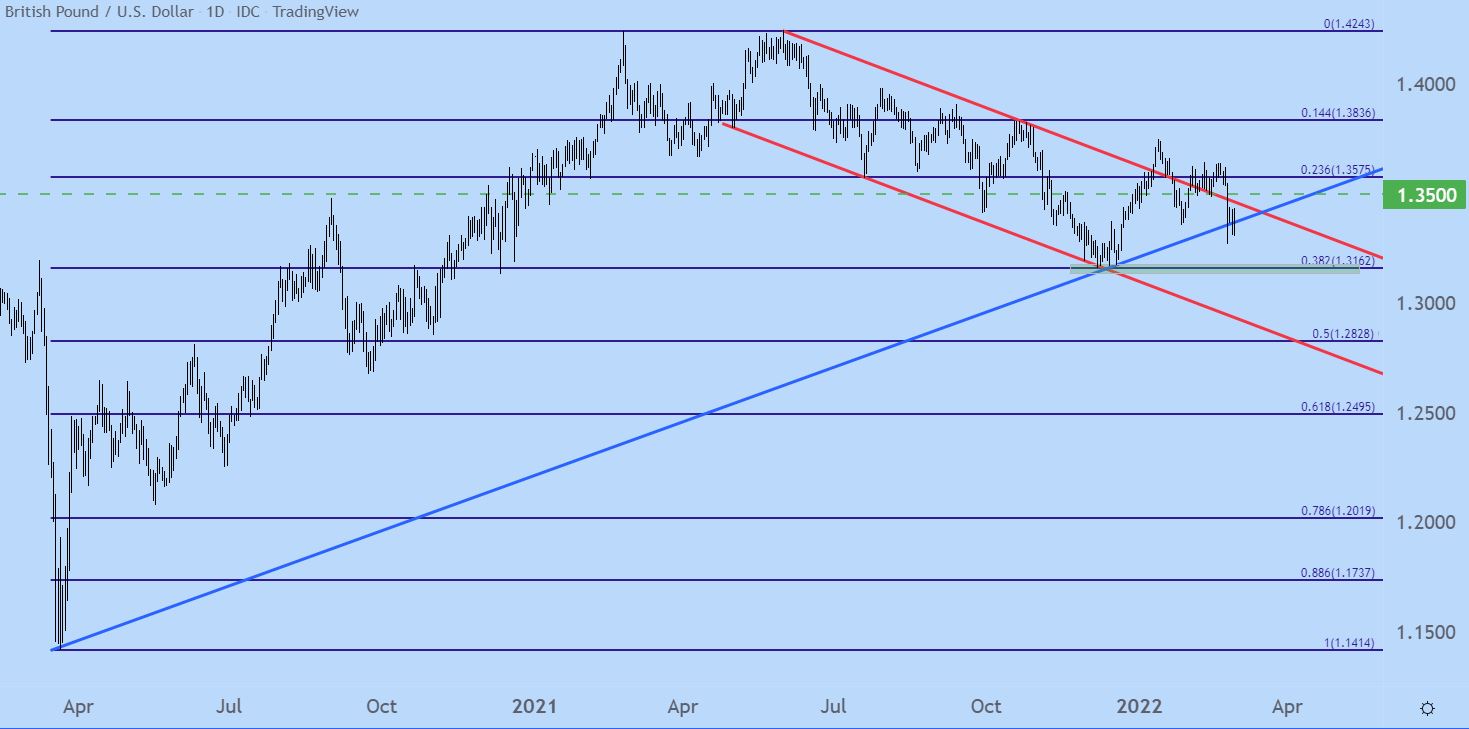
Chart prepared by James Stanley; GBPUSD on Tradingview
AUD/USD
While the US Dollar is strong, so are commodities, and commodity currencies remain fairly strong as well. I’ve been following the long side of AUD/USD and the pair has now put in four consecutive weekly gains while working on a fifth.
Perhaps more importantly, however, has been how well the pair has held up after a breach of the falling wedge formation that based off of the .7000 psychological level. This can keep the pair as somewhat enticing to the upside.
AUD/USD Weekly Price Chart
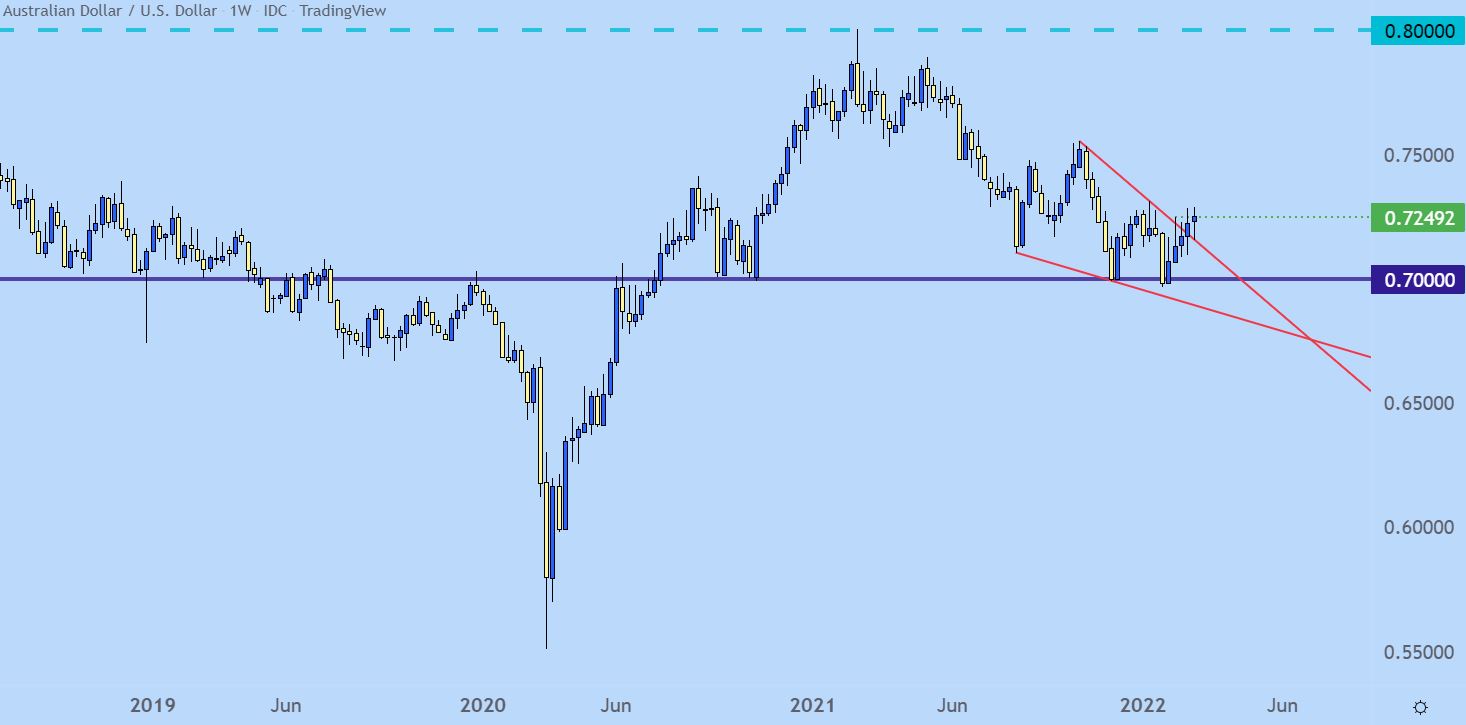
Chart prepared by James Stanley; AUDUSD on Tradingview
USD/CAD Range Support
As noted above, commodity currencies have been performing very well, even with a strong US Dollar and the Canadian Dollar is no different.
The setup here, however, remains of interest as the pair just spent almost the entire month of February in a very consistent range. Range support came into play earlier this morning, and I tweeted the setup. After that USD strength showed up and this gives the appearance of potential range fill, making the long side of USD/CAD as an interesting spot for bullish USD-scenarios.
USD/CAD Four-Hour Price Chart
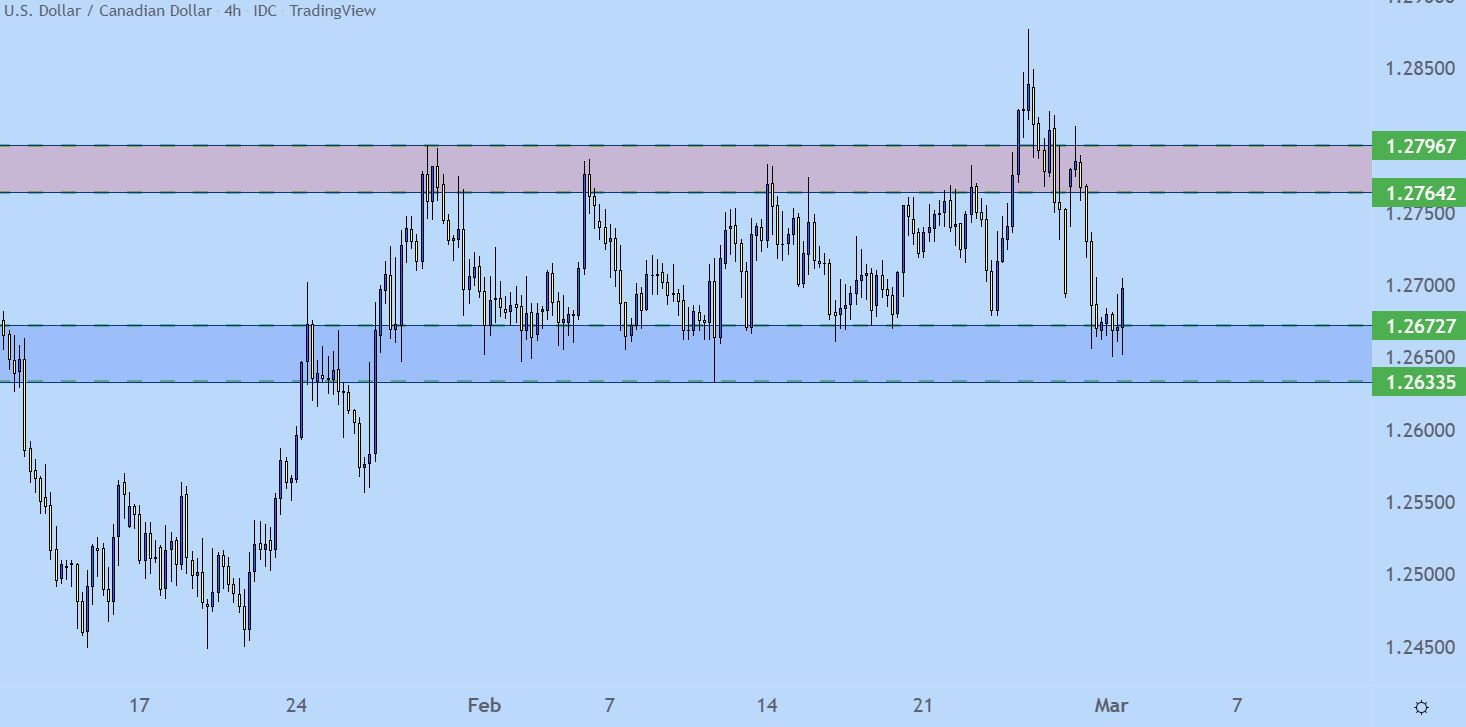
Chart prepared by James Stanley; USDCAD on Tradingview
— Written by James Stanley, Senior Strategist for DailyFX.com
Contact and follow James on Twitter: @JStanleyFX
Be the first to comment