

US Dollar Talking Points:
- The US Dollar exploded higher yesterday to set a fresh yearly high.
- The headline driver was a really strong inflation print of 6.2%, the highest read in over 30 years. But the actual trigger was a sloppy bond auction that saw markets beginning to react to that inflation data.
- The analysis contained in article relies on price action and chart formations. To learn more about price action or chart patterns, check out our DailyFX Education section.
The US Dollar broke out in a big way yesterday shortly after a surprising beat from the October CPI print. Inflation was already expected to come in at an elevated level of 5.8%. Previously, the highest recent read was at 5.4% and that had happened for three of the past four months. There was hope that, perhaps, inflation had peaked and the transitory narrative that the Fed has been operating under would begin to play out a bit more.
That did not happen: Yesterday’s inflation print came in at an annualized 6.2%, the highest read in over 30 years just a week after Chair Powell deferred to talk about interest rates at the FOMC’s rate decision.
The inflation print set the stage, but it’s the reaction to that print that really caused the USD to run and that was a Treasury auction later in the day that saw yields jump on the 30-year bond, to 1.94% from 1.88%.
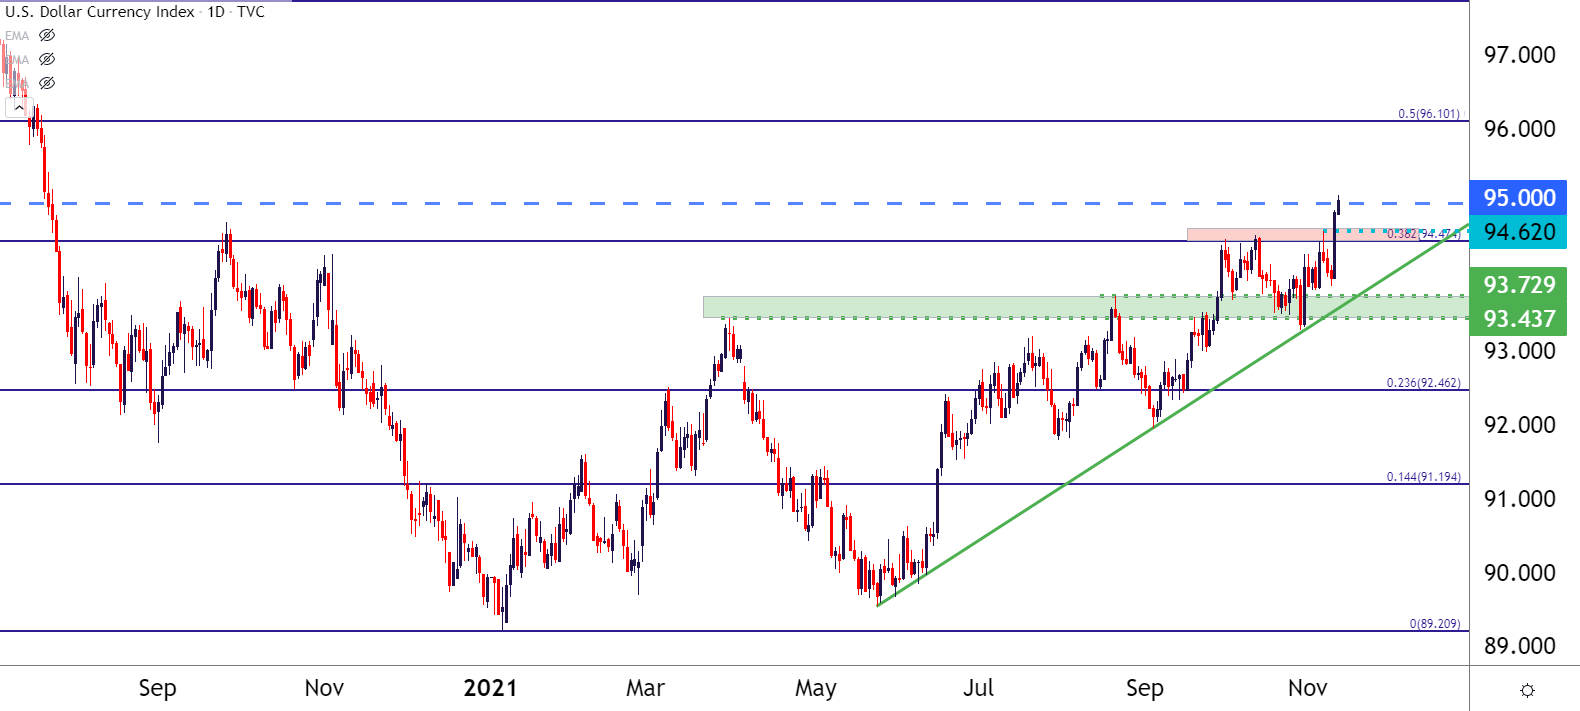
This is a pretty clear incorporation of that inflation data as investors gear up for the possibility of higher rates faster than what was expected previously. This led to a quick re-pricing of the USD as the currency jumped up to another fresh yearly high, breaking out to the 95.00 level which was a key target in the Q4 Technical Forecast on the US Dollar.
US Dollar Daily Price Chart
Chart prepared by James Stanley; USD, DXY on Tradingview
As the move has continued to stretch, there’s been a bit of short-term resistance showing around the 95.00 psychological level, and price action appears to be striking an equilibrium up here as shown by a short-term symmetrical triangle. Such digestion formations will often appear after a sizable move but they have little directional bias, in and of themselves.
US Dollar 15-Minute Chart

Chart prepared by James Stanley; USD, DXY on Tradingview
EUR/USD Takes Out 1.1500, Tests Fibonacci Support
I had tweeted this shortly after the CPI print related to the USD but, when the Dollar didn’t break out immediately after the CPI print, something seemed suspicious. And sure enough, one look at EUR/USD explained some of that, as the pair stubbornly had refused to test below the 1.1500 psychological level.
But, there was a massive amount of options set to expire at 10 AM ET that could change that, and this is what started to open the door to that breakdown move in EUR/USD that showed later in the day.
EUR/USD has pushed below this psychological level and is now finding support at the bottom-end of a longer-term zone, around 1.1448 which is the 50% marker taken from the Fibonacci retracement drawn from the 2017 low up to the 2018 high.
The pair is also testing the support side of a falling wedge, and if a short-term breakdown does show here, that formation would be invalidated and the reversal potential that it brings into the equation would be obviated out of the picture.
EUR/USD Weekly Price Chart

Chart prepared by James Stanley; EURUSD on Tradingview
AUD/USD Slides to Confluent Support
Dovish central banks have become a thing again as of the last couple of weeks, with the RBA disappointing early last week followed by both the BoE and FOMC going more dovish than expected. This has helped to create some commotion with reversal hues showing in the previously strong Australian Dollar.
At this point, the pair is back to a confluent spot on the chart, spanning around the .7300 level after a powerful two-week sell-off.
AUD/USD Daily Price Chart
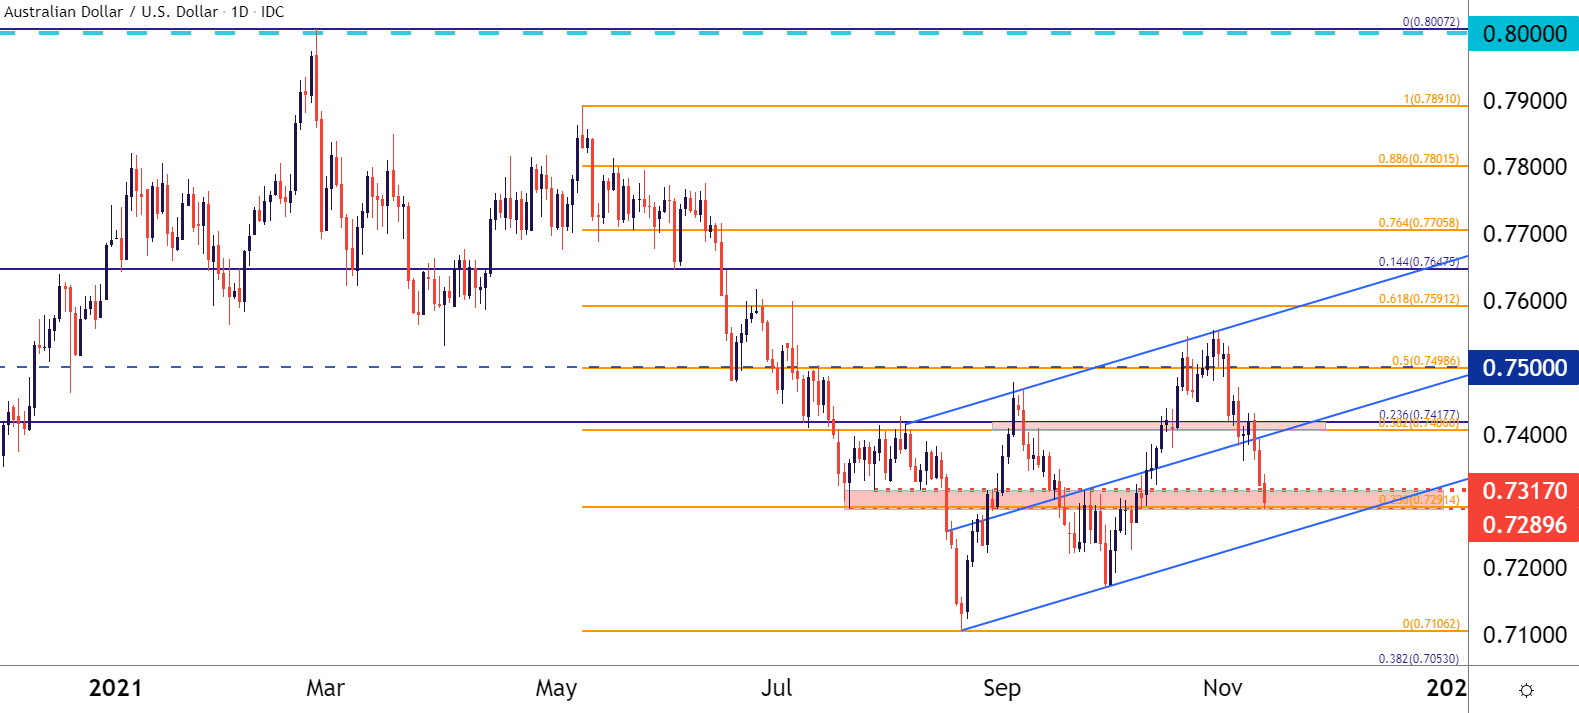
Chart prepared by James Stanley; AUDUSD on Tradingview
USD/CAD Explodes
To start off this week I had looked at USD/CAD building in a bullish trend. I warned of resistance ahead, around the 1.2500 psychological level. But, similar to what we saw with the USD, that resistance merely spelled out pent-up aggression and as traders hit the bid around the USD breakout yesterday, USD/CAD catapulted up to a fresh monthly high.
This continues the reversal that began to brew in late-October when a falling wedge formation started to form off of the lows.
Current resistance is showing at the 38.2% Fibonacci retracement of the June-August major move and this is short-term overbought from a number of vantage points.
There is another zone of resistance just ahead, around 1.2622-1.2333. For support, given the veracity of the short-term move there’s not much that’s nearby until the 1.2500 psychological level.
USD/CAD Daily Price Chart

Chart prepared by James Stanley; USDCAD on Tradingview
USD/JPY Snaps Back to a Key Spot of Resistance
This is a tricky one…
I had looked into USD/JPY last week to highlight a descending triangle formation, which pointed to a deeper sell-off ahead. That started to fill-in over the first couple of days this week, but yesterday’s jump of USD-strength pulled the pair right back into its prior range.
But that jump was caught at a key spot on the chart, right around the 114.00 handle which has been an impediment to USD/JPY bullish themes for almost a month now. And while that resistance initially held, buyers have showed up in a fairly quick fashion and from the four-hour chart below there’s some pretty considerable grind, showing that neither bulls nor bears have put their stamp on the matter as of yet.
Something like this could flow either way. The bearish item is that bulls haven’t even yet been able to re-test the prior highs. The bullish item – buyers haven’t yet given up to allow for a deeper retracement.
USD/JPY Four-Hour Price Chart
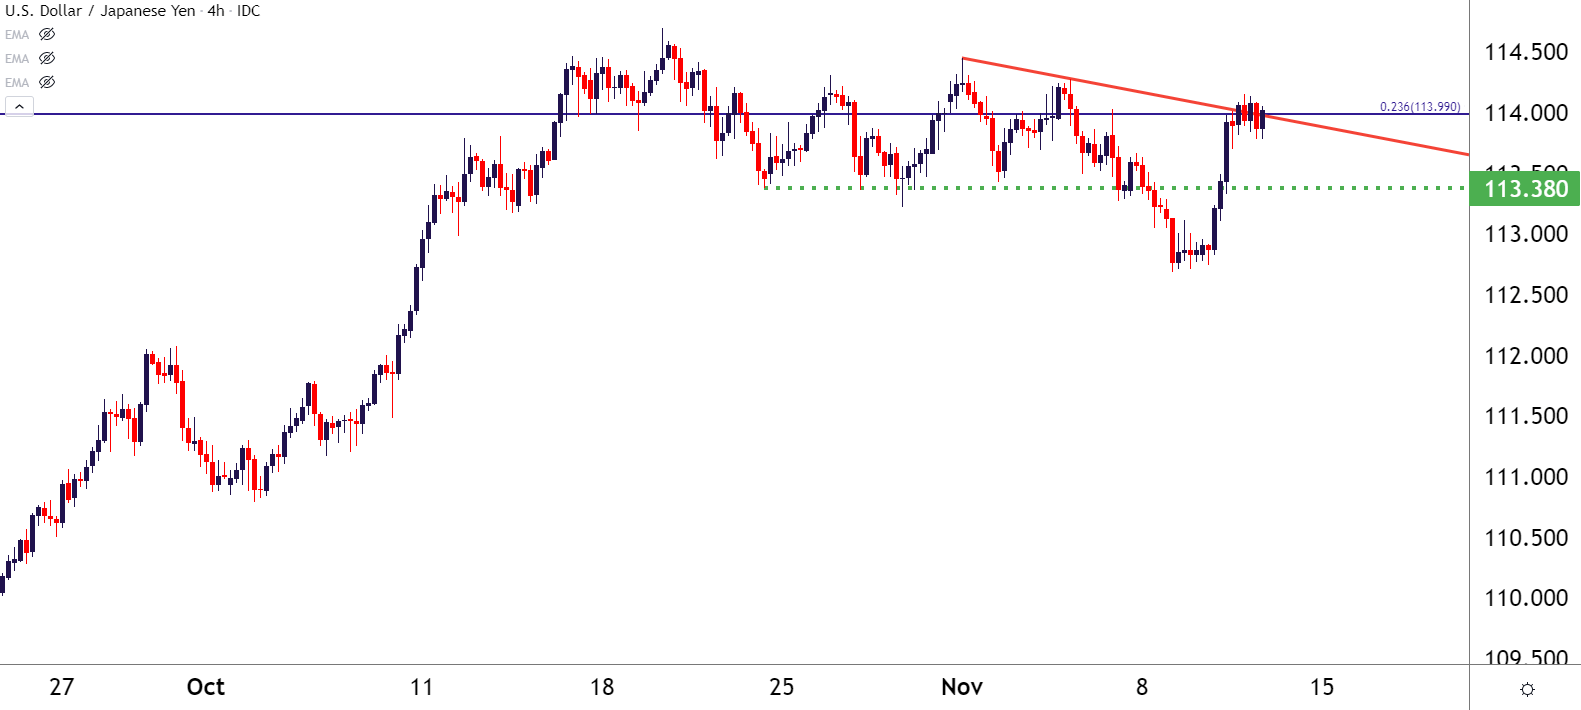
Chart prepared by James Stanley; USDJPY on Tradingview
— Written by James Stanley, Senior Strategist for DailyFX.com
Contact and follow James on Twitter: @JStanleyFX
Be the first to comment