


AlexLMX
Earnings of Unity Bancorp, Inc. (NASDAQ:UNTY) will likely remain flattish this year. Strength in regional markets will likely drive loan growth this year, which will, in turn, boost earnings. On the other hand, the normalization of provisioning for expected loan losses will counter the benefit of loan growth. Overall, I’m expecting Unity Bancorp to report earnings of $3.44 per share for 2022, up by just 0.2% year-over-year. The year-end target price suggests a high upside from the current market price. Therefore, I’m adopting a buy rating on Unity Bancorp.
New Jersey’s Markets to Play Pivotal Role in Loan Growth
Unity Bancorp’s loan portfolio grew by a strong 3.2% in the first quarter of 2022, or 13% annualized. Loan growth will likely slow down in the remainder of the year because of high interest rates that should dampen demand, especially for residential mortgage loans.
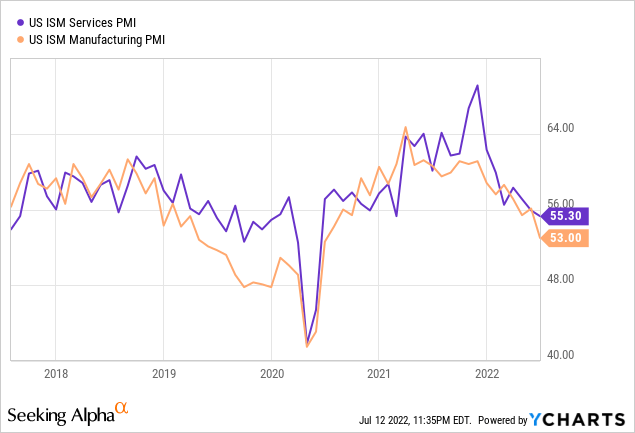
Nevertheless, loan growth will likely remain in the double-digit range this year because of strength in the regional market. Unity Bancorp mostly caters to retail, corporate, and small businesses. Therefore, the purchasing managers’ index (“PMI”) is a good gauge of the credit demand of Unity Bancorp’s customers. As shown below, the index has declined but remains well in the expansionary territory (above 50).
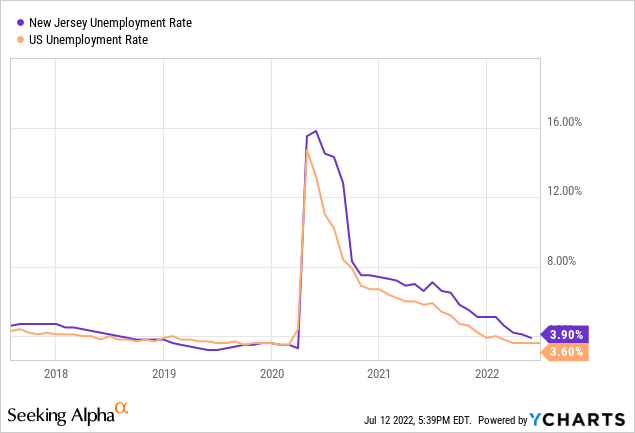
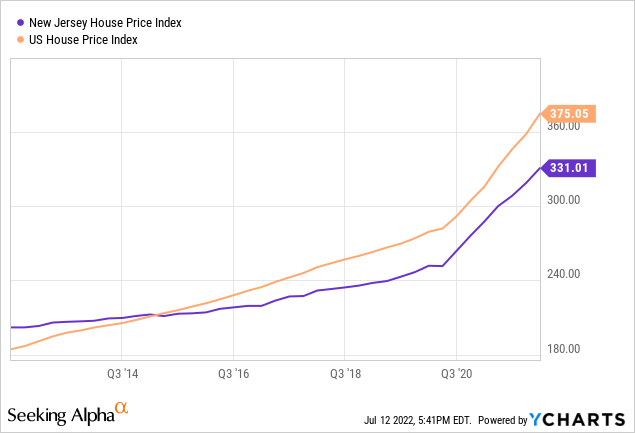
Residential mortgage loans are another big loan category for Unity Bancorp. The company operates in New Jersey; therefore, the state’s unemployment rate and house price index are good indicators of credit demand for home purchases. Both metrics indicate satisfactory credit demand for the near future.
The unemployment rate for New Jersey is almost back to the pre-pandemic level, as shown below. This strength in the job market means more people will be able to afford their first homes.
Moreover, the prices of houses in New Jersey have increased sharply over the last couple of years, but the rate of growth is still below the national average.
Considering these factors, I’m expecting the loan portfolio to increase by 11.1% by the end of 2022 from the end of 2021. Meanwhile, I’m expecting deposit growth to match loan growth in the last three quarters of 2022. The following table shows my balance sheet estimates.
| FY18 | FY19 | FY20 | FY21 | FY22E | |
| Financial Position | |||||
| Net Loans | 1,289 | 1,409 | 1,605 | 1,627 | 1,808 |
| Growth of Net Loans | 11.4% | 9.3% | 13.9% | 1.4% | 11.1% |
| Other Earning Assets | 189 | 203 | 244 | 298 | 294 |
| Deposits | 1,208 | 1,250 | 1,558 | 1,759 | 1,907 |
| Borrowings and Sub-Debt | 220 | 293 | 210 | 50 | 53 |
| Common equity | 138 | 161 | 174 | 206 | 239 |
| Book Value Per Share ($) | 12.7 | 14.6 | 16.1 | 19.5 | 22.4 |
| Tangible BVPS ($) | 12.5 | 14.4 | 15.9 | 19.4 | 22.3 |
|
Source: SEC Filings, Author’s Estimates (In USD million unless otherwise specified) |
Cash Balances Provide Opportunity for Margin Expansion
I don’t expect the net interest margin to be very rate-sensitive because Unity Bancorp has a large balance of interest-bearing transactional deposits that will re-price soon after a rate hike. These deposits, including interest-bearing demand and savings accounts, made up 54% of total deposits at the end of March 2022.
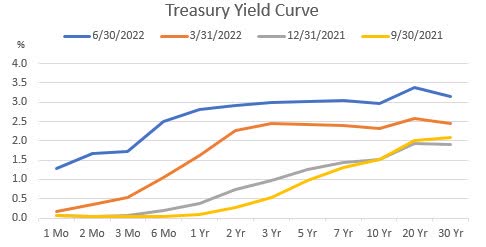
On the other hand, Unity Bancorp has a large cash balance that it can quickly deploy into securities, thereby increasing the average yield on earning assets. Cash and cash equivalents made up 9% of total assets at the end of March 2022. Even if Unity Bancorp is unsuccessful in deploying the excess cash into longer-term securities, the cash balances can still benefit from the upward shift in the yield curve, especially on the short end.
The U.S. Treasury Department
Considering these factors, I’m expecting the margin to improve by 12 basis points in the last three quarters of 2022 from 4.11% in the first quarter of the year.
Provision Normalization Likely
Unity Bancorp continued to reverse some of its previous provisionings through the first quarter of 2022. This reversal was made possible by the continued improvement in asset quality. Nonperforming loans dropped to 0.55% of total loans at the end of March 2022 from 0.71% of total loans at the end of March 2021, according to details given in the 10-Q Filing. Allowances made up 1.30% of total loans at the end of March 2022. Therefore, the allowance coverage of nonperforming loans currently appears to be at a comfortable level.
Theoretically, the rise in interest rates should hurt borrowers’ debt servicing ability. However, historically, Unity’s credit quality has not been too dependent on interest rate changes. The last time rates were above 2.0%, i.e. the third quarter of 2019, nonperforming loans made up just 0.41% of total loans, as mentioned in the old 10-Q Filing.
In my opinion, the heightened loan additions expected for this year will likely be the biggest driver of provisioning for expected loan losses. Considering these factors, I’m expecting the provision expense to be near a normal level this year. I’m expecting the net provision expense to make up 0.16% of total loans in 2022. In comparison, the provision expense averaged 0.15% of total loans from 2017 to 2019. Compared to last year, the net provision expense will be much higher this year due to the normalization. Therefore, provisioning will likely pressurize earnings on a year-over-year basis.
Flattish Earnings Likely for 2022
Unity Bancorp is likely to report flattish earnings growth for 2022 as higher net interest income will counter provision normalization. Overall, I’m expecting Unity Bancorp to report earnings of $3.44 per share for 2022, up by only 0.2% year-over-year. The following table shows my income statement estimates.
| FY18 | FY19 | FY20 | FY21 | FY22E | |||||
| Income Statement | |||||||||
| Net interest income | 54 | 58 | 64 | 77 | 84 | ||||
| Provision for loan losses | 2 | 2 | 7 | 0 | 3 | ||||
| Non-interest income | 9 | 10 | 13 | 12 | 10 | ||||
| Non-interest expense | 33 | 35 | 39 | 41 | 43 | ||||
| Net income – Common Sh. | 22 | 24 | 24 | 36 | 37 | ||||
| EPS – Diluted ($) | 2.01 | 2.14 | 2.19 | 3.43 | 3.44 | ||||
|
Source: SEC Filings, Earnings Releases, Author’s Estimates (In USD million unless otherwise specified) |
|||||||||
Actual earnings may differ materially from estimates because of the risks and uncertainties related to inflation, and consequently the timing and magnitude of interest rate hikes. Further, the threat of a recession can increase the provisioning for expected loan losses beyond my expectation.
Adopting a Buy rating
Unity Bancorp usually increases its dividend in the first quarter of every year. Therefore, there is little chance of a dividend hike in the remainder of this year. Assuming Unity maintains its dividend at $0.11 per share for the last two quarters of the year, the company will offer a different yield of 1.6% for 2022. This dividend estimate suggests a payout ratio of just 12.5% for 2022, which is close to the last five-year average of 14.4%.
I’m using the historical price-to-tangible book (“P/TB”) and price-to-earnings (“P/E”) multiples to value Unity Bancorp. The stock has traded at an average P/TB ratio of 1.40x in the past, as shown below.
| FY17 | FY18 | FY19 | FY20 | FY21 | Average | |
| T. Book Value per Share ($) | 10.8 | 12.5 | 14.4 | 15.9 | 19.4 | |
| Average Market Price ($) | 17.8 | 22.3 | 20.9 | 15.3 | 22.8 | |
| Historical P/TB | 1.64x | 1.78x | 1.45x | 0.96x | 1.18x | 1.40x |
| Source: Company Financials, Yahoo Finance, Author’s Estimates | ||||||
Multiplying the average P/TB multiple with the forecast tangible book value per share of $22.3 gives a target price of $31.2 for the end of 2022. This price target implies a 14.8% upside from the July 12 closing price. The following table shows the sensitivity of the target price to the P/TB ratio.
| P/TB Multiple | 1.20x | 1.30x | 1.40x | 1.50x | 1.60x |
| TBVPS – Dec 2022 ($) | 22.3 | 22.3 | 22.3 | 22.3 | 22.3 |
| Target Price ($) | 26.7 | 29.0 | 31.2 | 33.4 | 35.6 |
| Market Price ($) | 27.2 | 27.2 | 27.2 | 27.2 | 27.2 |
| Upside/(Downside) | (1.6)% | 6.6% | 14.8% | 23.0% | 31.2% |
| Source: Author’s Estimates |
The stock has traded at an average P/E ratio of around 9.9x in the past, as shown below.
| FY17 | FY18 | FY19 | FY20 | FY21 | Average | |
| Earnings per Share ($) | 1.20 | 2.01 | 2.14 | 2.19 | 3.43 | |
| Average Market Price ($) | 17.8 | 22.3 | 20.9 | 15.3 | 22.8 | |
| Historical P/E | 14.8x | 11.1x | 9.8x | 7.0x | 6.7x | 9.9x |
| Source: Company Financials, Yahoo Finance, Author’s Estimates | ||||||
Multiplying the average P/E multiple with the forecast earnings per share of $3.44 gives a target price of $33.9 for the end of 2022. This price target implies a 24.8% upside from the July 12 closing price. The following table shows the sensitivity of the target price to the P/E ratio.
| P/E Multiple | 7.9x | 8.9x | 9.9x | 10.9x | 11.9x |
| EPS 2022 ($) | 3.44 | 3.44 | 3.44 | 3.44 | 3.44 |
| Target Price ($) | 27.0 | 30.5 | 33.9 | 37.4 | 40.8 |
| Market Price ($) | 27.2 | 27.2 | 27.2 | 27.2 | 27.2 |
| Upside/(Downside) | (0.5)% | 12.2% | 24.8% | 37.5% | 50.1% |
| Source: Author’s Estimates |
Equally weighting the target prices from the two valuation methods gives a combined target price of $32.6, which implies a 19.8% upside from the current market price. Adding the forward dividend yield gives a total expected return of 21.4%. Hence, I’m adopting a buy rating on Unity Bancorp.
Be the first to comment