

echoevg/iStock via Getty Images
Introduction
Most publicly traded companies focus on earnings when reporting their operating results to shareholders, often on a per share basis. This is understandable, as investors and analysts typically use price-to-earnings (P/E) ratios for valuation purposes. Dividends paid are also typically reported on a per-share basis, making it easier to assess dividend coverage by comparing the payout to earnings per share (EPS). However, such an approach has some potential pitfalls – a company’s sustainable operating performance may differ significantly from its reported performance.
Assessing a company’s operational health and valuation from a cash flow perspective is a much more transparent approach, but it requires some work. However, to quote Carveth Read (p. 351), “it is better to be vaguely right than exactly wrong” – a basic understanding of how a cash flow statement is structured can already save you a lot of trouble. For example, Sears reported a 4% decline in operating income between 2000 and 2002, while operating cash flow (OCF) declined 112% over the same period, largely due to a significant increase in credit card receivables. Clearly, it pays to take a closer look at the statement of cash flows
In this article, I will present a straightforward approach to analyzing a company’s cash flow statement, at the example of the well-known consumer staples giants The Procter & Gamble Company (NYSE:PG) and Unilever PLC (NYSE:UL, OTCPK:UNLYF, OTCPK:UNLVF).
The article is divided into two main sections: First, I provide an overview of the two companies and discuss the main risks. In the main body of the article, I will explain the differences between what is commonly referred to as free cash flow (FCF) and what I consider to be sustainable or normalized FCF. On this basis, it is easy to assess the actual dividend coverage of the two companies, as well as their ability to pay down debt, buy back shares, etc. This approach also provides a much more transparent look at the companies’ actual operating profitability and growth, as well as the market’s current expectations from a valuation perspective. I will also briefly discuss a very simple method based on normalized OCF that can help uncover potential earnings problems in a company.
Part I – Company Overview: Portfolios, Growth, Profitability, And Major Investment Risks
Unilever and Procter & Gamble Boast Strong Brand Portfolios
Both Unilever and Procter & Gamble probably don’t need much introduction. Unilever is a manufacturer and distributor of world-renowned food and personal care brands, while Procter & Gamble focuses on personal care and household brands that are at least as strong. Domestos, Dove, Hellmann’s, Magnum, Sunsilk, Wall’s and Ben & Jerry’s are among Unilever’s best-known brands. Procter & Gamble owns, for example, Pampers, Bounty, Always, Braun, Gillette, Febreze, Crest, Tide and many more.
Breakdown Of Revenues
Both companies sell their products around the world. P&G generated 54% of its net sales in fiscal 2022 (ended June 30, 2022) in international markets, but no international country accounted for more than 10% of the company’s consolidated net sales that year. Unilever, which decided in 2020 to unify its dual structure under a single parent company headquartered in the UK, is a much more international company than P&G, with 19% of its 2021 sales coming from the U.S. and 11% from India. Therefore, it is not surprising that exchange rate fluctuations pose a major risk to the profitability of both companies. From the perspective of a U.S.-based investor, it seems worth noting that Unilever’s reporting currency is the euro and the company also declares its dividend in euros. Investors who meet their living expenses in U.S. dollars are therefore directly exposed to currency risk through the share price (Unilever’s stock is primarily listed in London) and the dividend, as underscored by the decline in dividend payouts in in dollar terms recent quarters.
Growth
Sales growth has been muted for both companies over the last nine (fiscal) years – UL’s sales have grown at a compound annual growth rate (CAGR) of 0.6% since 2013, while PG’s sales have declined by 0.4% each year on a compounded basis since fiscal 2014. However, this is not necessarily a sign of weakness, as both companies are growing through optimizations of their brand portfolios. Operating income, adjusted for restructuring charges and impairments, grew at a CAGR of 1.7% and 1.9%, respectively, or at a CAGR of 1.8% and 1.9%, respectively, on a non-adjusted basis during these periods. FCF, as commonly derived (operating cash flow less capital expenditures), grew faster at Unilever than at P&G, with a CAGR of 6.5% over the last nine years compared to 3.7%. With operating profit and free cash flow growing faster than sales, both companies appear to be successfully pursuing their growth strategy.
PG’s and UL’s Performance In A Recession
With Europe in particular, but probably the whole world, expected to be in an economic downturn, stocks of consumer staples companies like PG and UL are often mentioned “safe havens.” As a result, the share prices of both companies have held up quite well (in their respective home currencies), but of course let-off some steam coming out of speculation-driven 2021. Smaller companies in particular are feeling the pressure from consumers who are switching to discount brands. PG and UL are very large companies with a wide economic moat, according to Morningstar.
Therefore, it is hardly surprising that both companies are able to pass on price increases and are in a very comfortable negotiating position with their suppliers. However, it does not seem unreasonable to expect declining or stagnant volumes for products that may be considered discretionary in part, such as branded ice cream or comparatively expensive (nominally) branded hygiene and household care products. At some point, this can be expected to translate into stagnant or declining revenues, in part because a significant portion of the companies’ costs are tied to the price of energy. From a portfolio, profitability, and geographic exposure perspective, I believe Unilever is somewhat more vulnerable to an economic downturn than Procter & Gamble.
Risks
In addition to the recession and currency risks already mentioned, execution risks are particularly relevant for companies that grow through acquisitions. Procter & Gamble went through a difficult phase after the Great Financial Crisis due to a cluttered and unfocused brand portfolio and high costs. P&G has gone through a period of mismanagement. However, at the initiative of activist investor Nelson Peltz, management has streamlined the portfolio, aggressively cut costs, reduced debt, and gotten back on track in terms of organic growth. Since fiscal 2018, P&G has grown sales at a CAGR of 4.7%, its free cash flow margin is back to around 20%, and its return on invested capital (ROIC) is in the mid-20% range.
So far, under current CEO Alan Jope, who was appointed in January 2019, Unilever’s operating profit was flat, free cash flow grew at a CAGR of just 2.4%, and net debt increased by 23%. The company’s free cash flow margin for 2019-2021 is also far behind that of P&G, at around 13%. In addition, Jope’s heavy emphasis on ESG and political issues (e.g., Ben & Jerry’s), as well as its announced and later abandoned intention to acquire GSK’s consumer health business, did not go down too well with shareholders. It’s hardly surprising, then, that Nelson Peltz is pushing for a change. He was named a non-executive director in May 2022, and likely due in part to Peltz’s push, Jope will step down as CEO at the end of 2023. I think this is generally good news, but the new CEO will obviously have to move many levers in the right direction to get Unilever back on track.
Other risks include litigation risks and balance sheet-related risks. The former are ubiquitous, but in my view less pronounced in a consumer staples company than, for example, in an industrial company with a long history such as 3M Company (MMM). The latter are much more relevant to PG and UL because of their business model, but should not be overstated because of the reliability of their cash flows and their very competitive position.
While Unilever’s net debt increased from 2.2 times free cash flow in 2014 to 4.0 times in 2021, Procter & Gamble’s net debt decreased from 2.5 times free cash flow to 1.8 times in the last nine years. As a result, Unilever is in principle more vulnerable to rising interest rates. However, it is important to remember that Unilever benefits from low interest rates in the Eurozone, and I personally believe that the European Central Bank is in a much worse position than the Federal Reserve in terms of raising interest rates.
Part II – Free Cash Flow Analysis Of Procter & Gamble And Unilever
In the following, I will outline the main aspects that I consider when calculating sustainable or normalized FCF (nFCF). In part, the discussion may seem somewhat theoretical, so readers interested only in the actual implications of my modifications can skip the following two sections and look directly at Figure 4 and Figure 5, which illustrate the results of the different approaches for Unilever and P&G, respectively.
Important Aspects Beyond Capital Expenditures
I have already briefly mentioned free cash flow in the conventional sense – operating cash flow less capital expenditures. Operating cash flow is calculated on the basis of operating profit (Unilever) or net profit (P&G). Accordingly, in the case of Unilever, investors should be careful to manually include net interest expenses (and preferred dividends through 2018) as they represent cash flows from financing activities (the third major part of a cash flow statement). Capital expenditures are cash outlays by a company to upgrade, maintain, or acquire tangible assets such as property, plant and equipment, or intangible assets such as software or patents.
The two companies in question differ slightly in that Unilever also reports proceeds from the sale of property, plant and equipment, which I have netted against capital expenditures. Capital expenditures are part of the second major section of a cash flow statement – cash flows from investing activities. This section also includes cash flows related to the acquisition or disposal of other businesses and the purchase or sale of investment securities unrelated to day-to-day operations. The latter are often observed in the cash flow statements of pharmaceutical companies.
Determining free cash flow by subtracting capital expenditures from operating cash flow is a correct concept in itself, but I think it is important to consider at least these four additional aspects:
Working Capital Accounts
Movements in working capital accounts represent cash flows from operating activities and are therefore to be found in the first part of the cash flow statement. Companies that are, for example, sensitive to economic cycles can show significant movements in their working capital accounts. In part because they are relatively recession-resistant companies, Unilever and P&G are not particularly susceptible to significant fluctuations in working capital accounts (Figure 1). Since 2013, Unilever’s changes in working capital have typically been well below 1% of sales, with the exception of 2015 (+1.4%), 2018 (-1.6%), and 2020 (+1.3%), which are still very modest levels. For P&G, working capital movements have been somewhat more significant, averaging +/- 1.4% of sales since FY2014, and most pronounced in FY2015 (+2.1%), FY2016 (+2.2%), FY2019 (+2.0%), and FY2020 (+2.7%). Positive changes indicate that the company generated cash through a net decrease in working capital-related assets and/or delayed cash outlays due to an increase in working capital-related liabilities. When normalizing free cash flow with respect to working capital movements, I subtract each year’s net cash flow from working capital movements and add a three-year moving average.
Figure 1: Net cash flows from working capital movements between 2013 and 2021 (Unilever) and fiscal 2014 and fiscal 2022 (P&G) (own work, based on both companies’ cash flow statements of the last nine years)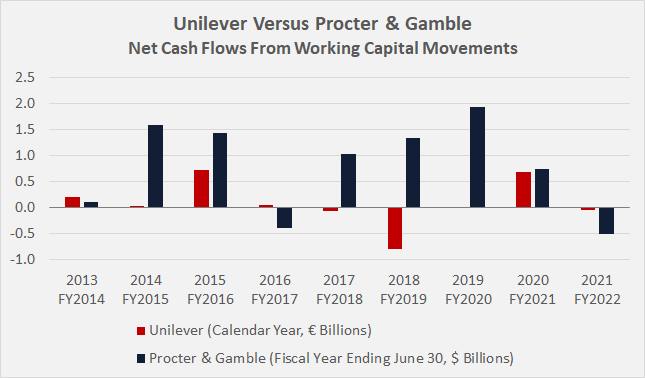
Even though PG and UL are not really cyclical, it is still important to closely monitor working capital movements. As both companies, in part, grow through acquisitions, they typically acquire working capital-related assets such as trade receivables. Therefore, I would be very wary of a company that regularly reports a cash inflow due to a decline in such receivables. This is a non-sustainable form of operating cash flow. Over the past nine years, PG and UL have reported net cash outflows due to changes in accounts receivable of $0.7 billion and $2.1 billion, respectively – obviously unsuspicious developments.
As an aside, it is also very important to keep an eye on accounts receivable when assessing the efficiency of a company’s working capital management. Procter & Gamble reduced its days sales outstanding (DSO) from 28 days in fiscal 2013 to 22 days in fiscal 2022, while Unilever saw an increase in this efficiency metric from 21 days in 2014 to 24 days in 2021. It should be noted that Unilever’s DSO in 2021 represents one of the better years, which is underscored by the three-year average of 29 days.
Share-based Compensation Expenses
The granting of share-based compensation is in itself a non-cash event. Since this form of compensation (mostly of executives) is earnings-relevant, it is added to net income when calculating operating cash flow. However, when stock options are exercised, common shareholders are diluted and companies typically repurchase shares to offset the dilution (a cash outflow due to financing activities). The accounting for such non-cash compensation is not discussed in this article, but it should generally be considered a relatively conservative approach to fully deduct stock-based compensation expenses from operating cash flows. I view this as a small intrinsic margin of safety. In the context of technology companies that rely significantly on share-based compensation (see my related article), this approach should of course be considered on a case-by-case basis.
Impairment Charges
This aspect is understandably very relevant for the two companies at hand, as they grow, in part, through acquisitions and overly costly acquisitions carry the risk of impairment charges related to goodwill and other intangible assets such as trademarks. Since fiscal 2014, PG has recorded impairment charges on goodwill and indefinite-lived intangible assets of nearly $11 billion, of which approximately $8 billion is attributable to the write-off of the Gillette Shave Care business. However, I have chosen not to include these charges – which are arguably not insignificant – as they were taken prior to the completion of P&G’s transformation.
P&G has not made any significant acquisitions since fiscal 2020, so I consider the current likelihood of further impairment charges to be relatively low. In this context, it is important to understand that companies are required to regularly review the recoverability of the value of all major cash-generating units. Unilever has not recognized any major impairment charges since 2013, with the exception of $305 million and $198 million related to its Slim-Fast business in 2014 and its Blueair air purification business in 2018, respectively. However, the company appears to be in a never-ending process of reshaping its portfolio and, as a result, regularly recognizes restructuring-related costs (averaging 8.5% of operating income since 2013). As these costs are relevant to earnings and represent actual cash expenses, they are implicitly included in operating cash flow and are also not added back under IFRS accounting rules.
Finance Leases
Finance leases and operating leases entitle the lessee to use an asset for a limited period of time. The former have the economic characteristics of a purchased asset from an accounting perspective, while the latter are treated as genuine leases. Payments under operating and finance leases are cash flows from operating activities and are therefore implicitly included in the conventional calculation of FCF. Repayments under finance leases are recognized as cash flows from financing. A conventional FCF calculation therefore overestimates the sustainable FCF of a company with finance leases. Finance leases are relevant for Unilever, but not for Procter & Gamble, as shown in the latest 10-Ks. With the adoption of IFRS 16 in 2019, the capital element of lease payments became more significant for Unilever (i.e., 5% to 6% of OCF versus 0.5% or less prior to 2019).
Other items a questioning investor might consider include losses on early extinguishment of debt, pension-related expenses, deferred taxes, unrealized revenue or cash flows due to regular acquisitions and divestitures of other businesses. Since acquisitions and divestments are of particular importance to P&G and Unilever, I will discuss this topic in the following section, while I will not elaborate on the other items mentioned.
How To Account For Regular Acquisitions And Disposals?
As mentioned earlier, both P&G and Unilever grow, in part, through acquisitions. P&G has not made a significant acquisition since fiscal 2020, while Unilever continues to be very active in reshaping its portfolio. The somewhat different behavior is evident in Figure 2, which shows net cash flows due to acquisitions and asset disposals (excluding purchases and sales of financial assets, of course). Between 2013 and 2021, Unilever spent more than €4 billion on acquisitions on a net basis, while Procter & Gamble had a net cash inflow of $1 billion, although it acquired Merck KGaA’s over-the-counter medicines business (OTCPK:MKGAF, OTCPK:MKKGY) in fiscal 2019.
Figure 2: Net cash flows from asset acquisitions and disposals between 2013 and 2021 (Unilever) and fiscal 2014 and fiscal 2022 (P&G) (own work, based on both companies’ cash flow statements of the last nine years)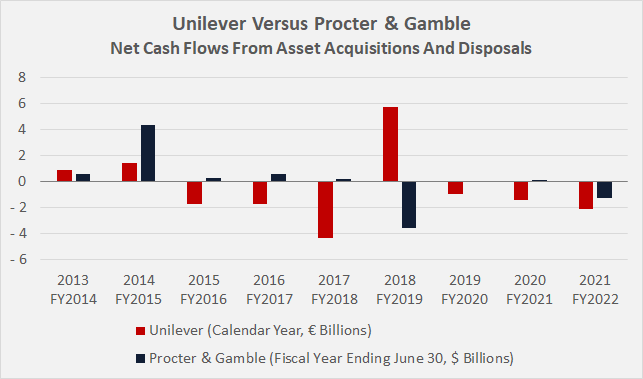
It is at the discretion of the investor asking the question whether recurring acquisitions and disposals should be included in the calculation of free cash flow. Conservative investors might include these items for companies that grow through acquisitions, as is the case with Unilever in particular. In this context, it also seems worth noting that the company’s net debt has more than tripled since 2013 (Figure 3), while net cash flow from acquisitions totaled €4 billion – a sign that the company’s operating cash flow after capital expenditures has not been able to sustain the company’s dividend, share buybacks, and acquisition strategy (see next section).
Figure 3: Unilever’s net debt since 2013 (own work, based on the company’s 2013 to 2021 annual reports)
Wrapping Up – Comparing Conventional FCF To Sustainable FCF
Figure 4 compares the conventionally obtained FCF of Unilever – as also reported in the company’s annual reports – with nFCF, i.e., FCF normalized with respect to working capital movements and adjusted for share-based compensations as well as cash flows from finance leases, and nFCF after accounting for acquisitions and asset disposals. Between 2013 and 2021, Unilever generated free cash flow of €47.1 billion. nFCF is 6% lower (€44.3 billion) and nFCF adjusted for acquisitions and asset disposals is 15% lower (€40.2 billion). Over the last nine years, Unilever distributed €34 billion to shareholders in the form of dividends, and together with share buybacks worth €15.4 billion, the company distributed 123% of its total 2013-2021 nFCF after asset transactions. It is noteworthy that the share buybacks not only offset the dilution from share-based compensation, but also reduced the weighted-average number of diluted shares outstanding by 10.8% over the last nine years.
Figure 4: Three approaches to calculating Unilever’s free cash flow (own work, based on the company’s 2013 to 2021 annual reports)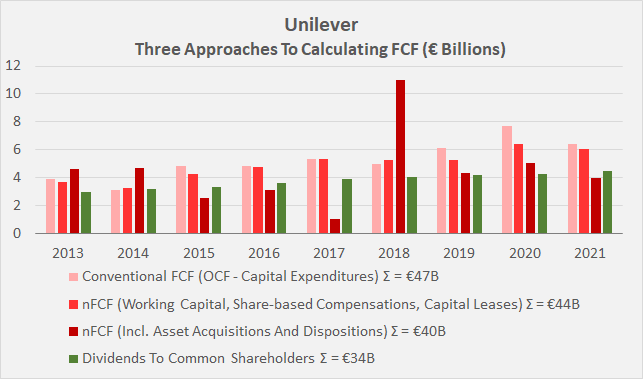
P&G is a considerably larger company and generated $109 billion in free cash flow over the last nine fiscal years. Normalizing with respect to working capital movements and adjusting for share-based payments reduces FCF by 3.5%. Taking into account the acquisition and disposal of assets between fiscal 2014 and fiscal 2022, FCF amounts to $106 billion, 2.5% lower than the conventionally calculated FCF. Figure 5 shows the differently calculated FCF on an annual basis, confirming that P&G’s cash flows are more consistent and less susceptible to adjustment than Unilever’s. Figure 5 shows that PG’s dividend is more generously covered by free cash flow, but when share repurchases are included, PG paid out 121% of its nFCF after asset transactions – a very similar percentage to Unilever.
Figure 5: Three approaches to calculating Procter & Gamble’s free cash flow (own work, based on the company’s fiscal 2014 to fiscal 2022 10-Ks)
Clearly, adjusting free cash flow for certain items that can be assumed to be recurring and ultimately more or less directly cash flow-relevant will result in free cash flow that is lower than what is commonly referred to as FCF. Adjusted free cash flow should also be compared to the company’s dividend payout and share buybacks – many companies, including PG and UL, pay out more money to shareholders than they actually earn. This can go well for a while (especially for companies that are not very sensitive to economic cycles), but should still be monitored closely.
The Impact Of Normalized Free Cash Flow On Company Valuation
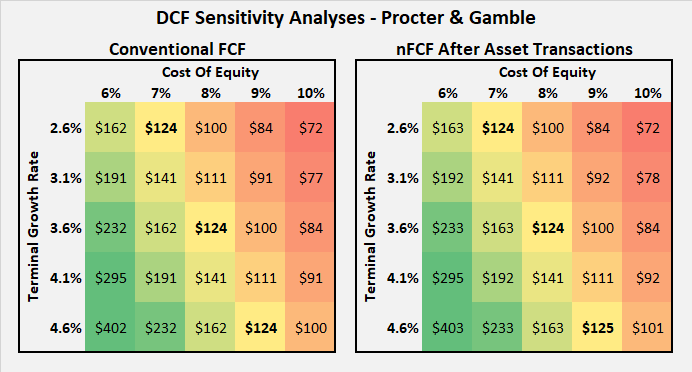
Once normalized free cash flow has been determined, the impact of adjustments in a discounted cash flow (DCF) calculation can be easily analyzed. Figures 6 and 7 show DCF sensitivity analyses for Unilever and P&G, respectively. The left panel in both figures was calculated using the three-year average of conventionally determined FCF, while the right panels were calculated using nFCF after asset acquisitions and disposals.
All four analyses were calibrated to reflect the current stock price in the middle of each box, using a cost of equity of 8%. Note that Figure 6 (Unilever) shows 1% lower growth rates. Consequently, the market currently expects Unilever to grow more slowly than P&G, assuming the same cost of equity. As expected, Unilever’s fair value analysis is very sensitive to free cash flow adjustments – using nFCF after asset transactions results in a nearly 20% lower fair value estimate for the same growth rate and cost of equity. In other words, an investor valuing Unilever based on nFCF after asset transactions would accept a cost of equity one percentage point lower at the current share price. The significant divergence between the two sensitivity analyses for Unilever is due to the fact that the gap between conventional and normalized FCF has widened in recent years. To account for future acquisitions, I have assumed €450 million per year in net cash outflows due to acquisitions (i.e., 11% of €4.05 billion spent net over nine years).
Due to the almost negligible impact of working capital movements, share-based compensation expenses and acquisitions, the sensitivity analysis for Procter & Gamble has not changed significantly when the adjustments are included. At an 8% cost of equity, P&G is expected to need to grow its nFCF at a terminal growth rate of 3.6% to justify its current share price of $124.
Figure 6: Discounted cash flow sensitivity analysis for Unilever; note that the share price is given in euros due to Unilever’s reporting currency being the euro; at the time of writing, Unilever traded for €45 per share (own work) Figure 7: Discounted cash flow sensitivity analysis for Procter & Gamble (own work)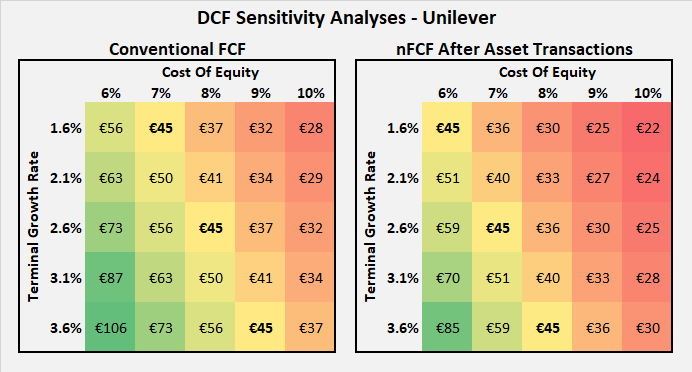
The Impact Of Adjusted Free Cash Flow On Operating Profitability
Another important aspect to consider in the context of conventional and adjusted FCF is operating profitability. I consider ROIC to be the most important profitability metric from a shareholder’s perspective, as it provides information on whether the company is actually able to generate an excess return over its weighted-average cost of capital. However, ROIC is calculated on the basis of net operating profit after tax, which is relatively easy to manage. Cash ROIC (CROIC) relates a company’s invested capital to its free cash flow, and using nFCF after asset transactions results in what I believe is a very good representation of a company’s “true” return potential. Of course, the result should be compared to the cost of equity instead of the weighted-average cost of capital.
Unilever generated an average 14.2% cash return on its invested capital when conventional FCF was used, or 150 basis points less when nFCF after asset transactions was used instead. For Procter & Gamble, the difference between the two approaches is negligible, and the company generated a CROIC of 13.8% on average each year. It seems only fair to point out that Unilever’s CROIC has been declining in recent years, while P&G’s portfolio streamlining has borne fruit in that its three-year average CROIC was 18%.
Using Adjusted Operating Cash Flow To Reveal Earnings Problems
For those interested in cash flow and earnings forensics to uncover potential earnings problems or accounting shenanigans, I would like to briefly introduce Excess Cash Margin (ECM). This is a measure of the relative growth rates of operating income and OCF. The ECM can be calculated by subtracting each year’s operating profit from the corresponding operating cash flow and dividing by that year’s sales.
Figure 8 shows the results of four model calculations: An increasing ECM indicates that earnings are growing slower (or declining faster) than OCF, while a declining ECM indicates that earnings are either growing faster or declining slower than OCF.
Figure 8: Theoretical calculations of excess cash margins to illustrate various scenarios (own work)
For a mature company operating in a recession-resistant sector, one should naturally expect an approximately flat ECM. It is therefore reassuring to see that both Unilever’s and Procter & Gamble’s ECMs show a relatively flat trajectory (Figure 9). However, the shift in Unilever’s ECM to negative percentages shows that the company has a lower cash flow conversion ratio than Procter & Gamble.
Figure 9: Excess cash margin trajectories for Unilever and Procter & Gamble; operating earnings were adjusted for impairments and restructuring charges, operating cash flows were adjusted for share-based compensations and normalized with respect to working capital movements (own work, based on both companies’ cash flow statements of the last nine years)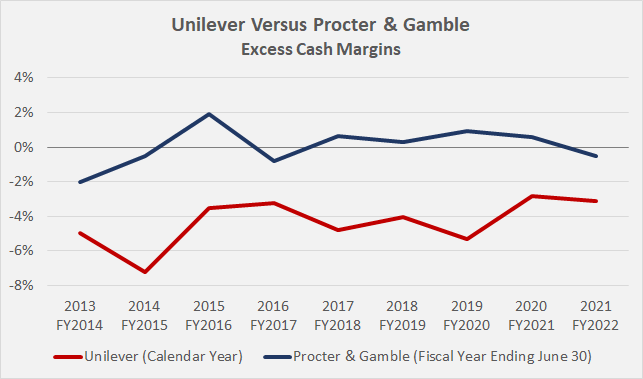
Key Takeaways
- Reported earnings, especially on a per share basis, do not necessarily reflect the actual earnings potential of a company.
- Therefore, it should be considered futile to measure a company’s dividend payout ratio as a percentage of (often even adjusted) earnings per share.
- Analyzing free cash flow takes some time, but with a few basic considerations, it is easy to get a much clearer view of a company’s actual cash earnings potential and thus its dividend coverage.
- At the very least, investors should take a close look at working capital accounts, as they can indicate unsustainable cash flow. Other items worth examining include share-based compensation expenses, impairment charges, and, of course, asset acquisitions and dispositions when they occur on a regular basis.
- Free cash flow adjustments usually result in weaker, but more realistic, actual profitability than originally expected. The adjustments, of course, also affect valuations when discounted cash flow analyses are used.
- By calculating excess cash margins based on operating income and adjusted operating cash flows, cash flow-related problems can be identified already at an early stage.
- Of the two companies discussed, Unilever likely offers more upside, in part due to improvable operating profitability, but is also riskier due to management uncertainty. Procter & Gamble, after its restructuring, is a highly profitable and cash-flow-rich company that is currently trading close to its intrinsic value.
Thank you very much for taking the time to read my article. In case of any questions or comments, I am very happy to hear from you in the comments section below.
Be the first to comment