


HJBC
In June 2020, nearby NYMEX natural gas futures prices fell to the lowest level in a quarter of a century at below $1.50 per MMBtu. Two years and two months later, the energy commodity probed above the $10 per MMBtu level for the first time since 2008. Natural gas is not for the faint of heart.
In 2022, nearby natural gas futures traded in a wide $6.39 range, nearly four and one-half times the June 2020 low. While U.S. futures prices stopped well short of the record high European gas prices established new all-time peaks in 2022 as Russia, the leading supplier of the continent’s gas, used the energy commodity against “unfriendly” European countries supporting Ukraine.
In late 2022 and early 2023, gas prices plunged, with the price of NYMEX futures falling to $3.52 per MMBtu and European prices falling as the winter has been unseasonably warm.
The United States Natural Gas Fund (NYSEARCA:UNG) is an unleveraged ETF product that tracks the short-term price movements in U.S. natural gas futures. The ProShares Ultra Bloomberg Natural Gas product (BOIL) and its bearish counterpart (KOLD) turbocharge UNG’s price action on the up and downside.
From over $10 to under $4 in five months
Trading natural gas is not for the faint of heart, and the price action can be as wild as riding a psychotic horse through a burning barn. After reaching a 25-year low at $1.44 per MMBtu in June 2020, the price rallied nearly seven-fold to a 14-year high in August 2022.
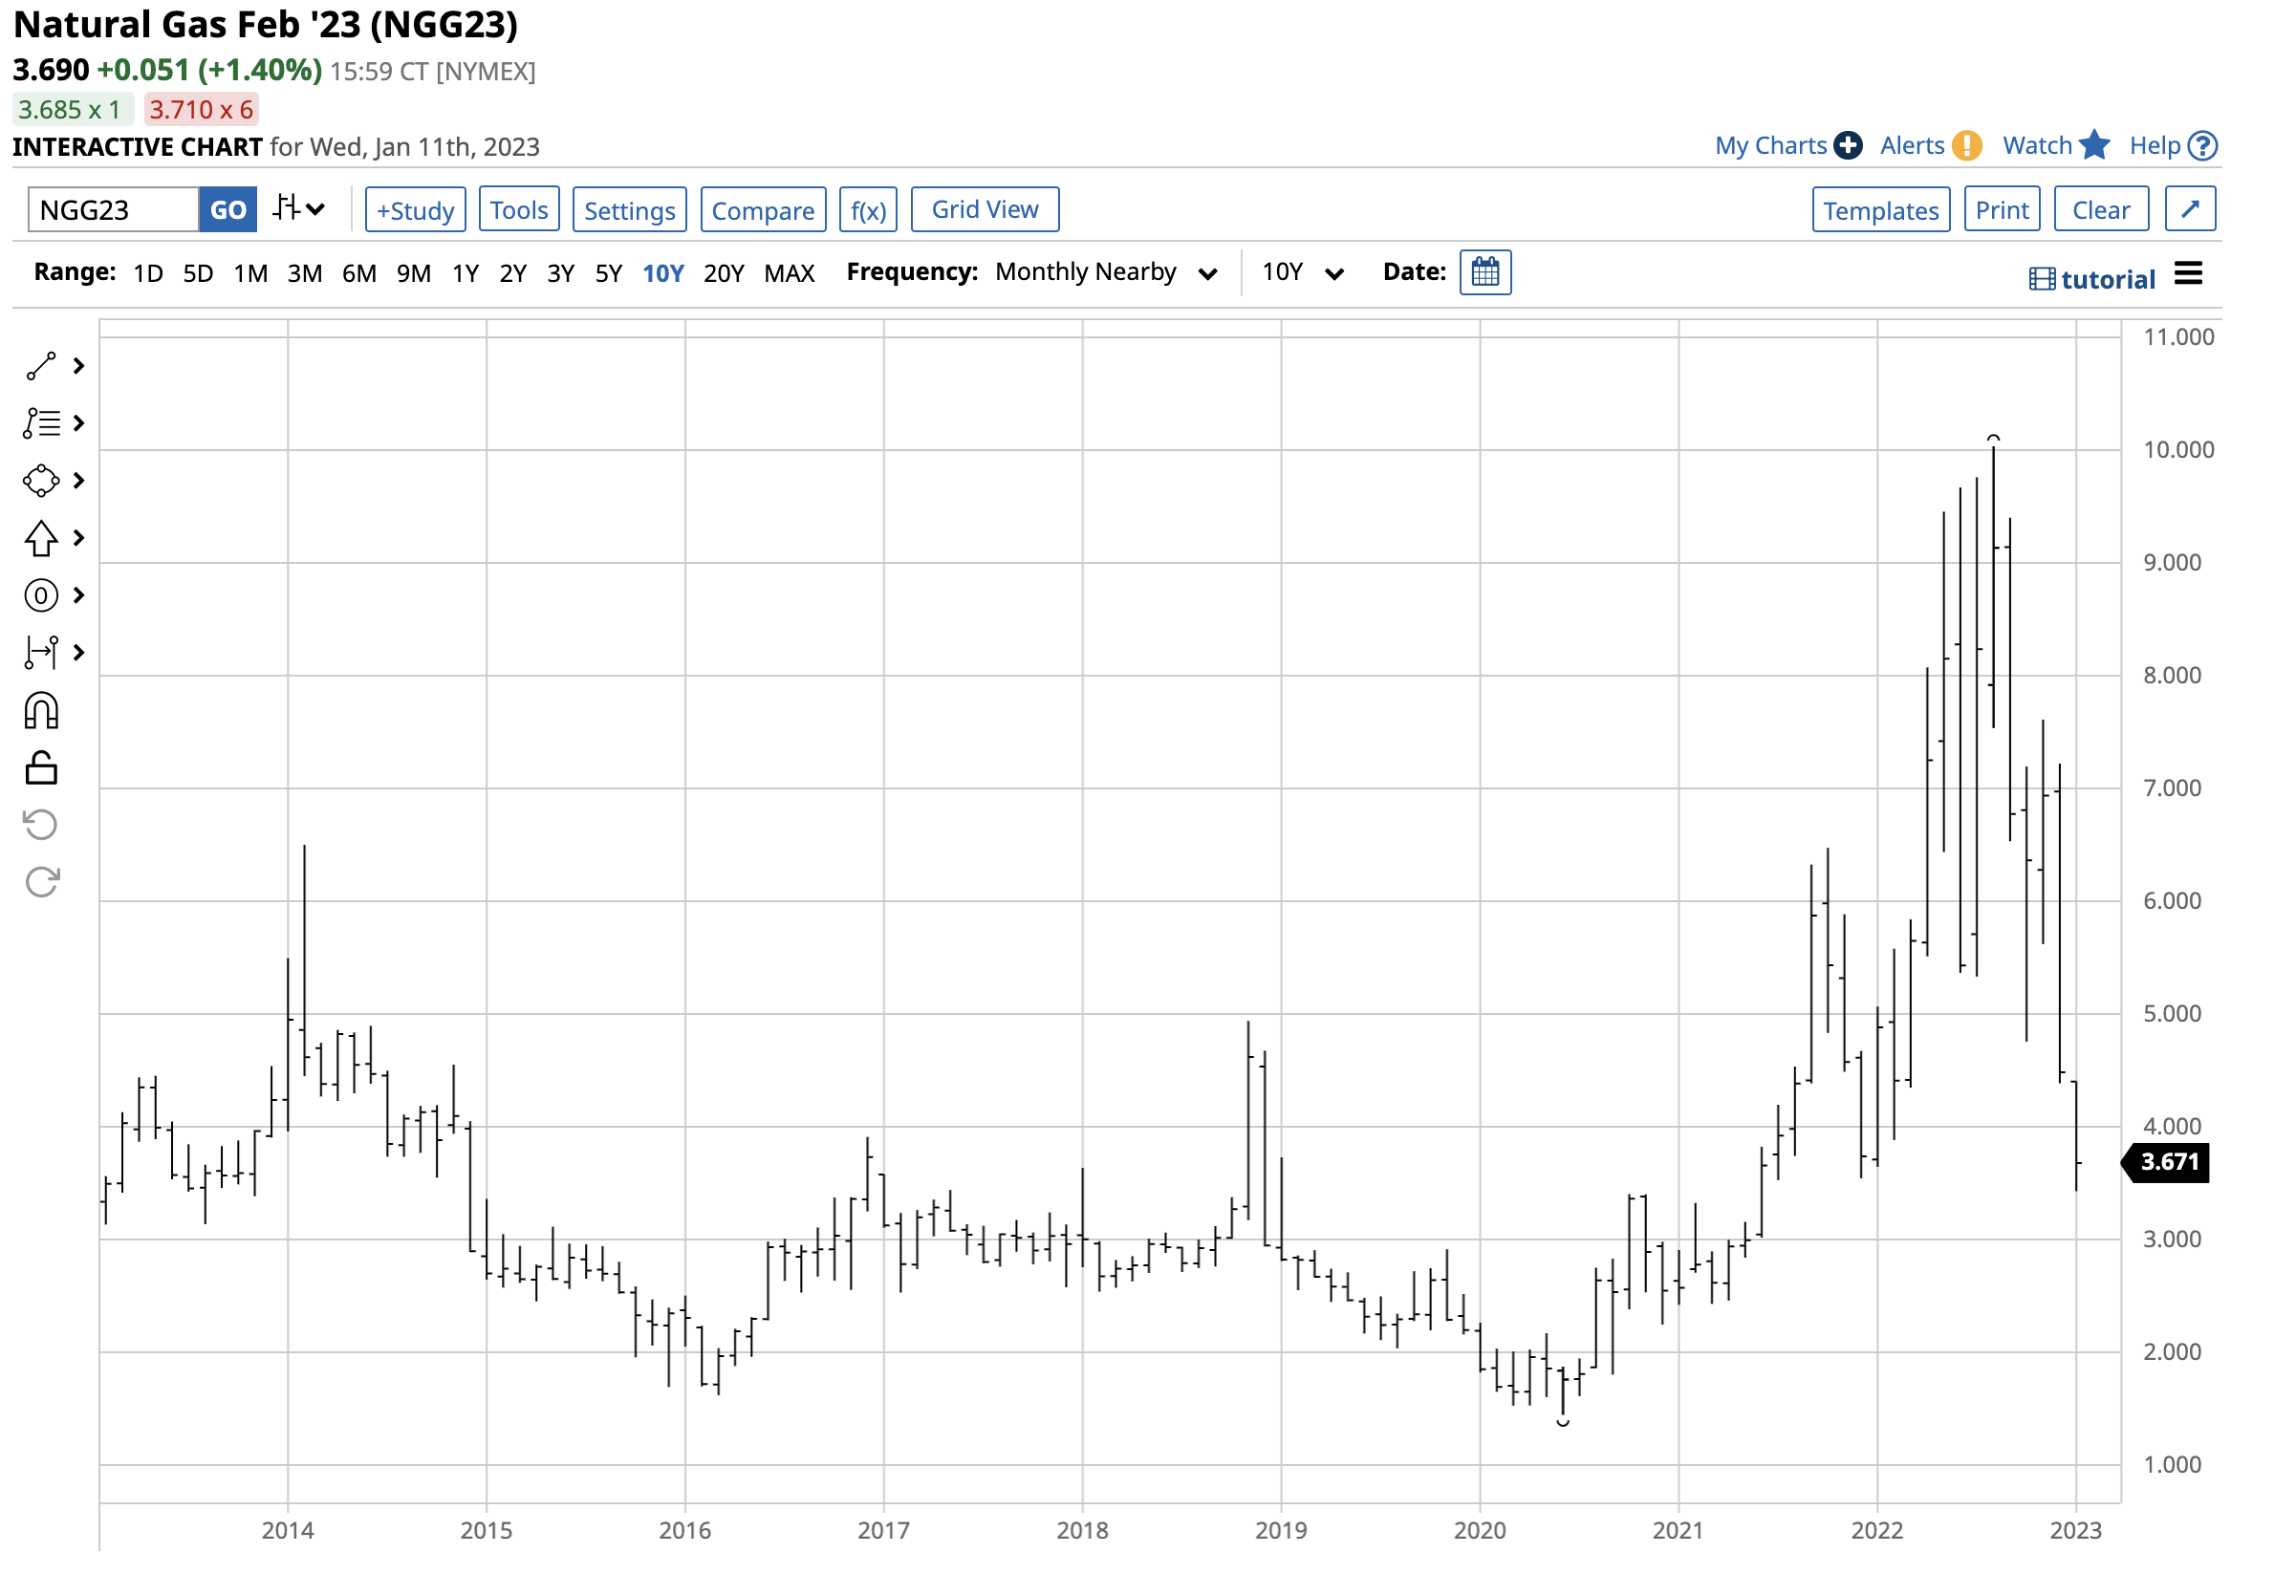
Ten Year U.S. NYMEX Natural Gas Futures Chart (Barchart)
The chart highlights natural gas’s rise that took the price to $10.028 per MMBtu in August 2022, where it ran out of upside steam. Even though it’s the heart of the 2022/2023 peak winter demand season and extreme supply concerns in Europe, nearby U.S. natural gas prices have dropped like a stone over the past five months. The nearby contract fell to $3.422 per MMBtu in early 2023, a 65.9% drop from the August high.
Seasonality: Natural gas jumped in late summer and tanked in early winter
U.S. natural gas prices typically rise at the beginning of the annual withdrawal season that runs from November through March. Increased demand for heating during the winter supports prices, and prices often reach seasonal lows from March through the late spring and can rally during the summer as the cooling demand peaks.
Natural gas replaced coal in U.S. electricity generation, increasing the energy commodity’s demand-side fundamentals. Moreover, the liquefication of U.S. natural gas now allows it to travel the world on ocean vessels to regions with much higher prices. Before LNG, the North American pipeline network limited the addressable market for U.S. natural gas supplies.
Meanwhile, massive discoveries of natural gas reserves in the U.S. Marcellus and Utica shales increased the energy commodity’s supply-side fundamentals. The U.S. natural gas market matured since the CME’s NYMEX division introduced futures contracts in 1990.
In 2022, nearby natural gas futures traded in a $6.39 range from low to high, the most expansive since 2008, as 2022 was no ordinary year in natural gas and markets across all asset classes.
Geopolitics have caused explosive and implosive price action
In 2020, the world’s leading natural gas-producing countries were:
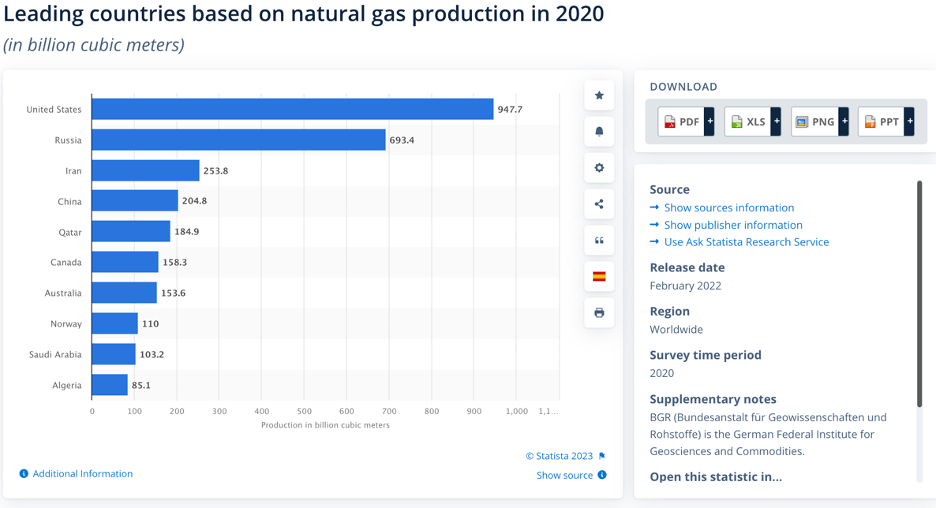
Leading Natural Gas Producing Countries in 2020 (Statista)
The U.S. and Russia were, by far, the leading producers. While the U.S. produces more natural gas than Russia, Russia was the top exporter in 2021.
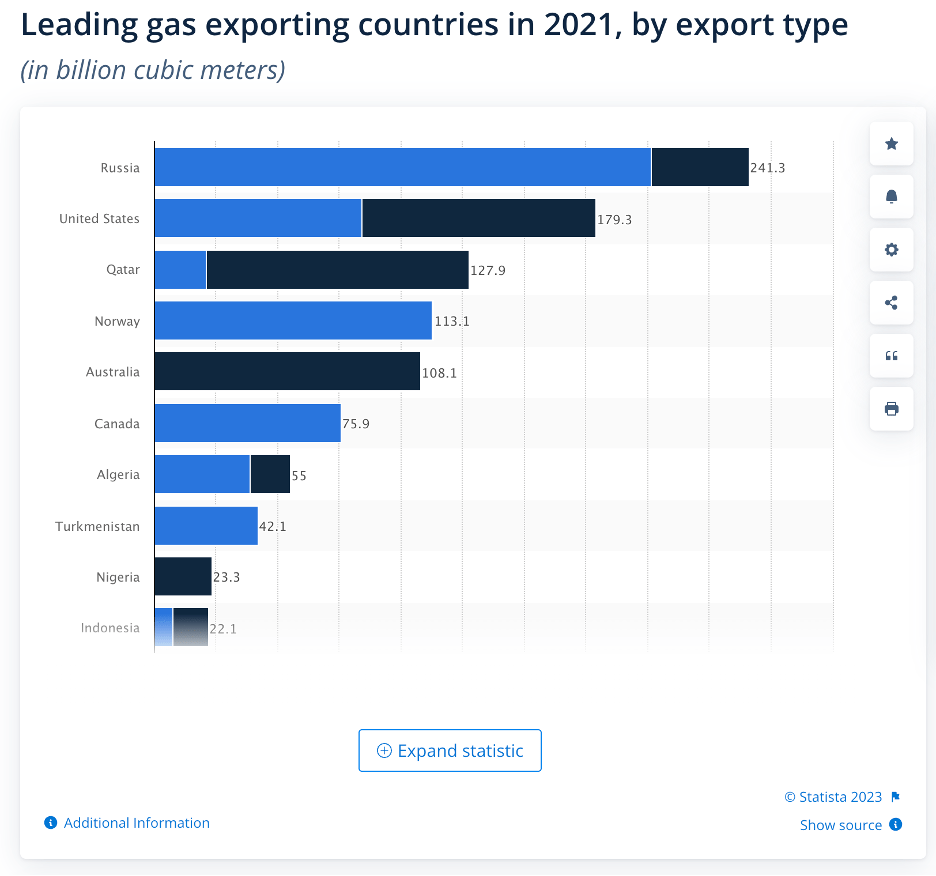
Leading Natural Gas Exporting Countries in 2021 (Statista)
Russian pipelines to Europe make it the energy commodity’s top exporter.
The war in Ukraine, sanctions on Russia, and Russian retaliation against “unfriendly” countries supporting Ukraine distorted natural gas prices and flows in 2022 and 2023. While U.S natural gas futures prices fell short of the record high from 2005, European prices exploded to all-time peaks last year.
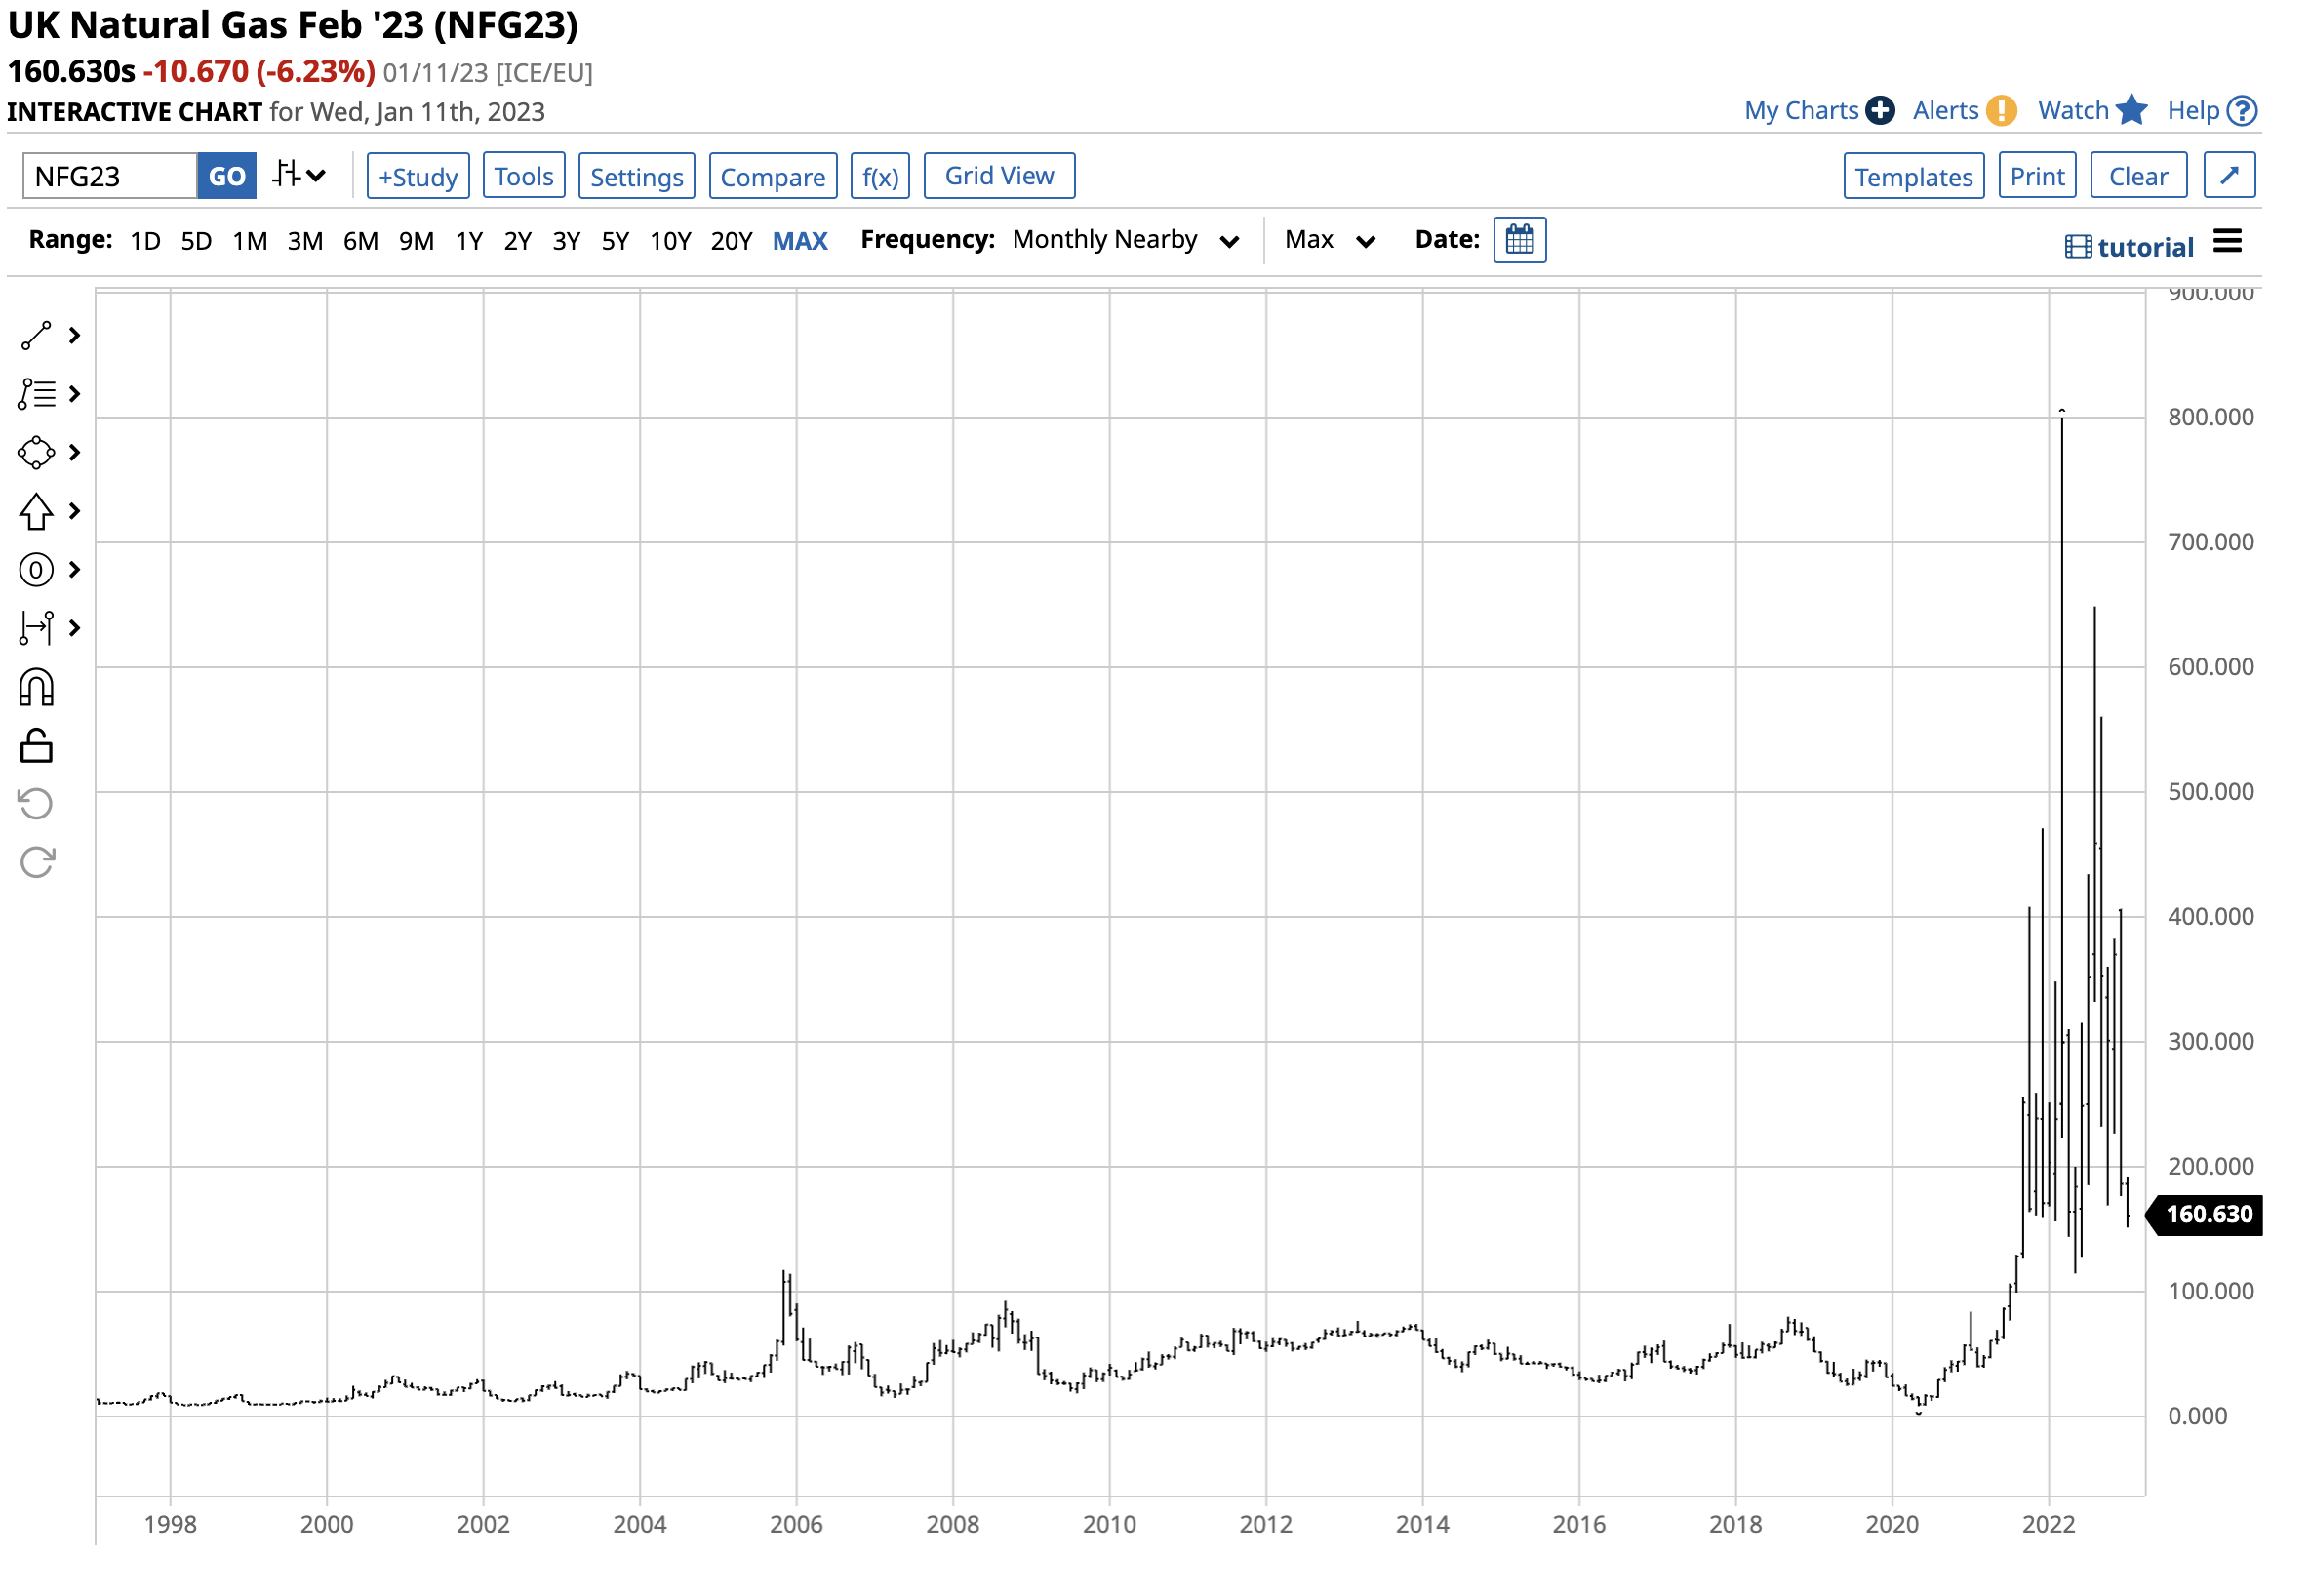
Long-Term Chart of U.K. Natural Gas Prices (Barchart)
The chart shows that U.K. natural gas prices reached a record 800 in March 2022. At the 160.63 level on January 11, the prices remain higher than the pre-2021 117 record high from November 2005.
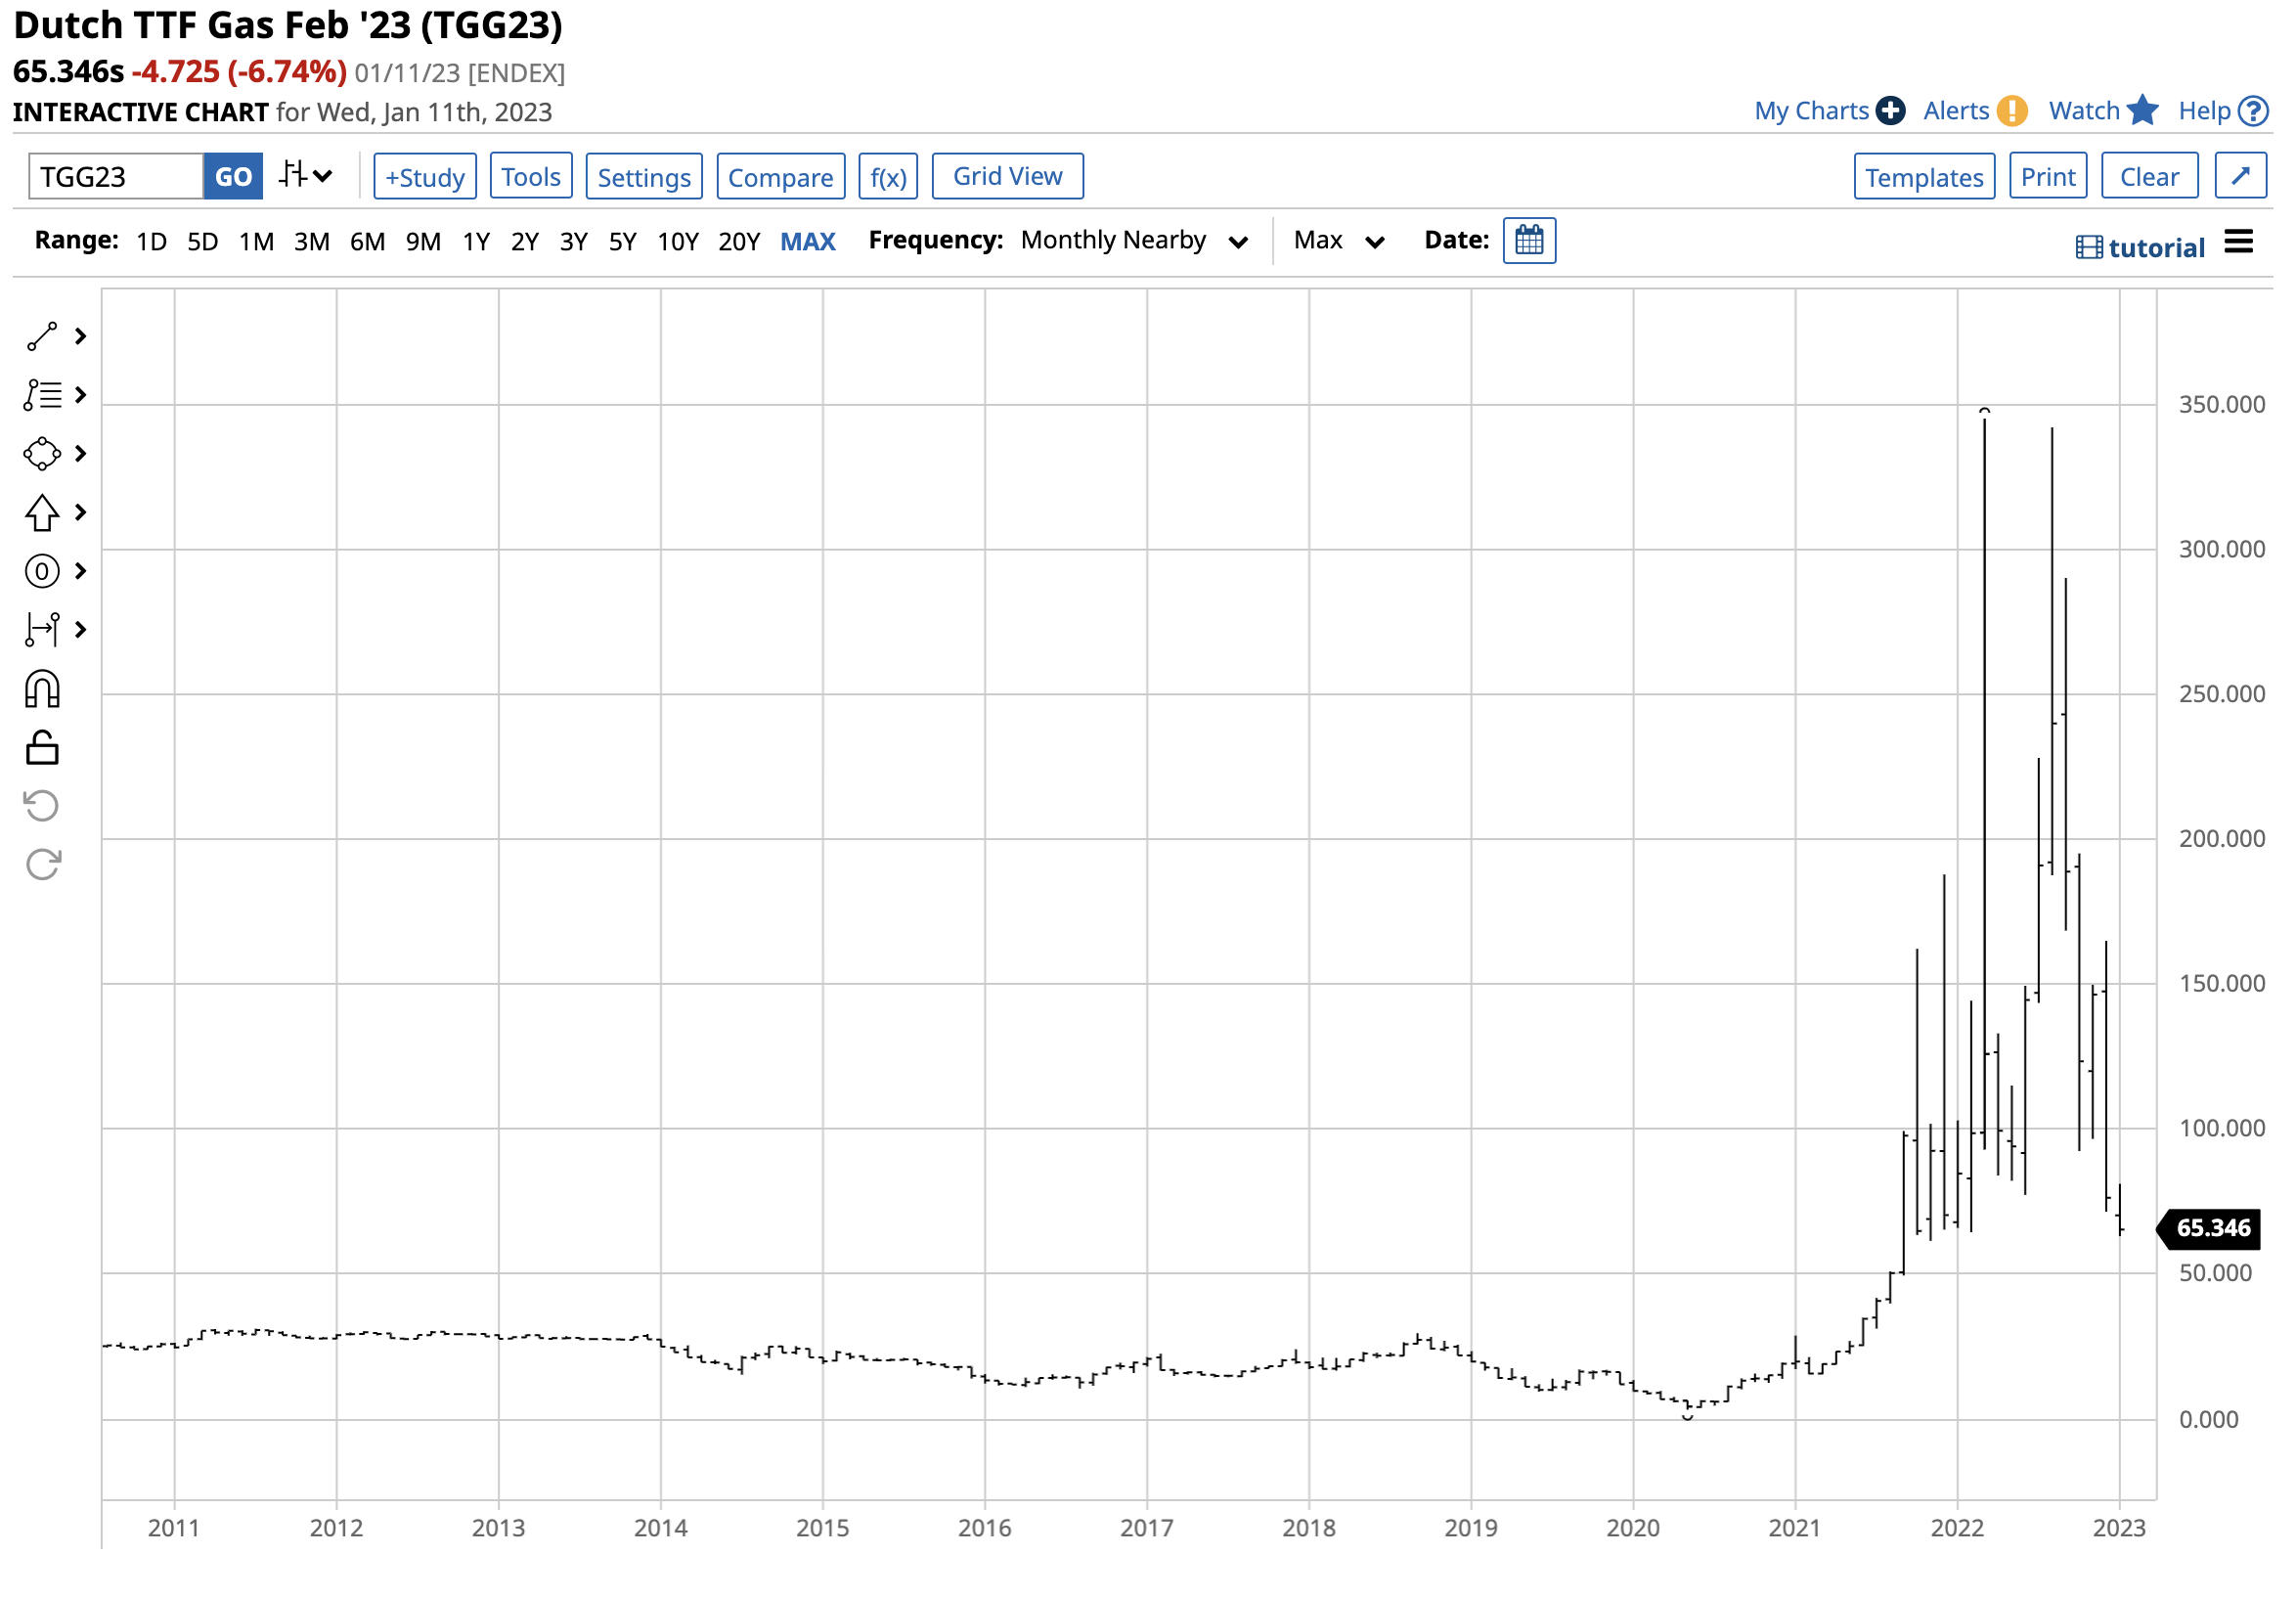
Long-Term Chart of Dutch Natural Gas Prices (Barchart)
Natural gas in The Netherlands rose to a record peak at the 345 level. At 65.346 on January 11, they are still higher than the pre-2021 31.15 high.
A warm winter in Europe has caused prices to decline. Still, the war in Ukraine and NATO’s support have kept prices in record territory as Russia uses natural gas and other commodities as economic weapons. Natural gas has become the energy commodity in the eye of the geopolitical storm. Meanwhile, the U.S. natural gas LNG business is still a burgeoning enterprise with limited ability to fill the European demand void. Moreover, U.S. natural gas inventories were below last year’s level and the five-year average at the end of 2022.

U.S. Natural Gas Inventories as of December 30, 2022 (EIA)
The chart shows at 2.891 trillion cubic feet, natural gas in storage across the U.S. was 9.6% under last year’s level and 6.7% under the five-year average as of December 30, 2022.
Natural gas is back in the buy zone
The war in Ukraine continues to rage, European natural gas prices remain in record territory, and U.S. stockpiles are lower than in past years. Moreover, U.S. energy policy under the Biden administration addresses climate change by supporting alternative and renewable energy production and consumption and inhibiting hydrocarbons, including natural gas. Energy policy has impeded oil and gas fracking and drilling, leading to less output. Meanwhile, prices have dropped like a stone, which could be an opportunity for nimble traders with their fingers on the pulse of the volatile natural gas arena.
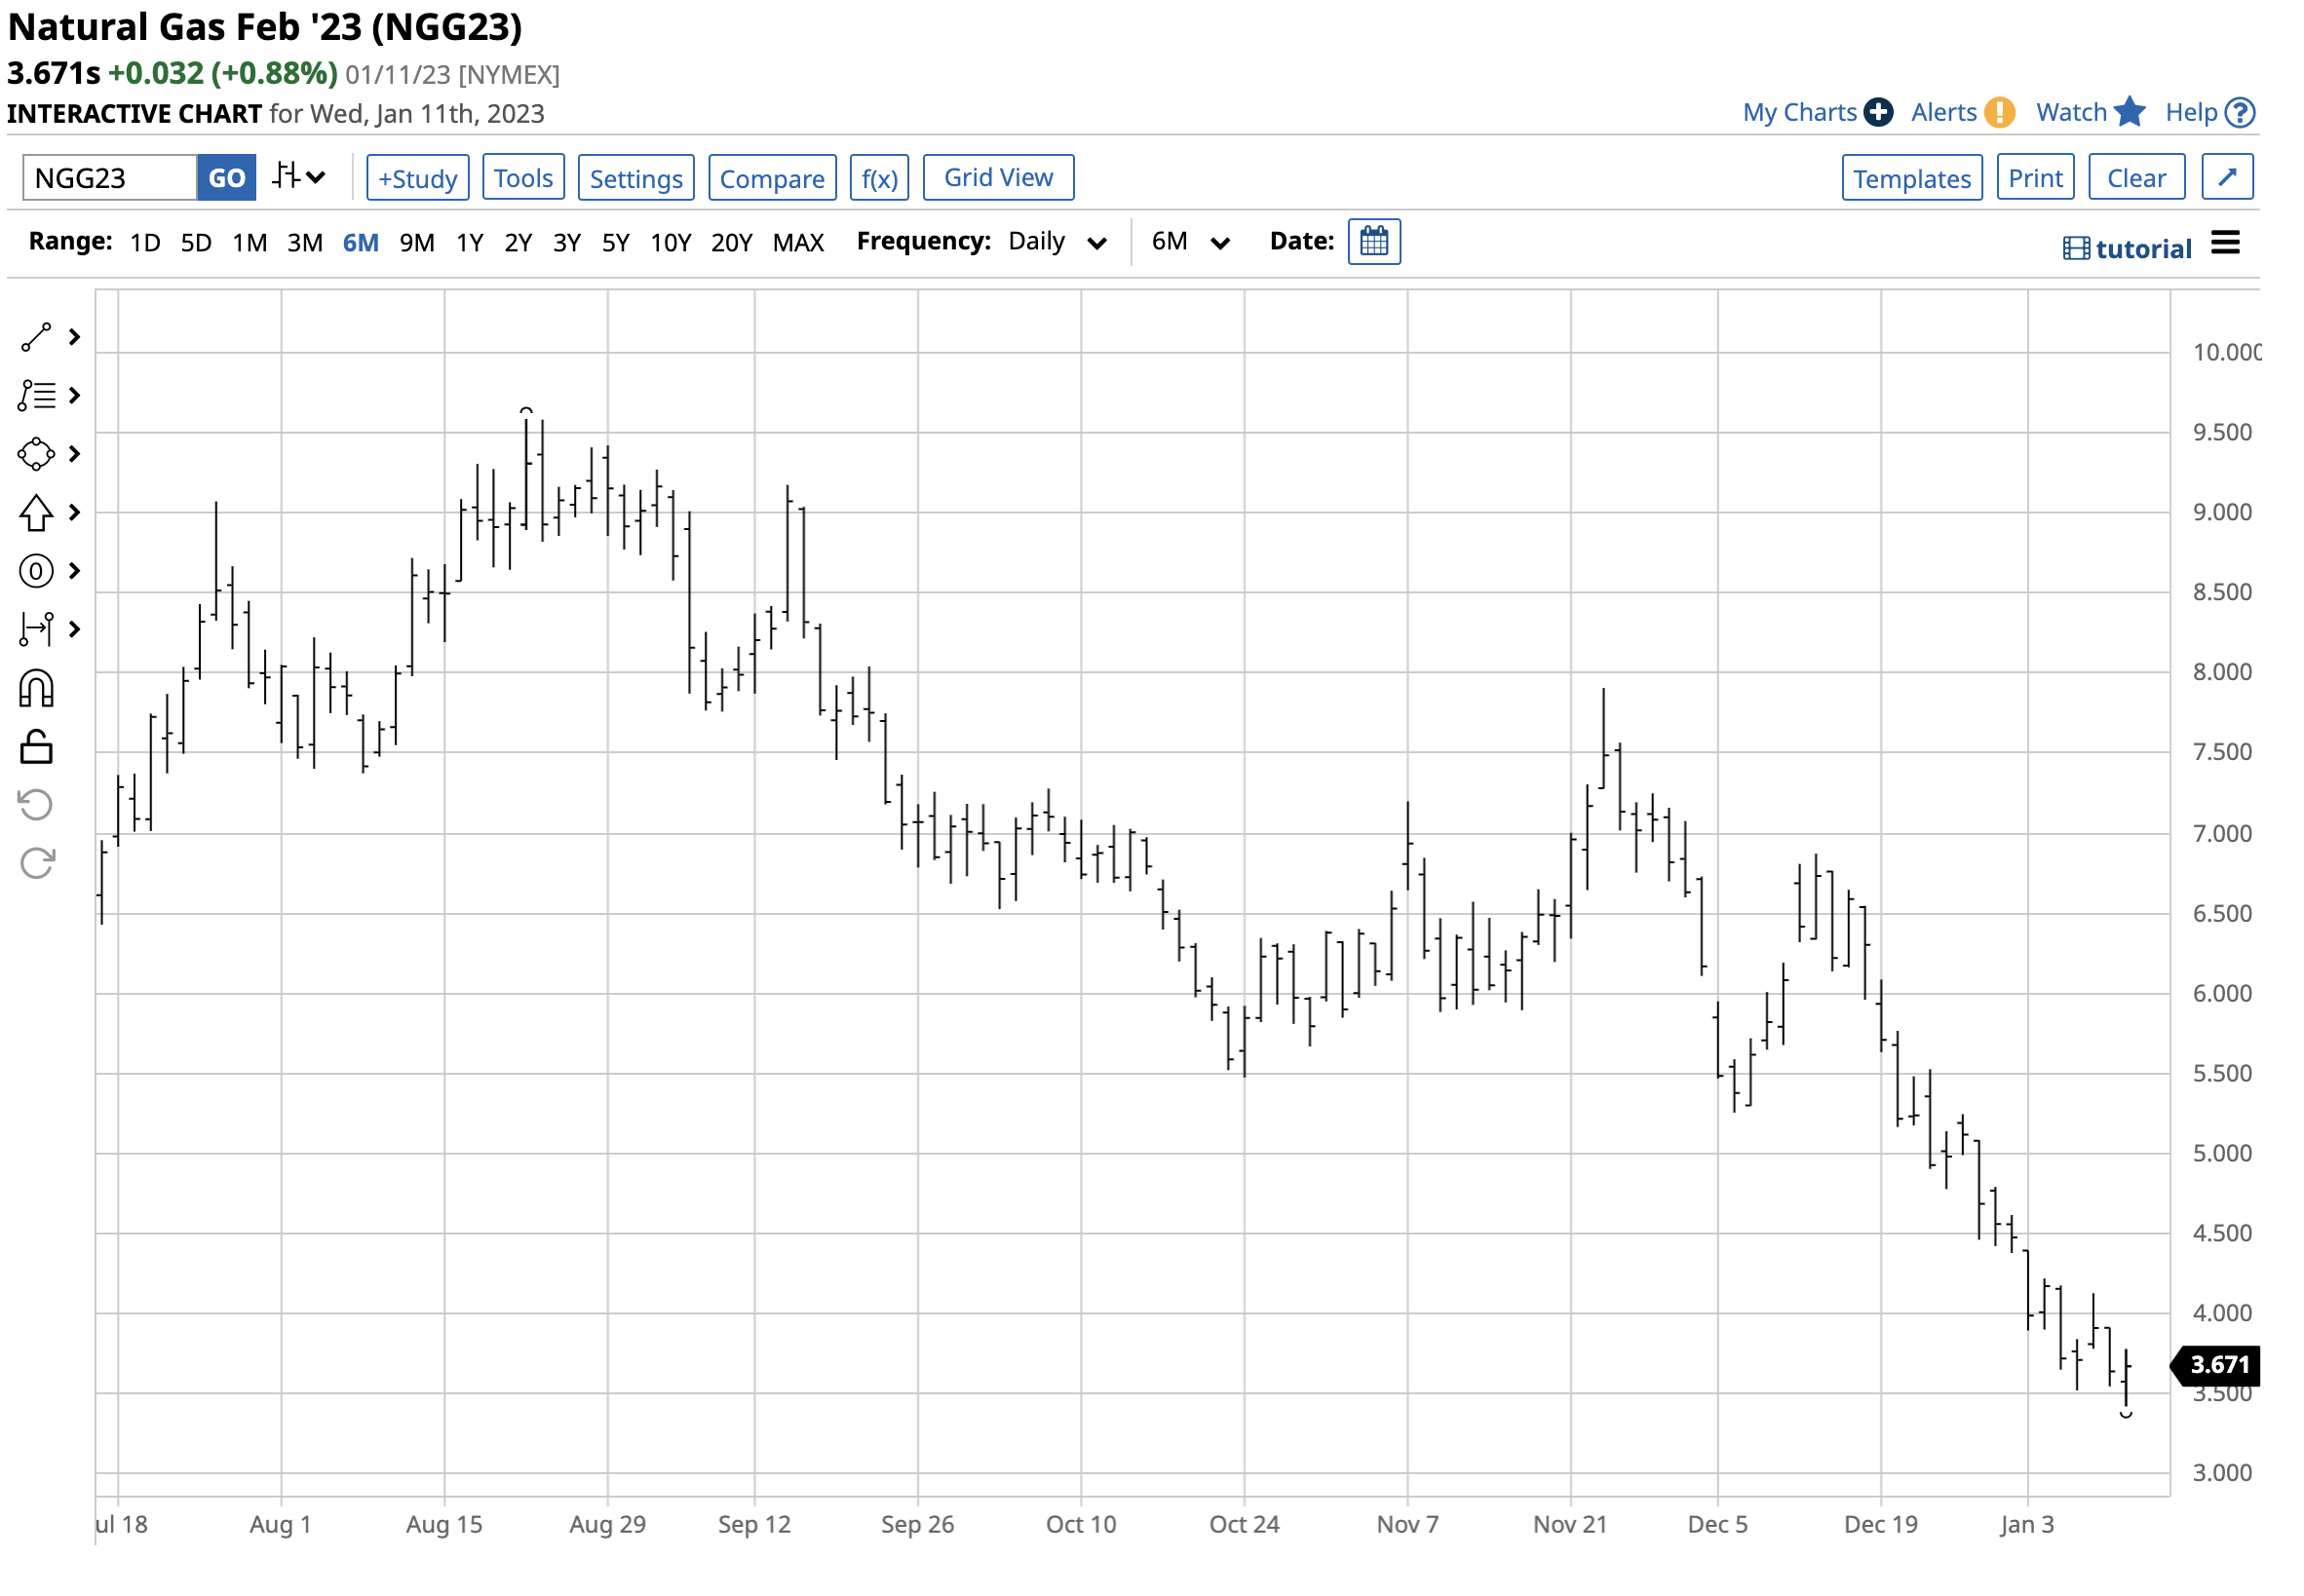
Six-Month Chart of U.S. NYMEX Natural Gas Futures (Barchart)
The chart shows the 61.9% decline of U.S. natural gas for February delivery as the price fell from $9.587 in August 2022 to the $3.422 per MMBtu level on January 11.
Peace will not likely break out in Europe any time soon, and the demand for U.S. natural gas will continue to rise as Western European countries seek to replace Russian gas with alternative suppliers. At below $4 per MMBtu, natural gas offers value. While the price could continue declining, the downside risk is far lower than the upside potential in 2023.
UNG tracks nearby natural gas prices- BOIL and KOLD turbocharge already combustible energy commodity
The most direct route for a risk position in U.S. natural gas is via the futures and futures options on the CME’s NYMEX division. Natural gas is a market for traders, not investors, as the price variance can be hair-raising.
The products available via the stock market platforms provide an alternative to the futures for those looking to participate in the volatile natural gas arena.
The United States Natural Gas Fund (UNG) is an unleveraged ETF product that moves higher and lower with nearby natural gas prices. While UNG does an excellent job tracking the nearby price, it is not for long-term investment, as month-to-month price differences distort the ETF over time. At $11.72 per share on January 11, UNG had close to $493 million in assets under management. UNG trades an average of over 10.125 million shares daily and charges a 1.11% management fee.
Nearby natural gas prices dropped from $10.028 in August 2022 to $3.422 per MMBtu in December, a 65.9% decline.
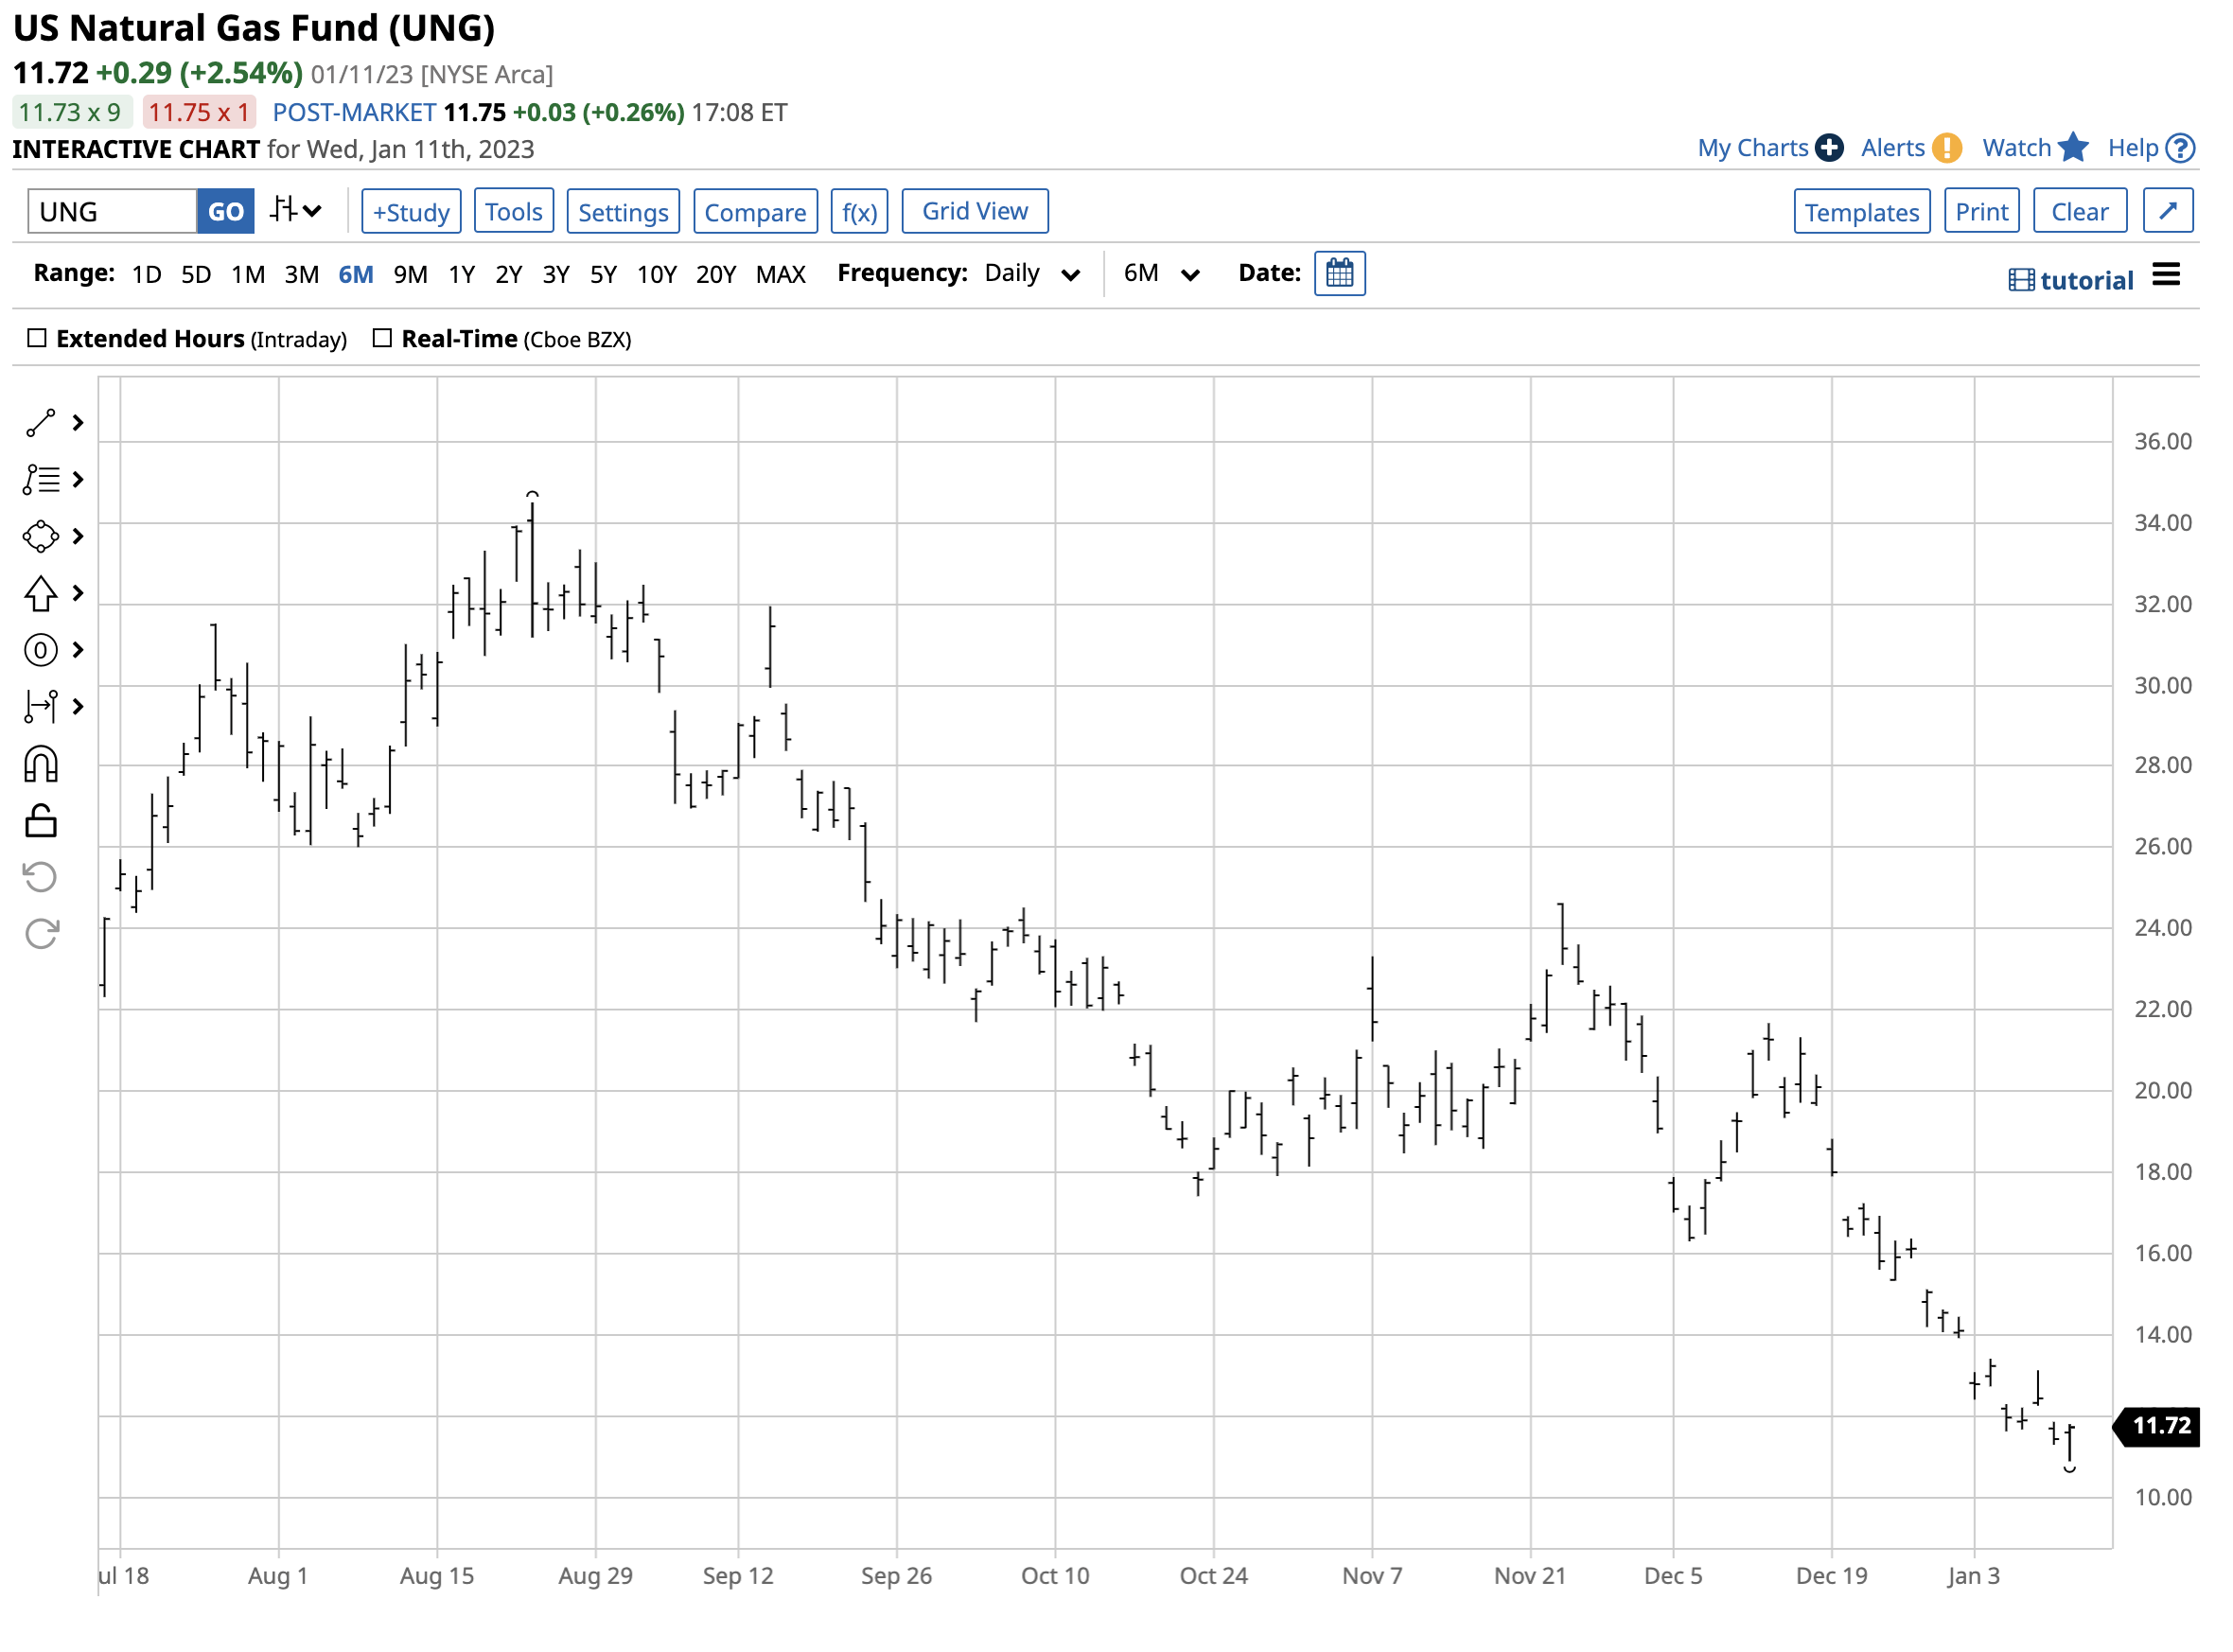
Chart of the UNG ETF Product from August 2022 through January 2023 (Barchart)
Over the same period, UNG fell from $34.50 to $10.89 per share, or 68.4%. The long-term chart shows why UNG is inappropriate for long-term risk positions in the natural gas futures arena.
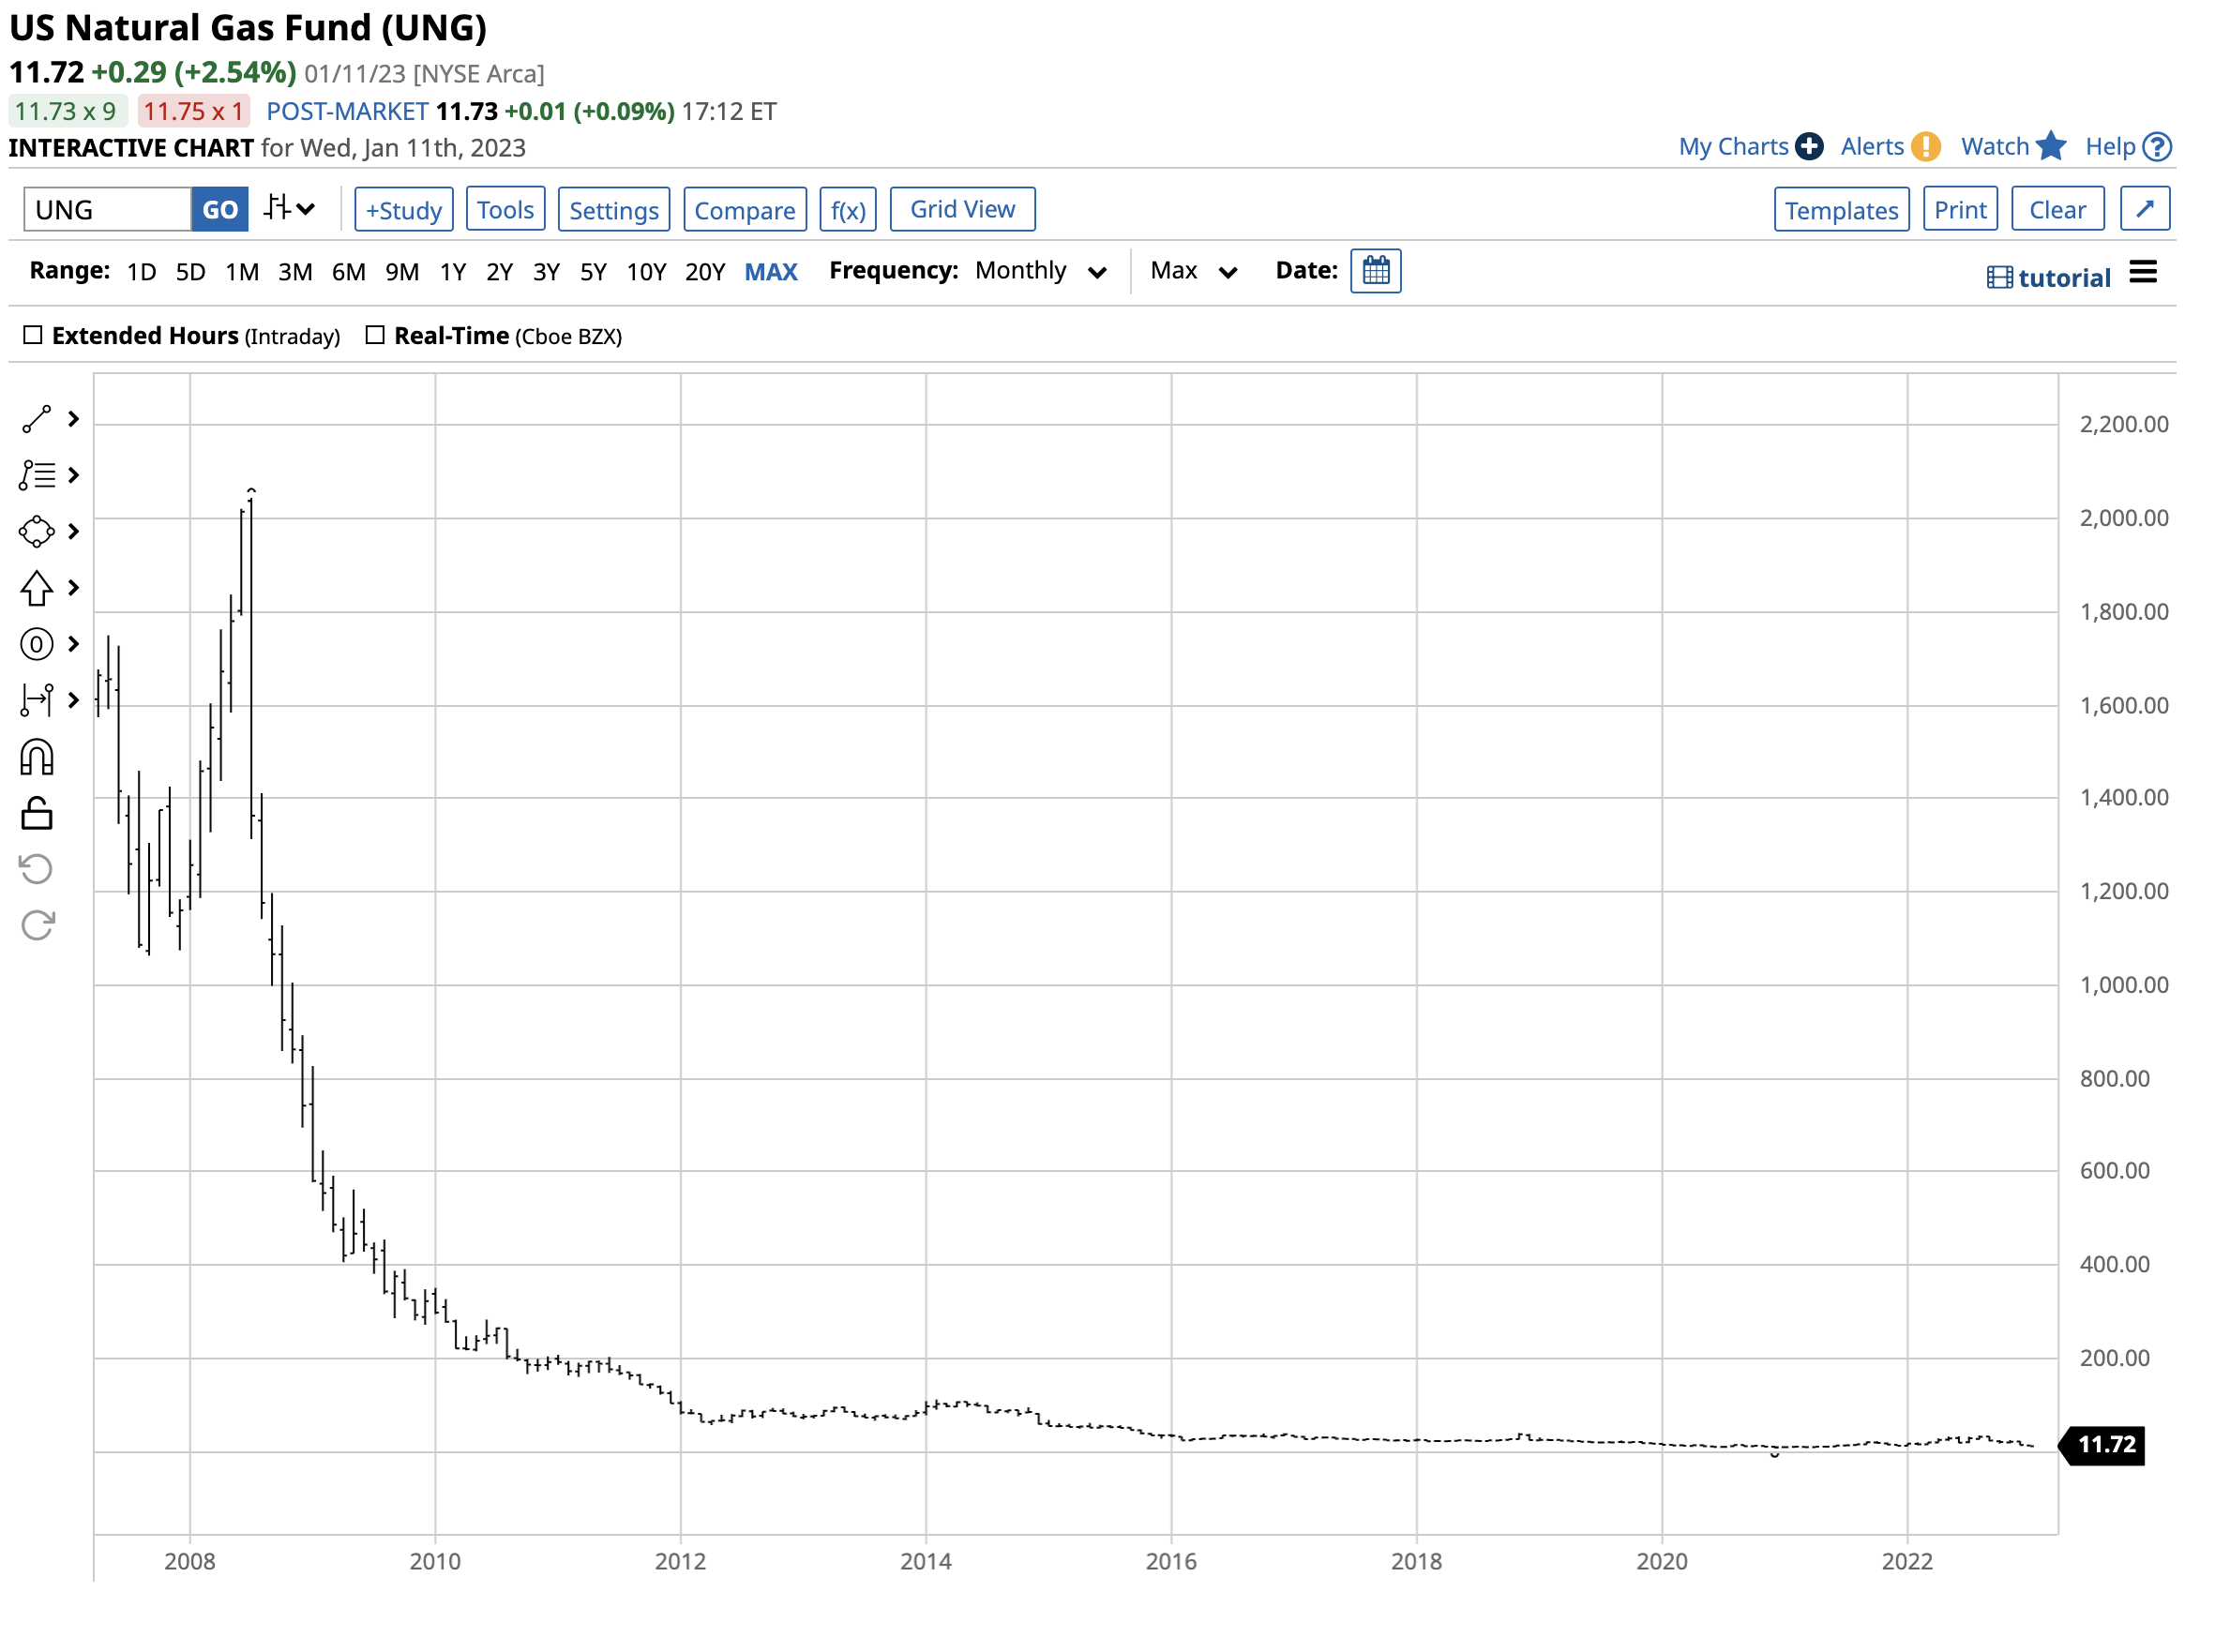
Long-Term Chart of the UNG ETF Product (Barchart)
The long-term chart shows UNG’s decay over long periods because of the rolling from one month to the next and the inherent seasonality in natural gas prices.
Natural gas is a commodity to trade. For those looking to turbocharge the price action, the ProShares Ultra Bloomberg Natural Gas product (BOIL) and its bearish counterpart (KOLD) provide short-term double leverage on the up and downside.
At $11.86 per share, BOIL had $546.247 million in assets, trades an average of over 16.758 million shares daily, and charges a 0.95% management fee.
At $36.48 per share, KOL had $188.415 million in assets under management. KOLD trades an average of nearly 8.885 million shares daily and charges the same 0.95% management fee.
Natural gas is the most volatile energy commodity, and careful attention to risk-reward dynamics is necessary for success. In the current environment, prices under $4 per MMBtu are likely in the buy zone.
Be the first to comment