

JHVEPhoto/iStock Editorial via Getty Images
By The Valuentum Team
There is not much to dislike about Medtronic plc (NYSE:MDT), though recently, its business has faced headwinds in the form of supply chain hurdles, lackluster operational execution, and inflationary pressures. Medtronic remains a stellar free cash flow generator with a strong Dividend Cushion ratio, though the outlook for the company’s margin expansion opportunities has been diminished somewhat. Share buybacks compete for capital against Medtronic’s dividend obligations, and potential M&A activity needs to be monitored (tuck-in acquisitions are a core part of Medtronic’s business model). Medtronic has a sizable total debt load, though the firm generally keeps ample liquidity on hand. Shares are trading at the low end of our fair value estimate range and boast a healthy 2.7% dividend yield supported by a 1.8 Dividend Cushion ratio. We’re fans of the company.
Dividend Cushion Cash Flow Bridge (Image Source: Valuentum)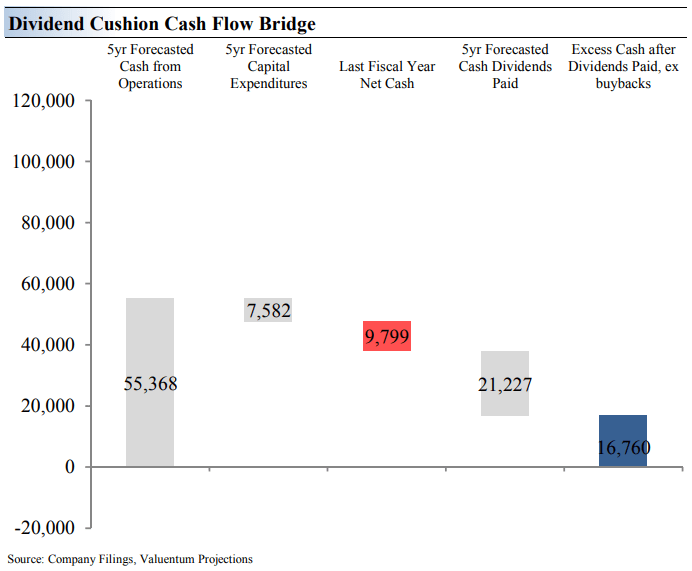
The Dividend Cushion Cash Flow Bridge, shown in the image above, illustrates the components of the Dividend Cushion ratio and highlights in detail the many drivers behind it. Medtronic’s Dividend Cushion Cash Flow Bridge reveals that the sum of the company’s 5-year expected cumulative free cash flow generation, as measured by cash flow from operations less all capital spending, plus its net cash/debt position on the balance sheet, as of the last fiscal year, is greater than the sum of the next 5 years of expected cash dividends paid. Because the Dividend Cushion ratio is forward-looking and captures the trajectory of the company’s free cash flow generation and dividend growth, it reveals whether there will be a cash surplus or a cash shortfall at the end of the 5-year period, taking into consideration the leverage on the balance sheet, a key source of risk.
On a fundamental basis, we believe companies that have a strong net cash position on the balance sheet and are generating a significant amount of free cash flow are better able to pay and grow their dividend over time. Firms that are buried under a mountain of debt and do not sufficiently cover their dividend with free cash flow are more at risk of a dividend cut or a suspension of growth, all else equal, in our opinion. Generally speaking, the greater the ‘blue bar’ to the right is in the positive, the more durable a company’s dividend, and the greater the ‘blue bar’ to the right is in the negative, the less durable a company’s dividend. In Medtronic’s case, we view its dividend as quite healthy.
Medtronic’s Key Investment Considerations
Image Source: Valuentum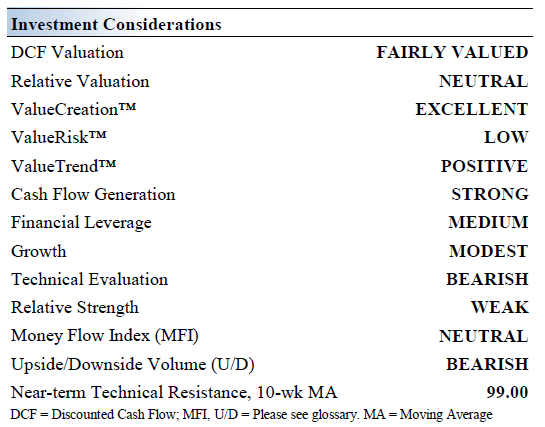
Medtronic is a global leader in medical technology. The company functions in four operating segments: Cardiac & Vascular, Minimally Invasive Therapies, Restorative Therapies, and Diabetes. Medtronic bought Covidien in a tax-inversion deal in 2015 through a cash-and-stock deal worth ~$42.9 billion. Medtronic traces its roots back to the late 1940s.
Medtronic aims to grow its organic revenues by 5%+ per year and its adjusted EPS by 8%+ per year. Tuck-in acquisitions are a core part of its business model. Medtronic has over 49,000 patents in its portfolio and the firm continues to innovate.
Medtronic’s long-term free cash flow conversion target is 80%+ and historically, the company has been a stellar free cash flow generator in almost any operating environment. The firm’s product pipeline remains robust, with an eye towards its ‘Deep Brain Stimulation System,’ pacemaker, atrial fibrillation, and pelvic health offerings.
Medtronic sees emerging markets underpinning its long-term growth trajectory, which represented a relatively small but growing portion of its fiscal 2022 revenues. The firm identified three things to work on to improve its performance in these markets: channel optimization, functional capabilities, and localization.
Recently, Medtronic has been facing headwinds in the form of supply chain hurdles, lackluster operational execution, and inflationary pressures. These factors, among others, weigh negatively on its ability to significantly expand its margins going forward.
Though we like Medtronic’s business model and competitive advantages, its most recently reported quarter in May left much to be desired as “global supply chain and COVID-19 controls in China” weighed on performance. Looking ahead, the company expects fiscal year 2023 organic revenue in the 4%-5% range and non-GAAP EPS in the range of $5.53-$5.65 per share, the latter weighed down by negative foreign currency translation.
Medtronic’s Economic Profit Analysis
The best measure of a company’s ability to create value for shareholders is expressed by comparing its return on invested capital with its weighted average cost of capital. The gap or difference between ROIC and WACC is called the firm’s economic profit spread. Medtronic’s 3-year historical return on invested capital (without goodwill) is 22%, which is above the estimate of its cost of capital of 9.4%.
As such, we assign the firm a ValueCreation rating of EXCELLENT. In the chart below, we show the probable path of ROIC in the years ahead based on the estimated volatility of key drivers behind the measure. The solid grey line reflects the most likely outcome, in our opinion, and represents the scenario that results in our fair value estimate. Medtronic is a strong economic-value generator.
Image Source: Valuentum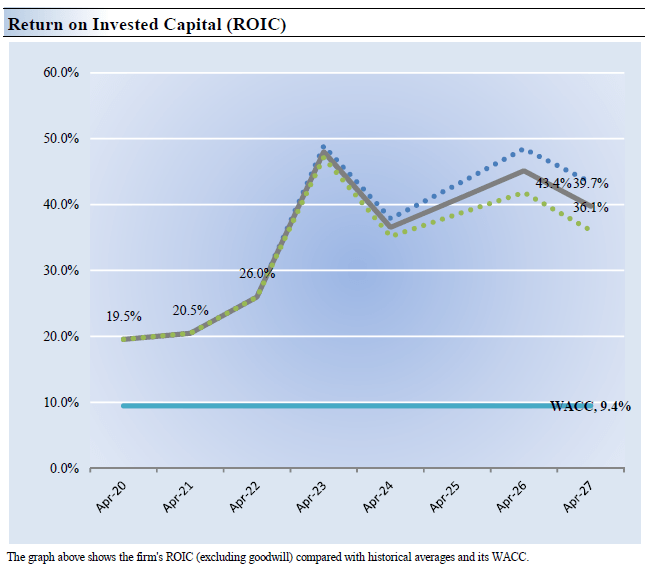
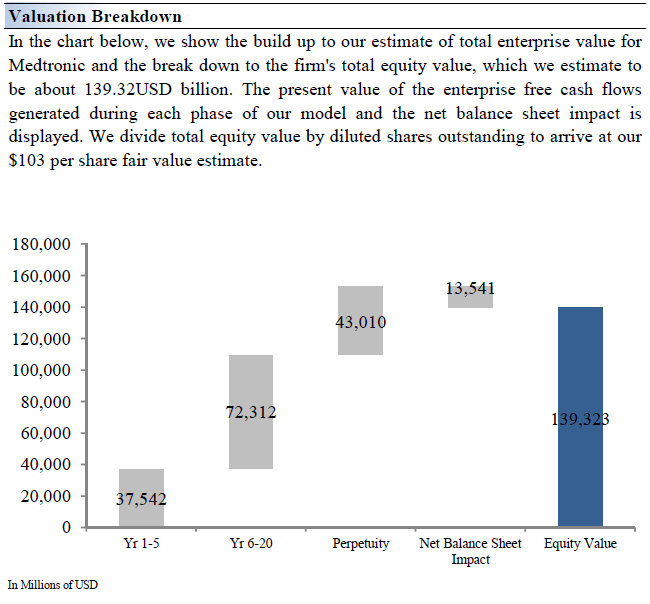
Medtronic’s Cash Flow Valuation Analysis
Image Source: Valuentum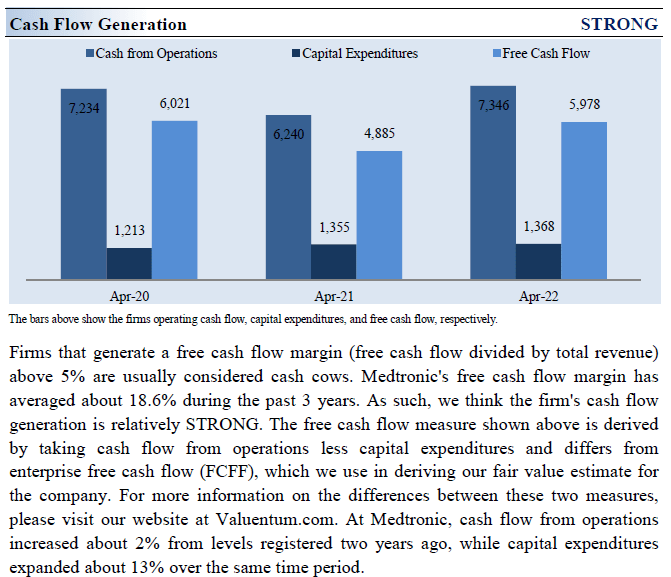
We think Medtronic is worth $103 per share with a fair value range of $82.00 – $124.00. The margin of safety around our fair value estimate is driven by the firm’s LOW ValueRisk rating, which is derived from an evaluation of the historical volatility of key valuation drivers and a future assessment of them.
Our near-term operating forecasts, including revenue and earnings, do not differ much from consensus estimates or management guidance. Our model reflects a compound annual revenue growth rate of 4.2% during the next five years, a pace that is higher than the firm’s 3-year historical compound annual growth rate of 1.2%.
Our valuation model reflects a 5-year projected average operating margin of 32.2%, which is above Medtronic’s trailing 3-year average. Beyond year 5, we assume free cash flow will grow at an annual rate of 1.5% for the next 15 years and 3% in perpetuity. For Medtronic, we use a 9.4% weighted average cost of capital to discount future free cash flows.
Image Source: Valuentum Image Source: Valuentum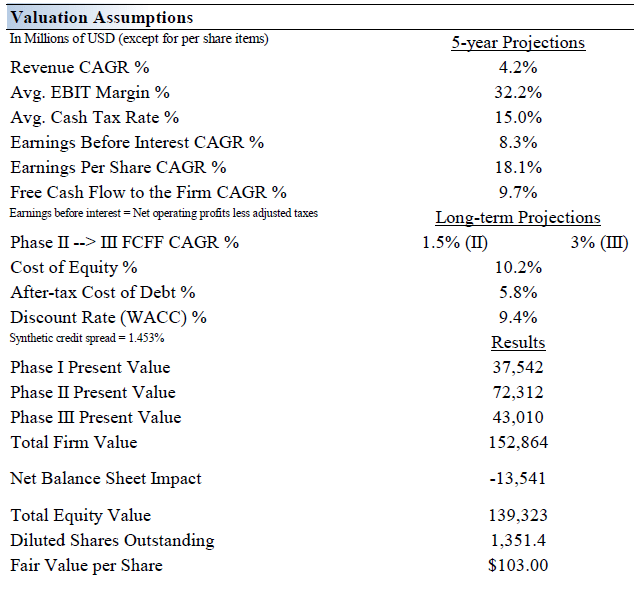
Medtronic’s Margin of Safety Analysis
Image Source: Valuentum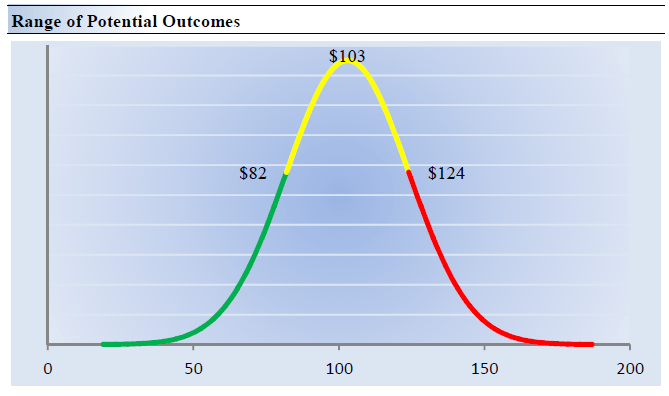
Our discounted cash flow process values each company on the basis of the present value of all future free cash flows. Although we estimate Medtronic’s fair value at about $103 per share, every company has a range of probable fair values that’s created by the uncertainty of key valuation drivers (like future revenue or earnings, for example). After all, if the future were known with certainty, we wouldn’t see much volatility in the markets as stocks would trade precisely at their known fair values.
This is an important way to view the markets as an iterative function of future expectations. As future expectations change, so should the company’s value and its stock price. Stock prices are not a function of fixed historical data but rather act in such a way to capture future expectations within the enterprise valuation construct. This is a key part of our book Value Trap: Theory of Universal Valuation.
Our ValueRisk rating sets the margin of safety or the fair value range we assign to each stock. In the graph above, we show this probable range of fair values for Medtronic. We think the firm is attractive below $82 per share (the green line), but quite expensive above $124 per share (the red line). The prices that fall along the yellow line, which includes our fair value estimate, represent a reasonable valuation for the firm, in our opinion.
Concluding Thoughts
Medtronic aims to generate a long-term free cash flow conversion rate of 80% (or greater). In fiscal 2022, the company met its long-term free cash flow conversion goal. Medtronic is a Dividend Aristocrat that has grown its payout over the past 40+ consecutive years, and we forecast that it will continue to grow its payout at a brisk clip going forward.
Medtronic aims to grow its organic revenues by 5%+ per year and its adjusted EPS by 8%+ per year over the long haul, supported by the launch of new offerings and by growing its presence in emerging markets. Medtronic’s Dividend Cushion ratio is rock-solid and it aims to grow its dividend alongside its earnings. We think shares are looking cheap, and investors get paid a nice dividend yield to wait for price-to-estimated fair value convergence.
This article or report and any links within are for information purposes only and should not be considered a solicitation to buy or sell any security. Valuentum is not responsible for any errors or omissions or for results obtained from the use of this article and accepts no liability for how readers may choose to utilize the content. Assumptions, opinions, and estimates are based on our judgment as of the date of the article and are subject to change without notice.
Be the first to comment