

SomeMeans/iStock via Getty Images
Introduction
While used every day by millions around the world, the power tools market remains quite cyclical in nature as consumer sentiment and spending shifts with the economy. This is especially true in 2022 as two major players fall to valuations not seen since the first half of the 2010s. The two players are Stanley Black & Decker (NYSE:SWK), who accounts for over one-third of industry sales and Makita Corp (OTC:MKTAY), who accounts for over 10% of total industry sales.
Some investors may look at recent financial performance of these companies and wonder why they have fallen even as revenues are at record highs. The answer may seem simple to some, but the consequences are staggering in terms of the investing implications. The main points are as follows:
-
Investors fear a slowdown in discretionary revenues due to inflation, increased interest rates, and general economic slowdown. However, the data suggests that these issues are temporary and there are catalysts for growth beyond general market malaise. Therefore, the shares will rebound quickly.
-
There is also data that suggests that the tools market is facing weakness (whether from competition or reduced demand), further exacerbating the steep reduction in valuation, and this issue may be permanent. Therefore, watch for further weakness and reduced upside.
In this article, I will address these concerns and determine whether the crash has historical precedent and will remain prolonged, or whether investors should take advantage of the weakness.
Historical Performance Patterns
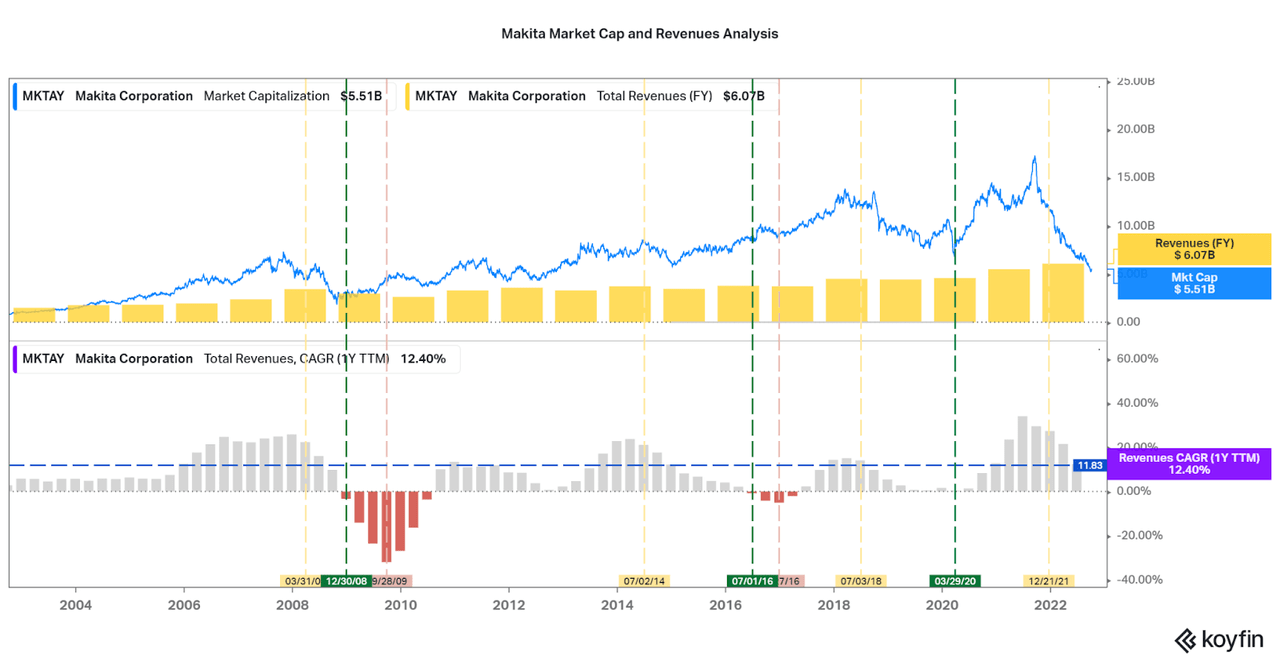
The easiest way to determine whether the current sell-off is justified is by looking at the historical patterns that exist with both companies. Straight off the bat, we can look at the GFC in 08 as a “worse case” scenario. Both SWK and Makita are down over 60% from highs seen only just recently in 2021. This reflects the same downside that both companies experienced between 07-09. The problem is that revenues fail to reflect the same distress as was seen in the last recession. This may lead to an opportunity.
In the charts below, we can see that over the past 20 years both companies have experienced similar trading patterns in terms of market cap compared to revenue growth. Initial downside is indicated by the first slowdown in revenue growth, highlighted with the yellow vertical lines. These positions were always great exit points, even if down from the peak slightly. Then, an interesting pattern that is shown is that the best buy points are the first quarters of negative growth, highlighted with dashed green vertical lines. This contrasts with the peak negative growth quarters that were usually occurring after shares rebounded partially. To summarize my simple trigger points (shown by the 0% and blue horizontal lines, respectively):
-
Buy when revenues first become negative on a TTM basis.
-
Sell when revenue growth shows the first signs of letting up on a TTM basis (can still be positive).
While historical patterns may not continue in the future, investors can use this data to their advantage. As Jim Simons of Renaissance put it, “past performance is the best indicator of future success.” The inferences are also quite simple, as it is a tried-and-true strategy to invest during fearful times of underperformance.
As we can see, the timing is quite similar between the two companies (cyclical market > company issues), so leveraging which company reports first may be an accurate way of finding the absolute low. Given the cyclicality of these two companies, I believe performing this strategy alongside recurring investments will pan out well for investors. Similarly, can also see the sell trigger point is also fickle because growth has hardly slowed down for SWK over the past few quarters so investors should look to both companies to determine whether signals are present.
Koyfin Koyfin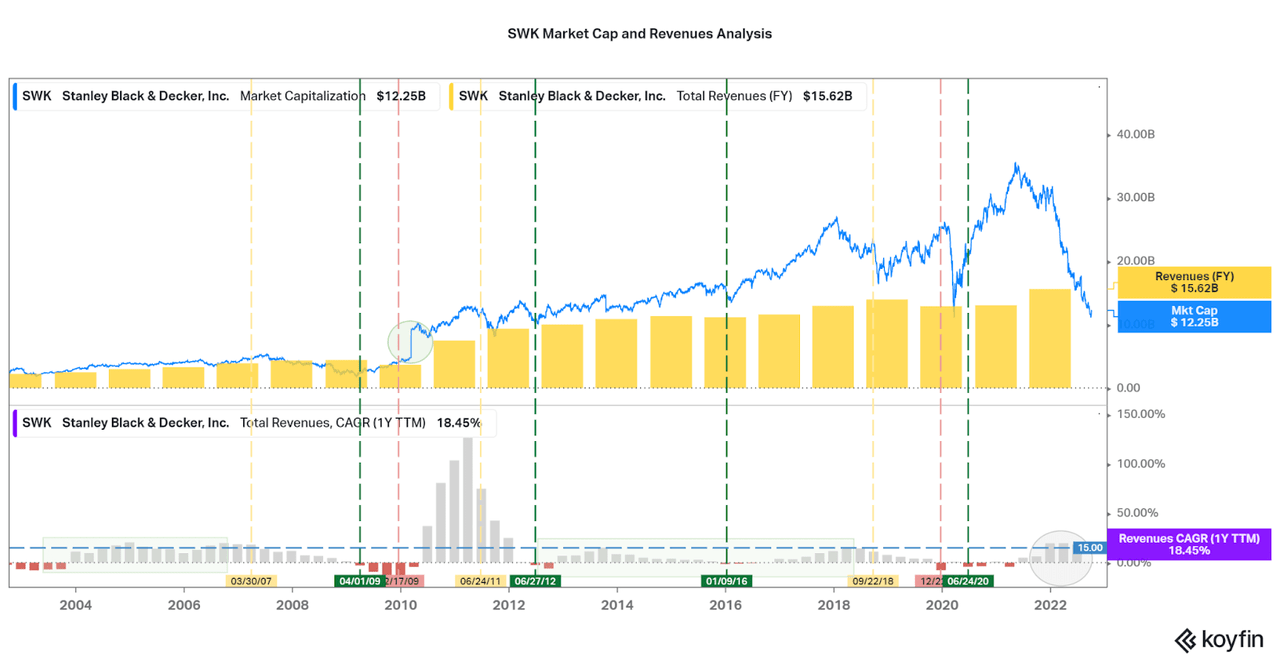
Additional Considerations
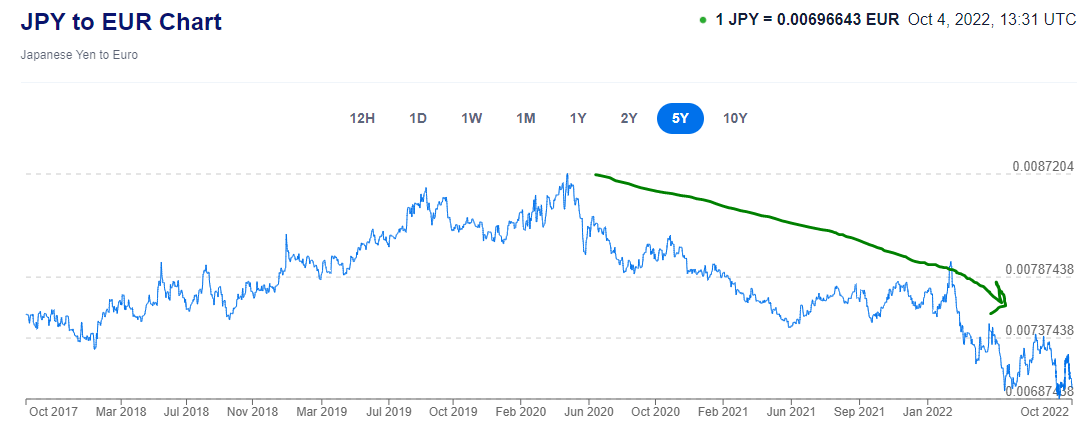
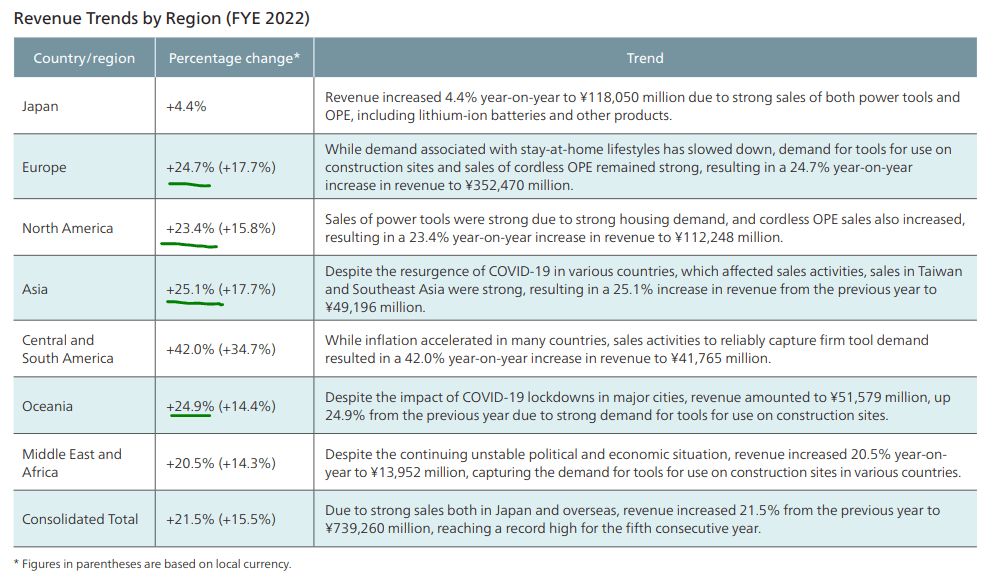
However, there are some more qualitative and quantitative factors that I should discuss that may cause SWK and Makita to diverge financially. Starting with Makita, we must address the importance of foreign exchange benefits and increased financial stability. Approximately 84% of revenues are from outside of Japan, and this means that the current weak cycle in the Yen will allow for up to 30% increases in revenues compared to historical currency levels. This includes almost 47% of revenues being from Europe, and I included a chart of the current exchange rates below.
As Japan seems hesitant to increase rates, especially to US levels, this favorable exchange rate pattern should continue and allow Makita to outperform for some time. We can already see the last four quarters reflected up to 15-20% forex benefits (see table below), and the exchange benefits only occurred the last six months or so. This may prevent growth from going negative, and so it may be best to begin adding some shares on a recurring basis now if this is the case (as my buy indicator is negative TTM revenues).
Makita Integrated Report Xe Makita Integrated Report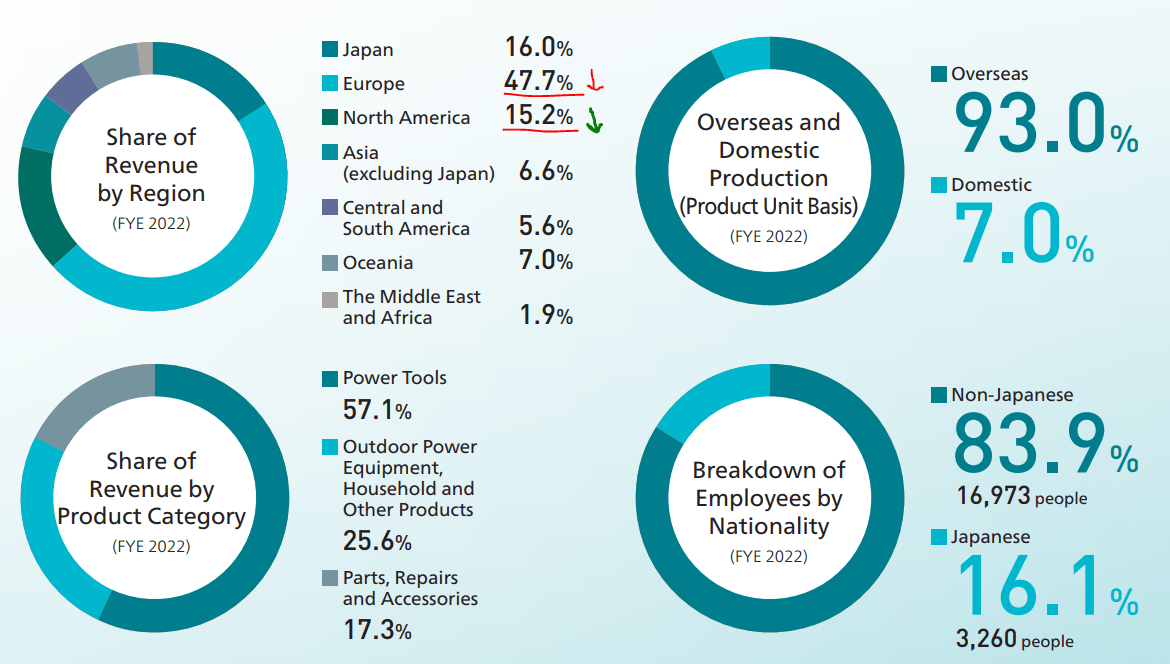
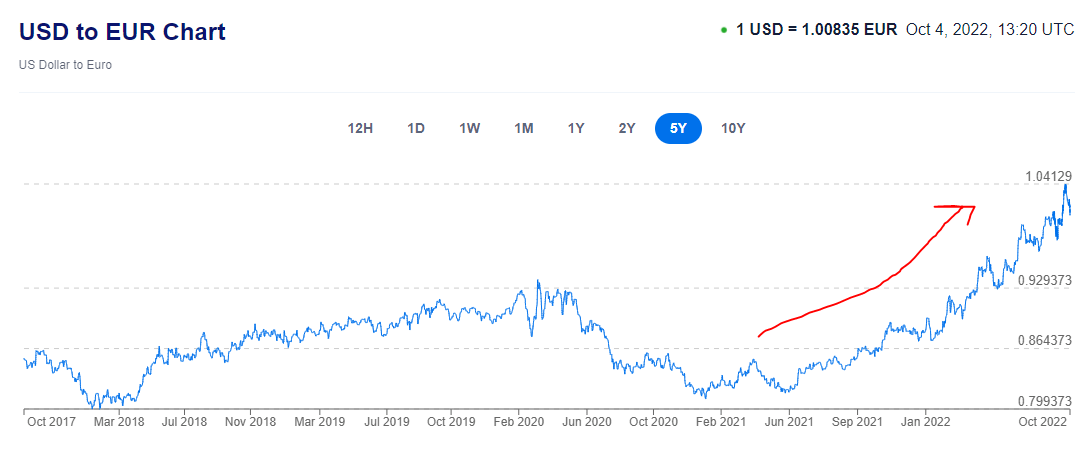
On the other hand, Stanley Black & Decker has the opposite effect to contend with: strong USD and significant foreign revenues. In fact, approximately 40% of revenues are foreign, and this will impair earnings until the pattern switches. The direct impacts are hard to determine, but the current 15% YoY increase in USD:Euro is not a good sign. As long as currency traders flock to the high-rate US treasuries, SWK will be weak compared to Makita.
Other considerations in terms of secular emerging market growth, dire circumstances in Europe, etc. can all be made, but are hard to quantify and may balance out in the long-term. The power tools market cycle will reflect these issues, and good times will come sure enough.
SWK Investor Presentation Xe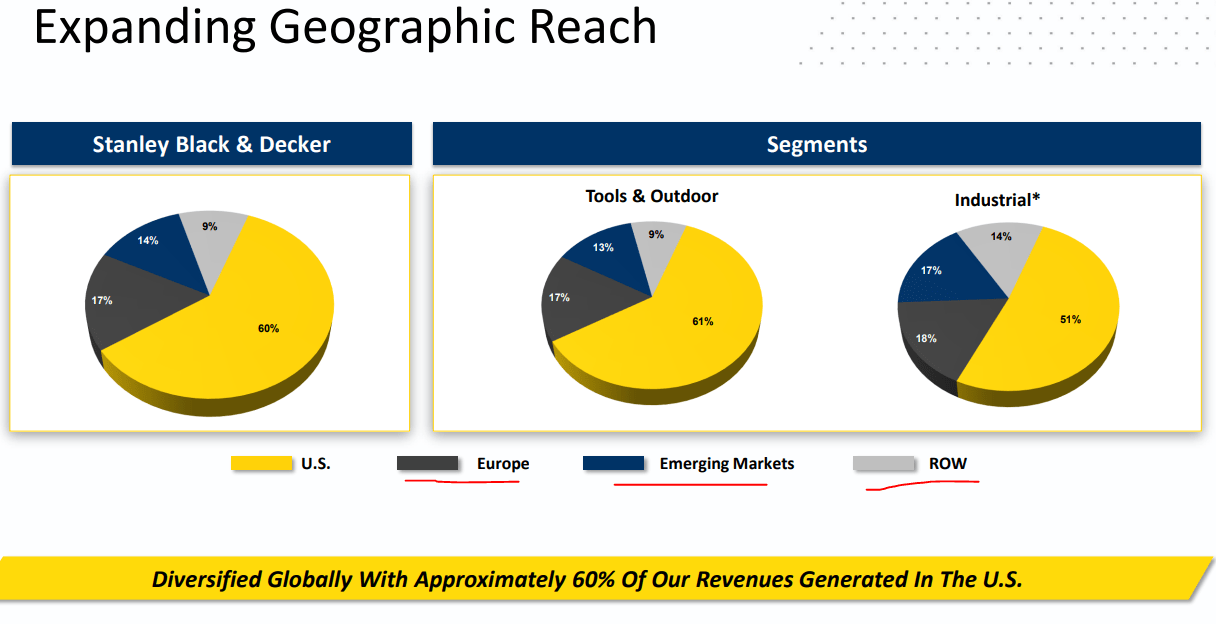
Makita and SWK Comparison Exposes Industry Weakness
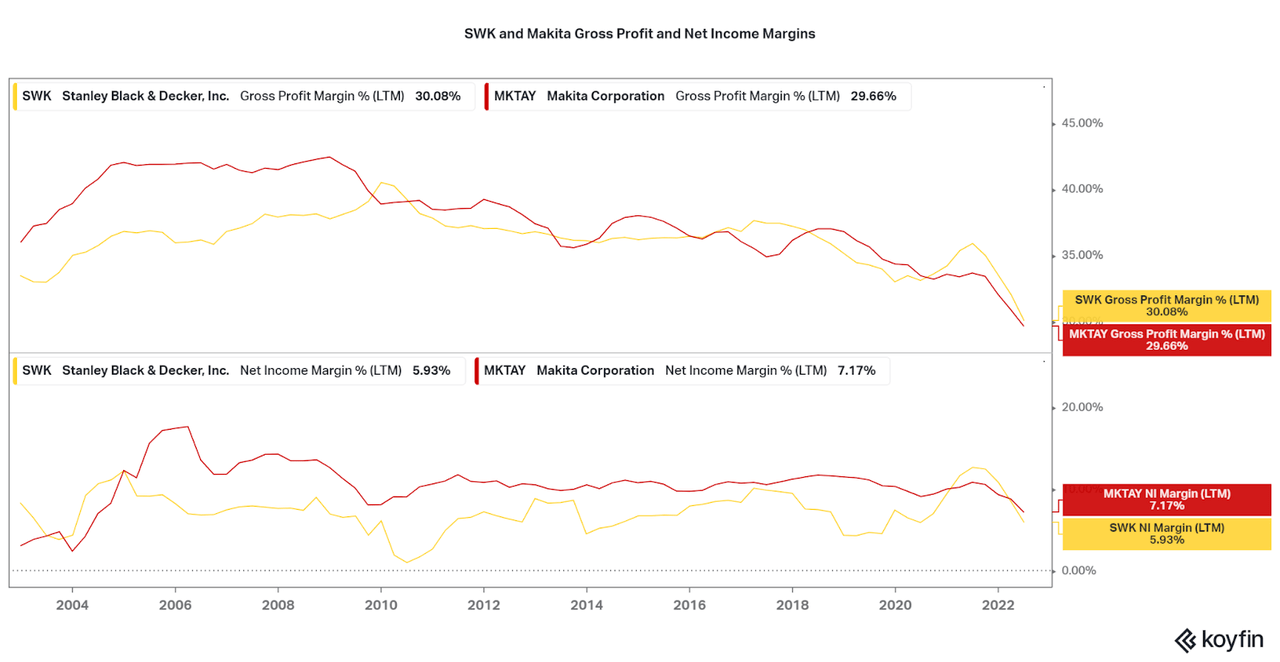
One last consideration to make is that both SWK and Makita are seeing a negative profit margin trend, both gross profits and net income, over the past two decades. This reflects a secular shift in the entire market, and it is unknown whether the trend will continue. Considering how competitors such as Harbor Freight and Amazon (AMZN) easily allow consumers to choose cheaper options, I expect margins to continue to be damaged. A focus on innovation, quality, and longevity – all expensive tasks – are perhaps the only saving grace for these companies, but high product prices may hurt growth further.
A search of “power tools” on Amazon shows both Makita and SWK prominently. (DeWalt is also a SWK brand) (Amazon) Koyfin
Another way to look at the change in profitability is through valuation. Rather than the revenue to market cap patterns I addressed above, valuation is less accurate in predicting low and high points in the stock price. While the current Price to Sales for both companies is certainly far lower than any point in the past 10-12 years, increased leverage has caused EV to EBITDA data to seem expensive.
This can also be seen to an extent with Price to Earnings, as both companies are barely reaching levels seen since 2012 or 2009, indicating further downside is still entirely possible. This means a few more quarters of the downward trend will continue to present an opportunity, but investors must watch the long-term trend in overall profitability (not cyclical swings).
Koyfin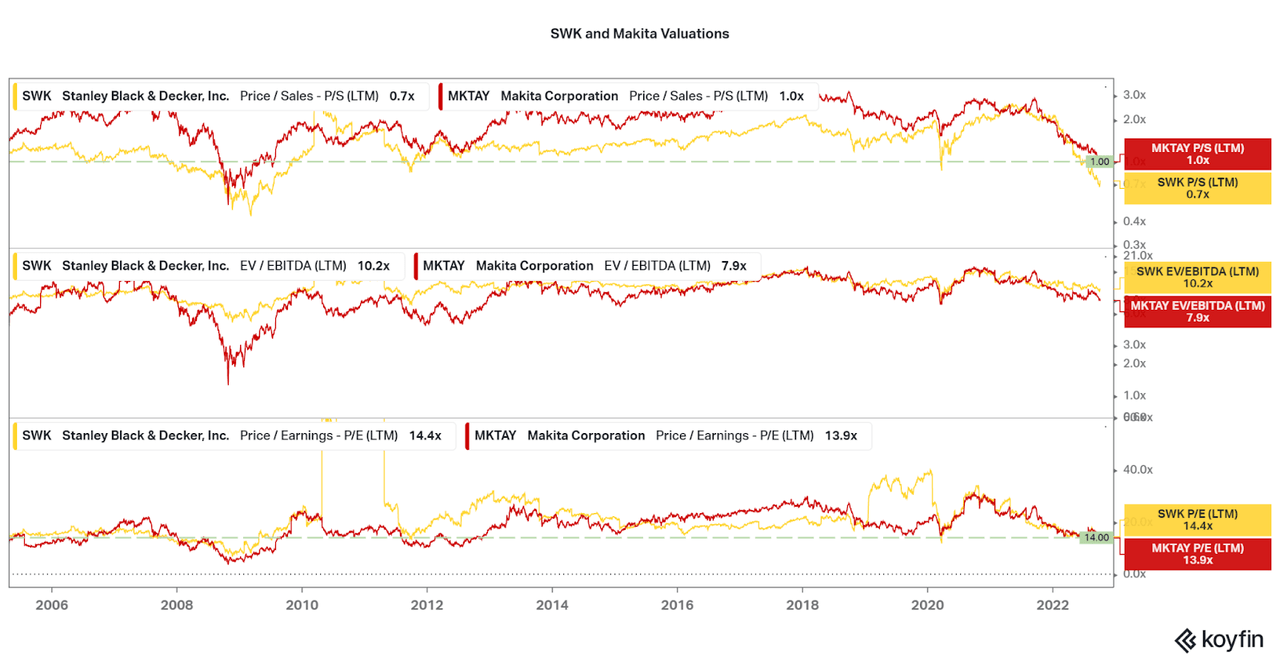
Conclusion
Thankfully, both companies are mature enough to reflect significant periods of positive earnings to reflect on, and I believe they both are some of the better choices in the market to attempt to time the cycle. Investors should wait for the first period of either negative, or extremely low growth (certainly less than 3-5%), then begin investing for the uptrend. For Makita, this has already occurred so perhaps by next earnings for SWK.
Just be careful since the valuations reflect secular profitability weakness and the strong downward momentum may persist. We must also be reticent on the differences in the current market compared to times such as the post-Dot-Com Bubble and financial crisis of the 2000s, as inflation is now more aligned with periods in the 70s. If so, the 20-year data can be thrown out, and further downside is completely possible.
Multipl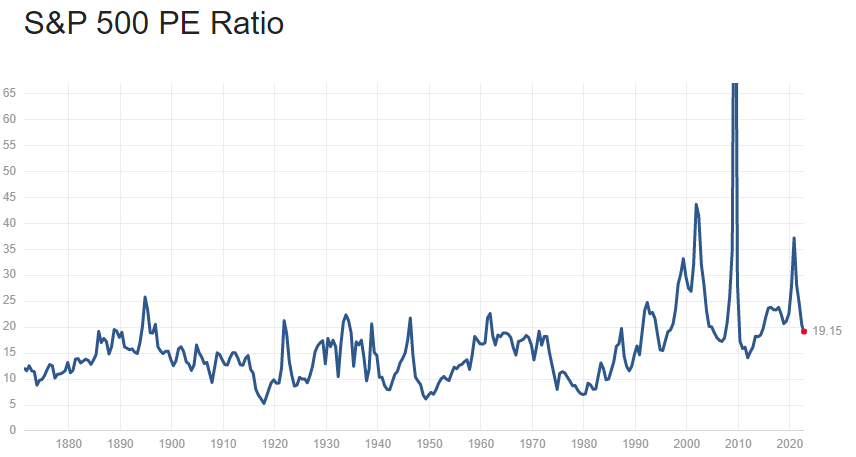
Of course, much weight falls on the backs of central banks, and their moves in the coming years will determine whether the high valuations of the 90s to 2020s will survive, or historical ranges will return. Economist Jeremy Siegel believes that current inflation issues will soon be fixed (and P/E ratios will remain high). He also believes that the 70s were a great macroeconomic policy failure (that also had many other unique factors).
As such, I believe that investors should not worry too much about stagflation like the 70s. The fact is that long-term minded investors who invest on a recurring basis, but considering the cycles as I discuss, will have a strong risk-adjusted return moving forward with both Makita and SWK. I do hope my analysis helps to supplement your own research on these two companies.
Thanks for reading.
Be the first to comment