

DAX, FTSE 100 Talking Points:
- DAX 40 clings to key technical levels
- FTSE 100 strengthens despite elevated geopolitical risks
- Risk-on sentiment returns, equities rise
Visit the DailyFX Educational Center to discover the impact of politics on global markets
DAX, FTSE Hold Firm Above Critical Support
The return of a risk-on sentiment allowed the equity market to rebound throughout last week, allowing both EU and UK stocks to regain a certain degree of confidence. Although a negative correlation (moves in opposite directions) generally exists between stocks and interest rates, investors have priced in a series of rate hikes across major central banks, allowing the DAX and FTSE to find stability above key psychological levels.
DAX (Germany 40) Technical Analysis:
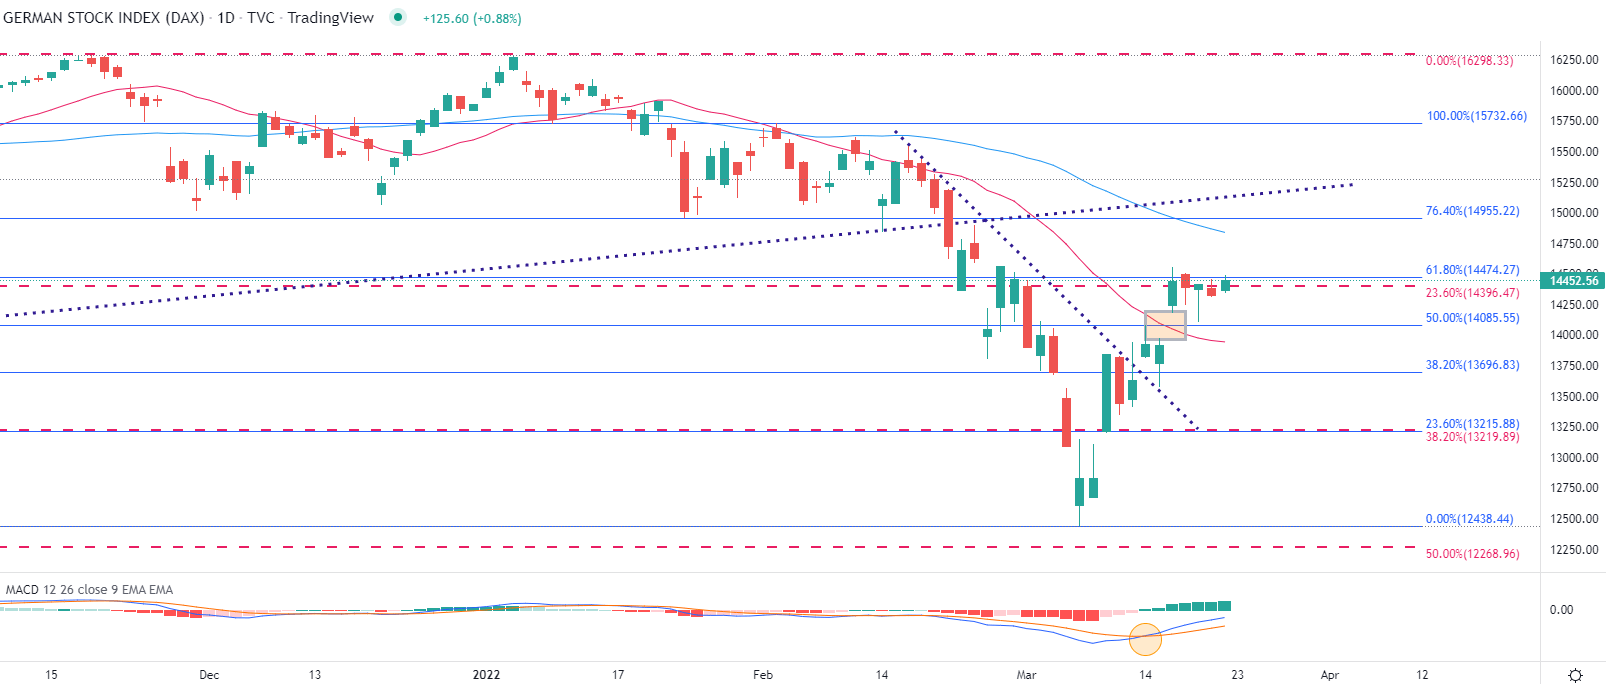
The DAX (German 40) is currently trading in a narrow range as key Fibonacci levels continue to hold both bulls and bears at bay. After gapping higher on 15 March, price action has managed to stabilize above the key psychological level of 14,000, pushing prices to the next zone of resistance at around 14,474, the 61.8% Fibonacci level of the Feb – March move.
With prices now trading above the 10-day MA (moving average), the MACD (moving average convergence/divergence) is edging higher in an effort to reclaim the zero-line.
DAX (Germany 40) Daily Chart
Chart prepared by Tammy Da Costa using TradingView
DAX40 Levels to Watch:
Support Levels:
S1: 13,942 (20-day MA)
S2: 13,696 (38.2% Fib of Feb – March move)
S2:13,219 (38.2% Fib 2020 – 2021 move )
Resistance Levels:
R1: 14,838 (50-day MA)
R2: 14,955 (76.4% Fib of Feb – March move)
R3: 15,500 (Psychological Level)
FTSE 100 Technical Analysis:
The FTSE (UK 100) has risen steadily after breaking above prior resistance turned support at the key psychological level of 7,200. Although price action remains vulnerable to both interest rates and other fundamental factors, UK stocks remain eager to recover recent losses, allowing the index to clear the 100-day MA (moving average) while the MACD (moving average convergence/divergence) continues to climb towards the zero line.
If a crossover of the zero-line occurs, a retest of the 7,500 mark and a retest of the February high (7,687) may be probable.
FTSE 100 Daily Chart

Chart prepared by Tammy Da Costa using TradingView
Support Levels:
S1: 7,363 (100-day MA)
S2: 7,268 (20-day MA)
S2: 7,000 (Psychological level)
Resistance Levels:
R1: 7,300 (Psychological level)
R2: 7,434 (50-day MA)
R3: 7,687 (Feb 2022 high)
— Written by Tammy Da Costa, Analyst for DailyFX.com
Contact and follow Tammy on Twitter: @Tams707
Be the first to comment