

Tim Boyle/Getty Images News
UGI Corporation (NYSE:UGI) is expanding its focus on biofuels and sustainable energy solutions. Domestically, its subsidiary AmeriGas Propane recently entered into an agreement with Global Clean Energy Holdings to purchase and distribute renewable LPG. Roger Perreault, President and CEO of UGI Corporation, stated that “this long-term agreement demonstrates continued progress on our environmental, social and governance (ESG) initiatives and strategy to invest in renewables.” The company is focused on investing in innovative, low-carbon, sustainable energy solutions.
UGI Corporation has also recently, under its UGI International subsidiary, created a joint venture with SHV Energy to advance the production and use of renewable dimethyl ether (rDME). The joint venture is intended to gain market acceptance and accelerate the use of rDME as a renewable solution for the liquefied petroleum gas (“LPG”) industry. As the company operates across 17 European countries, this could create significant opportunities for the renewable resource industry.
While current news stories, good or bad, can sway our opinion about investing in a company, it’s good to analyze the fundamentals of the company and to see where it’s been in the past and in which direction it’s heading.
This article will focus on the long-term fundamentals of the company, which tend to give us a better picture of the company as a viable investment. I also analyze the value of the company versus the price and help you to determine if UGI is currently trading at a bargain price. I provide various situations which help estimate the company’s future returns. In closing, I will tell you my personal opinion about whether I’m interested in taking a position in this company and why.
Snapshot of the Company
A fast way for me to get an overall understanding of the condition of the business is to use the BTMA Stock Analyzer’s company rating score. It shows a score of around 77/100. Therefore, UGI Corporation is considered to be a good company to invest in, since 70 is the lowest good company score. UGI has high scores for 10 Year Price Per Share, ROE, Earnings per share, Ability to Recover from a Market Crash or Downturn, and Gross Margin Percent. It has low scores for ROIC, and PEG Ratio. A low PEG Ratio score indicates that the company may not be experiencing high growth consistently over the past 5 years. In summary, these findings show us that UGI seems to have above-average fundamentals since the majority of categories produce good scores.
Before jumping to conclusions, we’ll have to look closer into individual categories to see what’s going on.
BTMA Stock Analyzer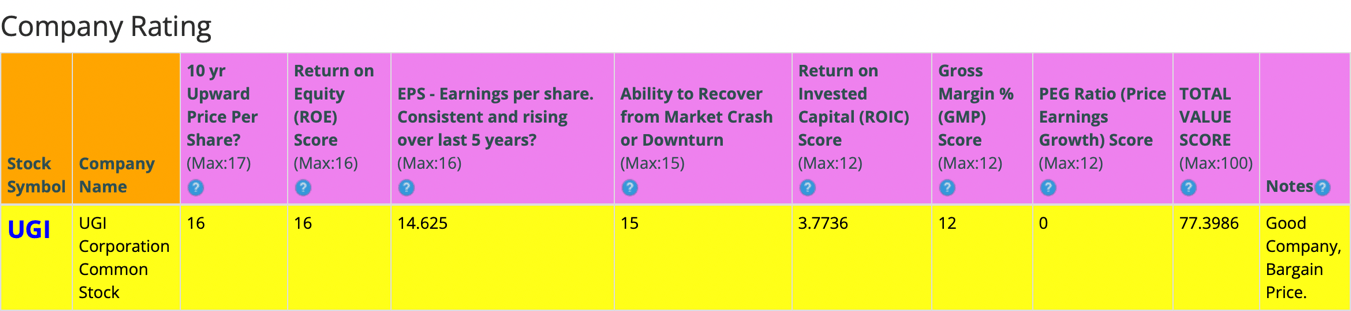
Fundamentals
Let’s examine the price per share history first. In the chart below, we can see that price per share has been mostly consistent at increasing over the last 10 years, with the exception of 2016 and 2021 where share price has declined. Overall, share price average has grown by about 84.8% over the past 10 years or a Compound Annual Growth Rate of 7.06%. This return is subpar when considering that the S&P 500 return during this same period was 12.91% per year.
BTMA Stock Analyzer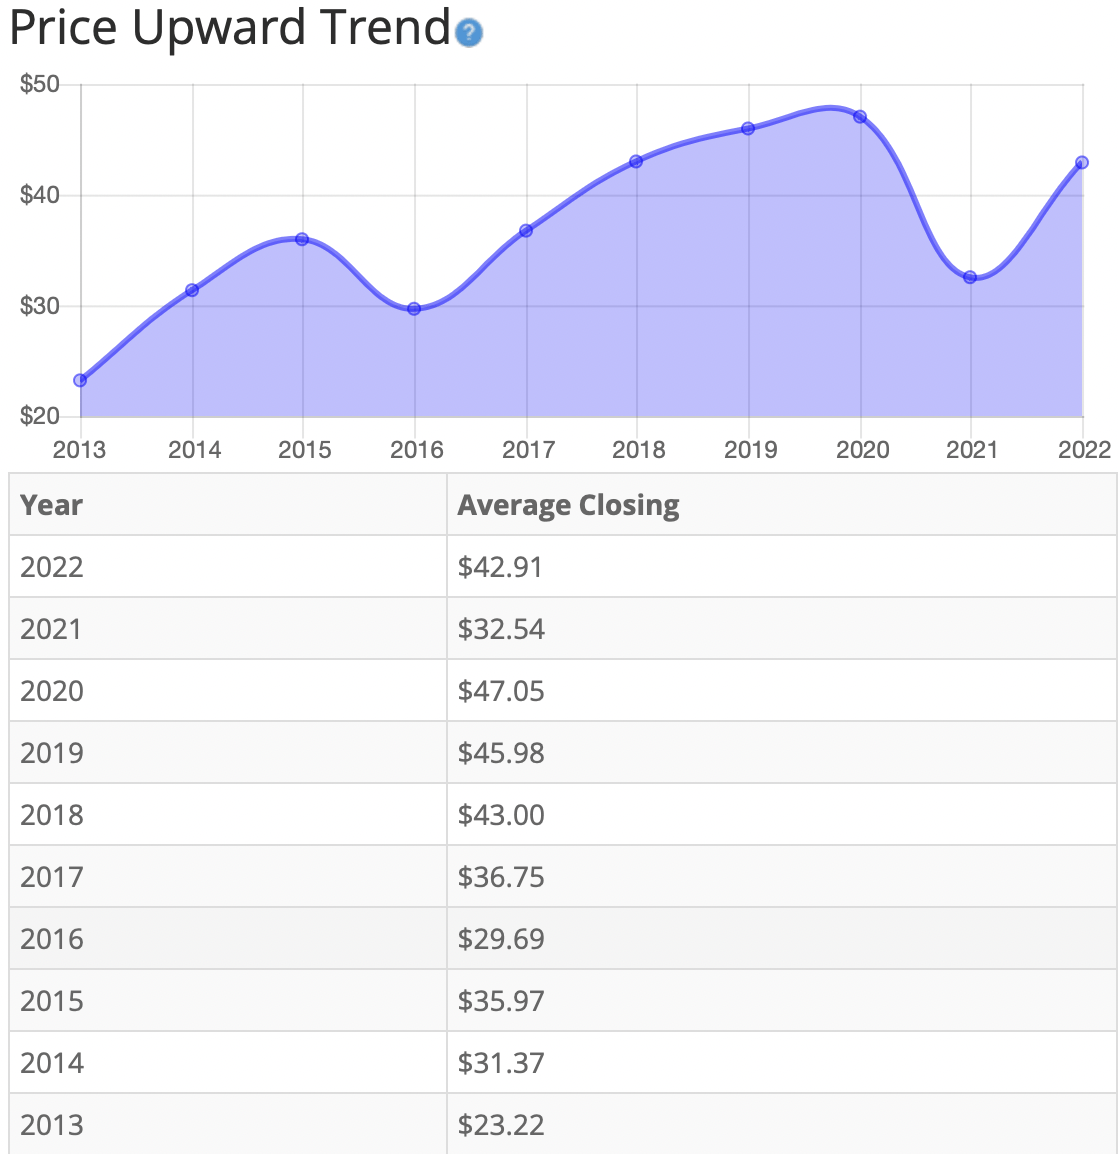
Earnings
Looking closer at earnings history, we see that earnings have grown at a mostly steady pace between 2012 and 2018. Then earnings fell significantly in 2019. Since then earnings have accelerated strongly.
Consistent earnings make it easier to accurately estimate the future growth and value of the company. So, in this regard, UGI is a fairly good candidate of a stock to accurately estimate future growth or current value.
BTMA Stock Analyzer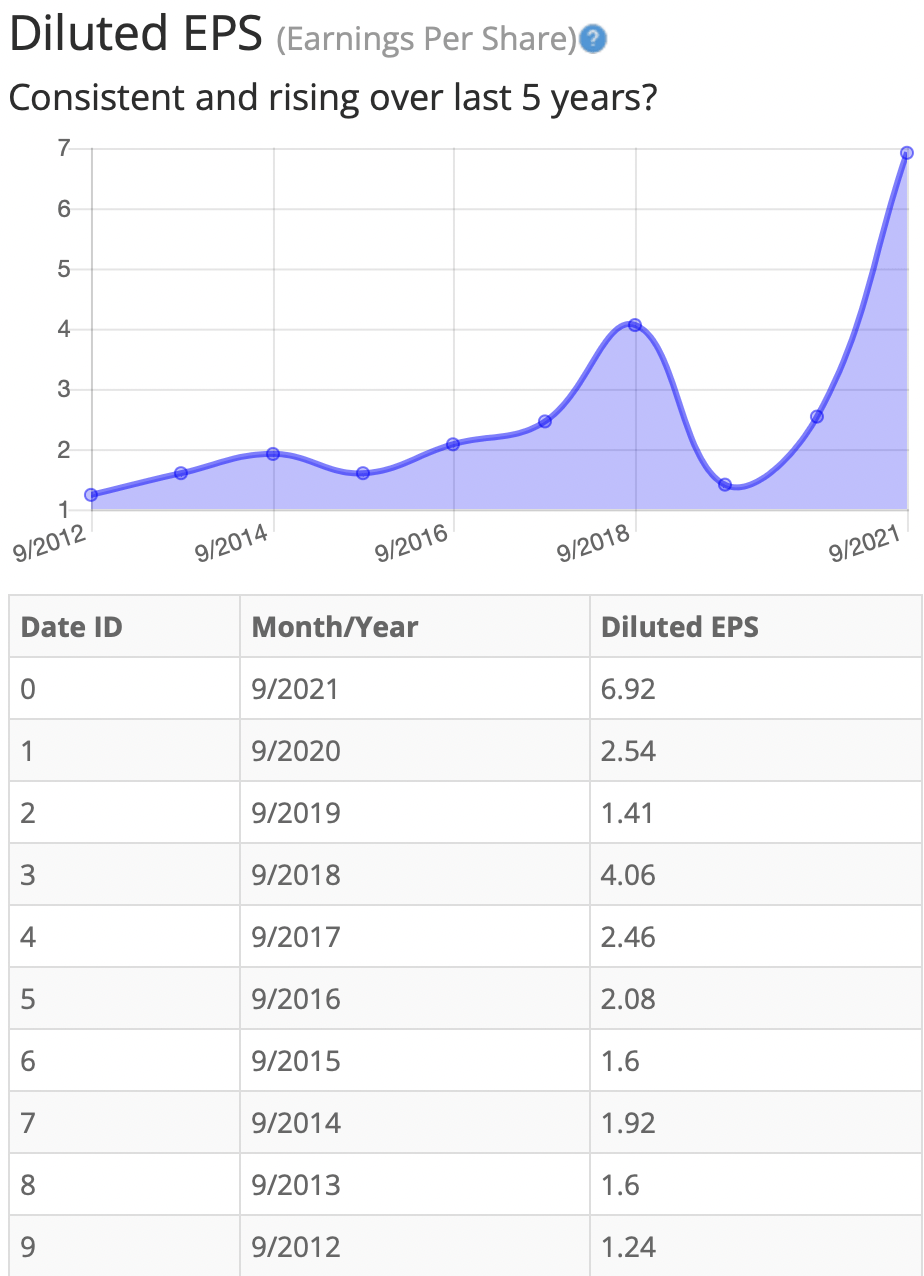
Since earnings and price per share don’t always give the whole picture, it’s good to look at other factors like the gross margins, return on equity, and return on invested capital.
Return on Equity
The return on equity has been fairly consistent in increasing from 2017-2021, apart from 2019. Five-year average ROE is good at around 17%. For return on equity (ROE), I look for a 5-year average of 16% or more. So, UGI meets my requirements.
BTMA Stock Analyzer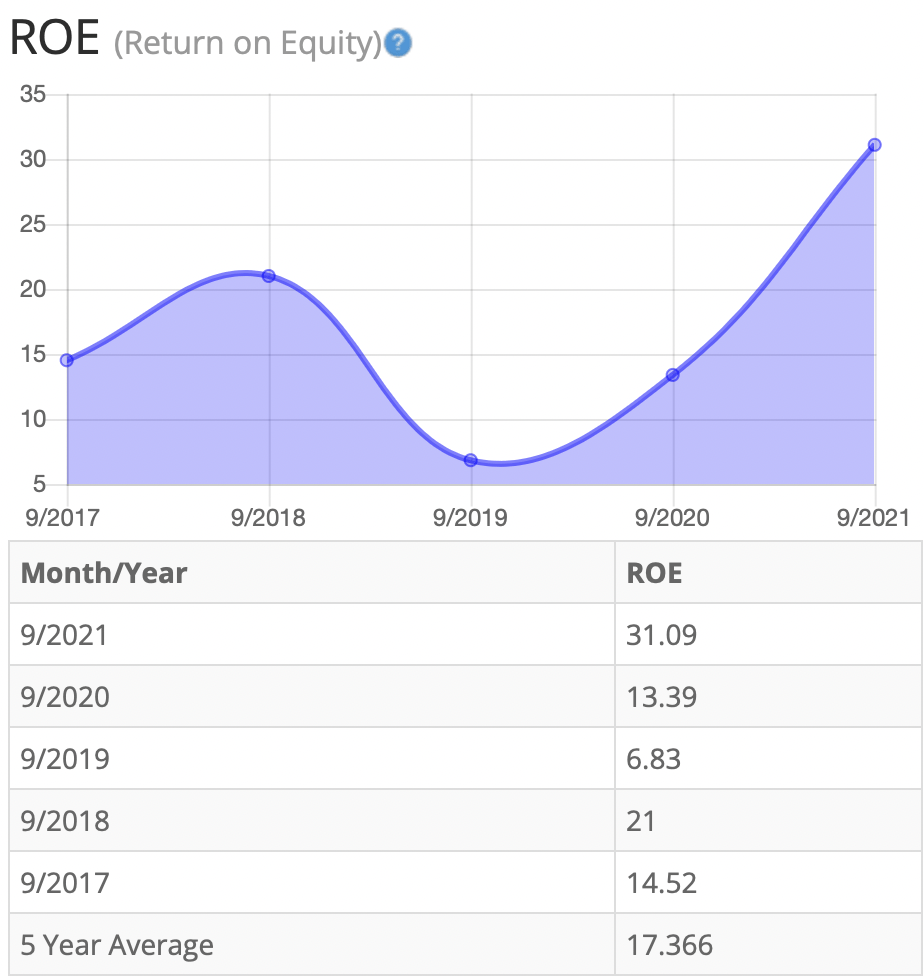
Let’s compare the ROE of this company to its industry. The average ROE of 16 Utility companies is 8.44%.
Therefore, UGI Corporation’s 5-year average of 17.4% and current ROE of 31.1% are well above average.
Return on Invested Capital
The return on invested capital has been mostly stable and consistent when disregarding 2019 as an outlier. Five-year average ROIC is low at around 9%. For return on invested capital (ROIC), I also look for a 5-year average of 16% or more. So, UGI does not pass this test. The silver lining is that ROIC is trending upward.
BTMA Stock Analyzer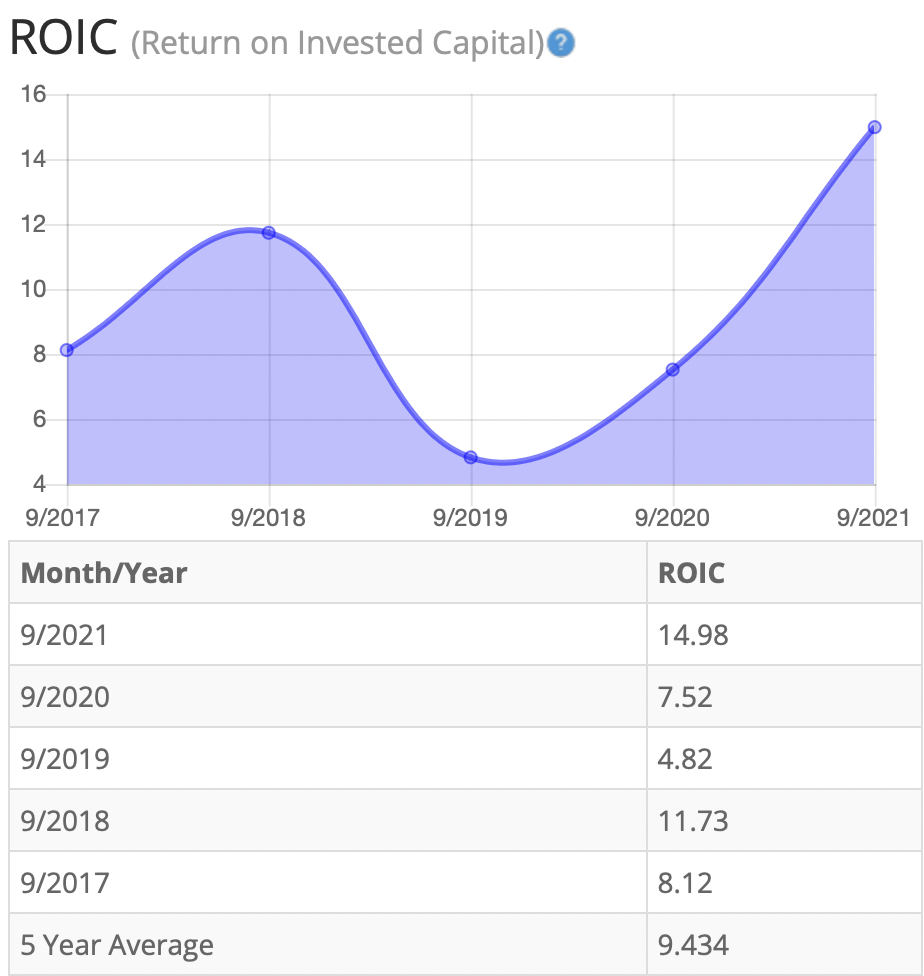
Gross Margin Percent
The gross margin percent (GMP) seems volatile according to the chart below, however, the company has kept good margins during the past five years. Five-year GMP is good at around 52%. I typically look for companies with gross margin percent consistently above 30%. So, UGI has proven that it has the ability to maintain acceptable margins over a long period.
BTMA Stock Analyzer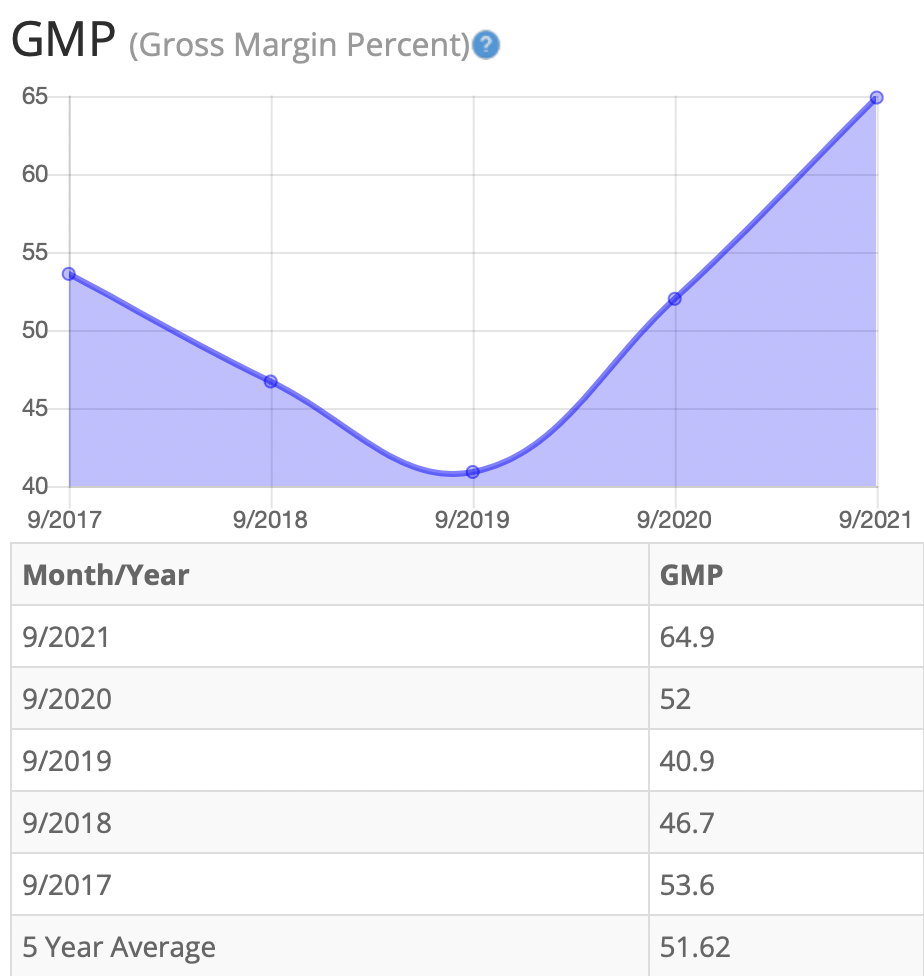
Looking at other fundamentals involving the balance sheet, we can see that the debt-to-equity is greater than 1. This is a concerning indicator, as it tells us that the company owes more than it owns.
UGI’s Current Ratio of 1.33 is satisfactory, indicating that it has an adequate ability to use its assets to pay its short-term debt.
According to the balance sheet, the company appears to be in so-so financial health. In the long term, the company could improve its debt-to-equity. In the short term, the company’s financial situation seems fine.
The Price-Earnings Ratio of 7.7 indicates that UGI might be selling at a low price when comparing UGI’s PE Ratio to a long-term market average PE Ratio of 15. The 10-year and 5-year average PE Ratio of UGI has typically been between 17.2 and 15.2, so this indicates that UGI could be currently trading at a low price when comparing to UGI’s average historical PE Ratio range.
UGI currently pays a dividend of 3.90%.
BTMA Stock Analyzer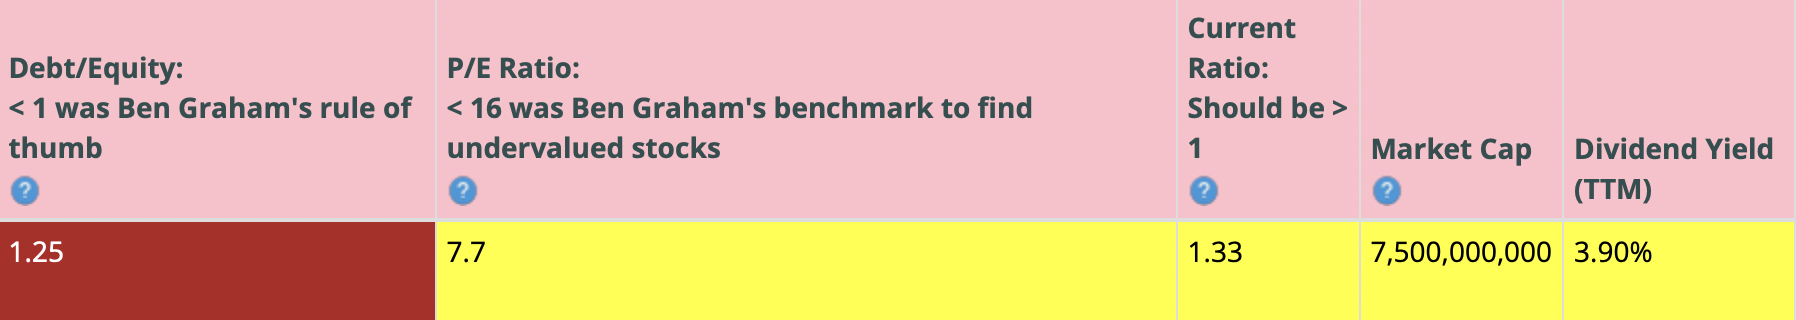
The Story Behind The Dividend
Morningstar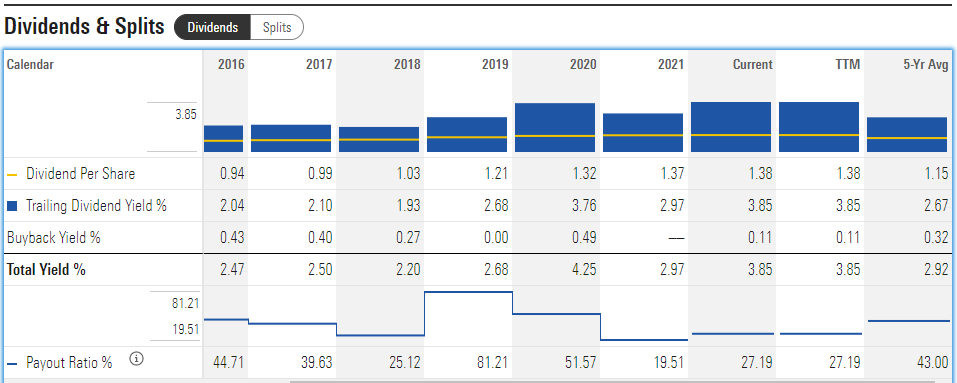
In regards to dividend history, I’m first interested in knowing if the payout ratio is sustainable. At this time, it’s around 27%, which means that there is still room to grow the dividend, but the payout ratio should be watched since, at times, it has approached high levels around 80%. Also notice that UGI has a regular history of buying back shares, which contributes to higher payout ratios.
If we look only at the dividend yield, we see a range of 1.93% to 3.85%. This stock pays out a decent dividend. Dividend payouts have increased somewhat consistently over the 5 year period, therefore this stock may be desirable for some dividend investors.
Although UGI participates in share buybacks, sometimes buybacks don’t make sense, as according to Warren Buffett: “There is only one combination of facts that makes it advisable for a company to repurchase its shares: First, the company has available funds — cash plus sensible borrowing capacity — beyond the near-term needs of the business and, second, finds its stock selling in the market below its intrinsic value, conservatively calculated.”
In the example of UGI, the company appears to have ample short-term funds, as indicated by its current ratio. However, its long-term funds are lacking as shown by its debt-to-equity ratio. Now let’s consider its borrowing capacity.
According to March 2021 10-Q, UGI “expects to have sufficient liquidity including cash on hand and available borrowing capacity to continue to support long-term commitments and ongoing operations despite uncertainties associated with the outbreak and continued spread of COVID-19.”
UGI’s “total available liquidity balance, comprising cash and cash equivalents and available borrowing capacity on our revolving credit facilities, totaled approximately $1.6 billion and $1.5 billion at March 31, 2021 and September 30, 2020, respectively.”
Now to see if the buyback timing made sense. From the view of a share price chart over the past 5 years, the worst times to do share buybacks would have been when UGI was climbing highest in stock price. This would have been around 2018. If we look at the dividend chart above, we can see that during 2018, was a time when UGI was buying back less shares, which would make sense.
Then UGI hit a low price in 2021 and this was when the company should have been buying back the most shares. However, it may not have been in a position to do so, because commodity prices were at a low during this time, as well.
Therefore, it seems like UGI has bought back stocks on a regular yearly basis, and is not purposely planning share buybacks with a strategic plan.
If I were currently interested in buying UGI now for the dividend, I would be trying to buy when the dividend yield was highest relative to its past. From the chart below, we can see that the dividend yield is near a somewhat high point relative to the past 10 years. Therefore, it’s a fairly good time to buy now if my priority is a better-than-average return through dividends.
GuruFocus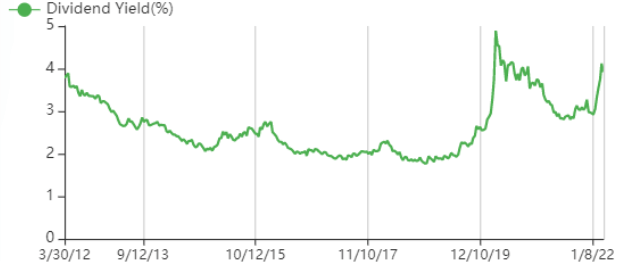
Overall, the dividend situation with UGI is better than average. On the positive side, the stock pays a substantial and consistent dividend, and has been doing so since about 1885! The dividend payouts and yields have been increasing over the years. In fact, “UGI increases its dividend by 4% per year and management remains committed to continue to grow the dividend at this rate.”
The payout ratio is low enough to leave more room for growing the dividend. Finally, the dividend yield is near a somewhat high level when compared with the past 10 years.
On the negative side, share buybacks haven’t been completed at an opportune time to return the most value to shareholders.
This analysis wouldn’t be complete without considering the value of the company vs. share price.
Value Vs. Price
For valuation purposes, I will be using a diluted EPS ttm of 5.02. I’ve used various past averages of growth rates and PE Ratios to calculate different scenarios of valuation ranges from low to average values. The valuations compare growth rates of EPS, Book Value, and Total Equity.
In the table below, you can see the different scenarios, and in the chart, you will see vertical valuation lines that correspond to the table valuation ranges. The dots on the lines represent the current stock price. If the dot is towards the bottom of the valuation range, this would indicate that the stock is undervalued. If the dot is near the top of the valuation line, this would show an overvalued stock.
BTMA Wealth Builders Club BTMA Wealth Builders Club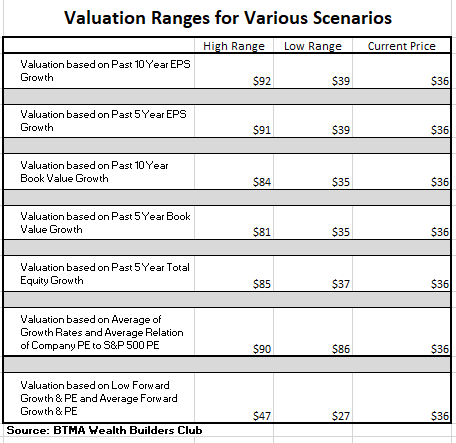
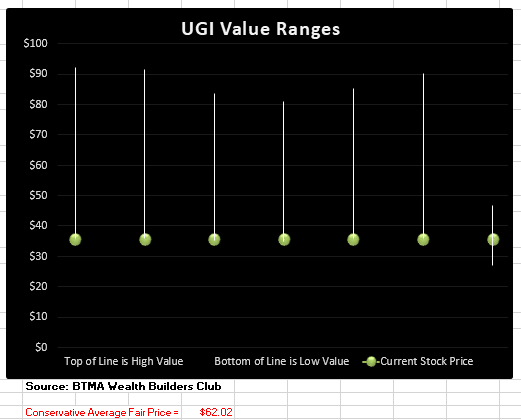
According to this valuation analysis, UGI is undervalued.
- If UGI continues with a growth average similar to its past 10 years earnings growth, then the stock is undervalued at this time.
- If UGI continues with a growth average similar to its past 5 years earnings growth, then the stock is undervalued at this time.
- If UGI continues with a growth average similar to its past 10 years book value growth, then the stock is undervalued at this time.
- If UGI continues with a growth average similar to its past 5 years book value growth, then the stock is undervalued at this time.
- If UGI continues with a growth average similar to its past 5 years total equity growth, then the stock is undervalued at this time.
- According to UGI’s typical PE ratio in relation to the S&P 500’s PE Ratio, UGI is undervalued.
- If UGI continues with a growth average as forecasted by analysts, then the stock is about fairly priced.
This analysis shows an average valuation of around $62 per share versus its current price of about $36, this would indicate that UGI Corp. is undervalued.
Forward-Looking Conclusion
According to the facts, UGI Corp. could use some improvement to its financial health as indicated by its debt-to-equity ratio. But its current ratio shows that it does have enough cash to cover current liabilities.
Other fundamentals are solid, including ROE, Gross Margins, and EPS. ROIC is on an uptrend but has room to improve.
The dividend situation is better than average as the company pays a moderate dividend with a yield that has been steadily increasing over the past 5 years.
Lastly, this analysis shows that the stock is undervalued.
Now, let’s see how UGI performed in the long-term vs. the standard market benchmark (S&P 500). From the chart below, we can see that UGI, as a commodity-type company, surprisingly outperformed the market during most of this period. Also, in 2008, UGI maintained its price, while the market tanked during the economic crisis. Things were different in March 2020, when the COVID crisis hit. UGI fell harder than the market, but this was due to the special circumstances of COVID’s isolation period. This scenario caused fuel prices and revenues to plummet, since businesses and vehicles/equipment that usually require natural gas and fuel, were running at a fraction of full capacity.
As a whole, this chart is insightful and tells me that UGI could be a decent investment providing a surprising amount of growth if bought at a cheap enough price. Plus, during most normal recessions, this stock should maintain its price better than the overall market.
Morningstar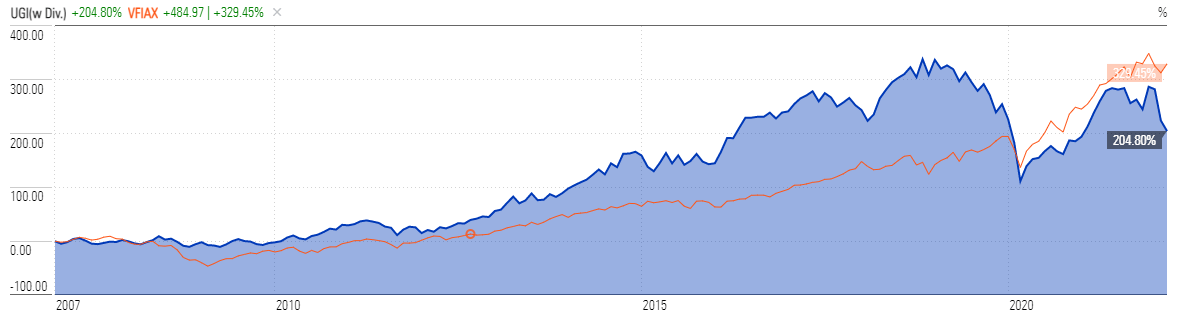
Predicted Growth
“Over the next five years, the analysts that follow this company are expecting it to grow earnings at an average annual rate of 6.95%. This year, analysts are forecasting an earnings decrease of -4.4% over last year. Analysts expect earnings growth next year of 15.9% over this year’s forecasted earnings” (Source: Forecast Earnings Growth)
If you invest today, with analysts’ forecasts, you might expect about 6.95% growth per year. Plus, we’ll add the current 3.9% forward dividend. This brings the annual return to around 10.85%.
Here is an alternative scenario based on UGI’s past earnings growth. During the past 10 and 5-year periods, the average EPS growth rate was about 15.0% and 15.3%, respectively. Plus, the average 5-year dividend yield was about 2.67%. So, we’re at a total return of 17.67 % to 17.97%.
But when considering cash flow growth over the past 10 and 5 years, the growth has been 7.9% and 19.4%, respectively. Plus, the average 5-year dividend yield would give us a total return of 10.57% to 22.07%. Therefore, when averaging all of these return scenarios, our estimated annual return could likely be around 15%-16%.
If considering actual past results of UGI Corp., which includes affected share prices, and long-term dividend yields, the story is a bit different. Here are the actual 10 and 5-year return results.
______________
10 Year Return Results if Invested in UGI:
Initial Investment Date: 3/26/2012
End Date: 3/26/2022
Cost per Share: $18.30
End Date Price: $35.80
Total Dividends Received: $10.20
Total Return: 151.27%
Compound Annualized Growth Rate: 10%
_______________
5 Year Return Results if Invested in UGI:
Initial Investment Date: 3/26/2017
End Date: 3/26/2022
Cost per Share: $49.97
End Date Price: $35.80
Total Dividends Received: $6.02
Total Return: -16.29%
Compound Annualized Growth Rate: -3%
_________________
From these scenarios, we have produced results from -3% to 10%. But keep in mind that both of these return results include the worst declining period for the stock, which was caused by COVID.
If we look at the actual return results for 5 years and 10 years, prior to the COVID period. Here are the results.
10 Year Return Results if Invested in UGI prior to COVID:
Initial Investment Date: 1/1/2010
End Date: 1/1/2020
Cost per Share: $16.12
End Date Price: $45.16
Total Dividends Received: $8.67
Total Return: 233.79%
Compound Annualized Growth Rate: 13%
_______________
5 Year Return Results if Invested in UGI:
Initial Investment Date: 1/1/2015
End Date: 1/1/2020
Cost per Share: $37.98
End Date Price: $45.16
Total Dividends Received: $5.07
Total Return: 32.25%
Compound Annualized Growth Rate: 6%
From these scenarios, we have produced results from 6% to 13%. I feel that if you’re a long-term patient investor and believer in UGI, and its existing services (transporting and marketing of propane, natural gas, electric, and related services), you could expect UGI to provide you with around at least 6% annual return in worse years. I know this doesn’t seem like much, but investors are usually buying utility-type companies as a low-risk investment, not for growth.
The upside with UGI is that during typical recessions or inflationary periods, this stock has the ability to better maintain its price, especially when the overall market is falling. That benefit can provide peace of mind.
Plus, UGI has historically proven that it has generated returns that have outpaced the S&P 500, if you’re able to buy the stock at a significant bargain price (as seen in the UGI vs. S&P 500 chart above.)
For me, the choice is certain. I would take an objective look at this company and realize that UGI Corp. is a chance to own a stable and low-risk company with good long-term fundamentals in an essential industry.
I know that UGI, isn’t going to be an exciting investment with profound growth, but it seems like a safe choice during current times of an overpriced stock market, high inflation, and energy shortages because of the Russian-Ukrainian War.
Plus, it doesn’t hurt that the stock is greatly undervalued and selling near its 52-week low.
Be the first to comment