


Phynart Studio/E+ via Getty Images
Investment Thesis
United States Steel Corporation (NYSE:X) has transformed itself over the past 9 years. It has reduced its capacity to match its demand and diversified to making steel via EAF mini-mills. Apart from improving its business operations, X has today a stronger balance sheet.
Any analysis and valuation of X should be based on this “transformed” profile. At the same time, steel is a cyclical sector. A valuation of X on such a basis shows that there is a margin of safety at the current price of USD 25.50 per share (as of 6 June 2022).
The rationales for the thesis are presented in the following sections.
Background
In 2013, X (or the Group) adopted “The Carnegie Way,” to transform the Group. Specifically, the Group was:
“…working to strengthen our balance sheet, with more intense focus on cash flow…enable us to add value, get leaner faster, right-size, and improve our performance across our core business process capabilities….” Form 10-K, 2013
“…Our long-term success depends on our ability to…earn an economic profit across the business cycle… we continue working towards strengthening our balance sheet, with a strong focus on cash flow, liquidity, and financial flexibility.” Form 10-K, 2016
Over the past 9 years, the Group had instituted several programmes to improve its operations. These included reliability centred maintenance, and the realignment of the reporting segments with new team leaders. Other initiatives were the shutting down of certain facilities and/or the sale of certain subsidiaries.
The Group also reduced its steel-making capacity in the US and diversified into Electric-Arc-Furnace [EAF] steel-making. Accordingly, the Group’s flat-rolled steel-making capacity in the US has been reduced from 27 m tons in 2013 to 17 m tons in 2022.
The Group today is different from what it was 9 years ago. Any analysis and valuation of X should be based on this “transformed” profile.
I will try to show these changes in the following sections. There are 2 challenges in trying to compare the current performance with that of 9 years ago:
- 2021 performance was skewed by the high steel prices.
- 2020 performance was affected by the Covid-19 situation.
To account for these, I will “normalize” the metrics by working on either a per ton basis or per constant price basis.
Transformed performances
What has changed over the past 9 years?
- It improved its cash management with better Cash Flow from Op and Cash Conversion cycle.
- It has a stronger Balance Sheet today with higher Cash and a lower Debt to Equity ratio.
- However, the results from the operations are not clear-cut. While GP margin and SGA margins have improved, Asset Turnover has not.
- The Group’s annual steel shipment appeared to hover around 16 million tons. This has reduced from 20 million tons in 2013/14.
I think you can get a sense of the scale of the transformation by looking at its world standing. In 2013, the Group was the 13th largest steel producer in the world. By 2020, this had dropped to be the 38th largest.
While it may be a smaller Group today, it is financially stronger and in a better profit-generating position.
Cash flow and liquidity
While there is no significant change in the Current Ratio over the past 9 years, you can see from Chart 1 the improvements in the Cash Conversion Cycle and the Cash Flow from Operations.
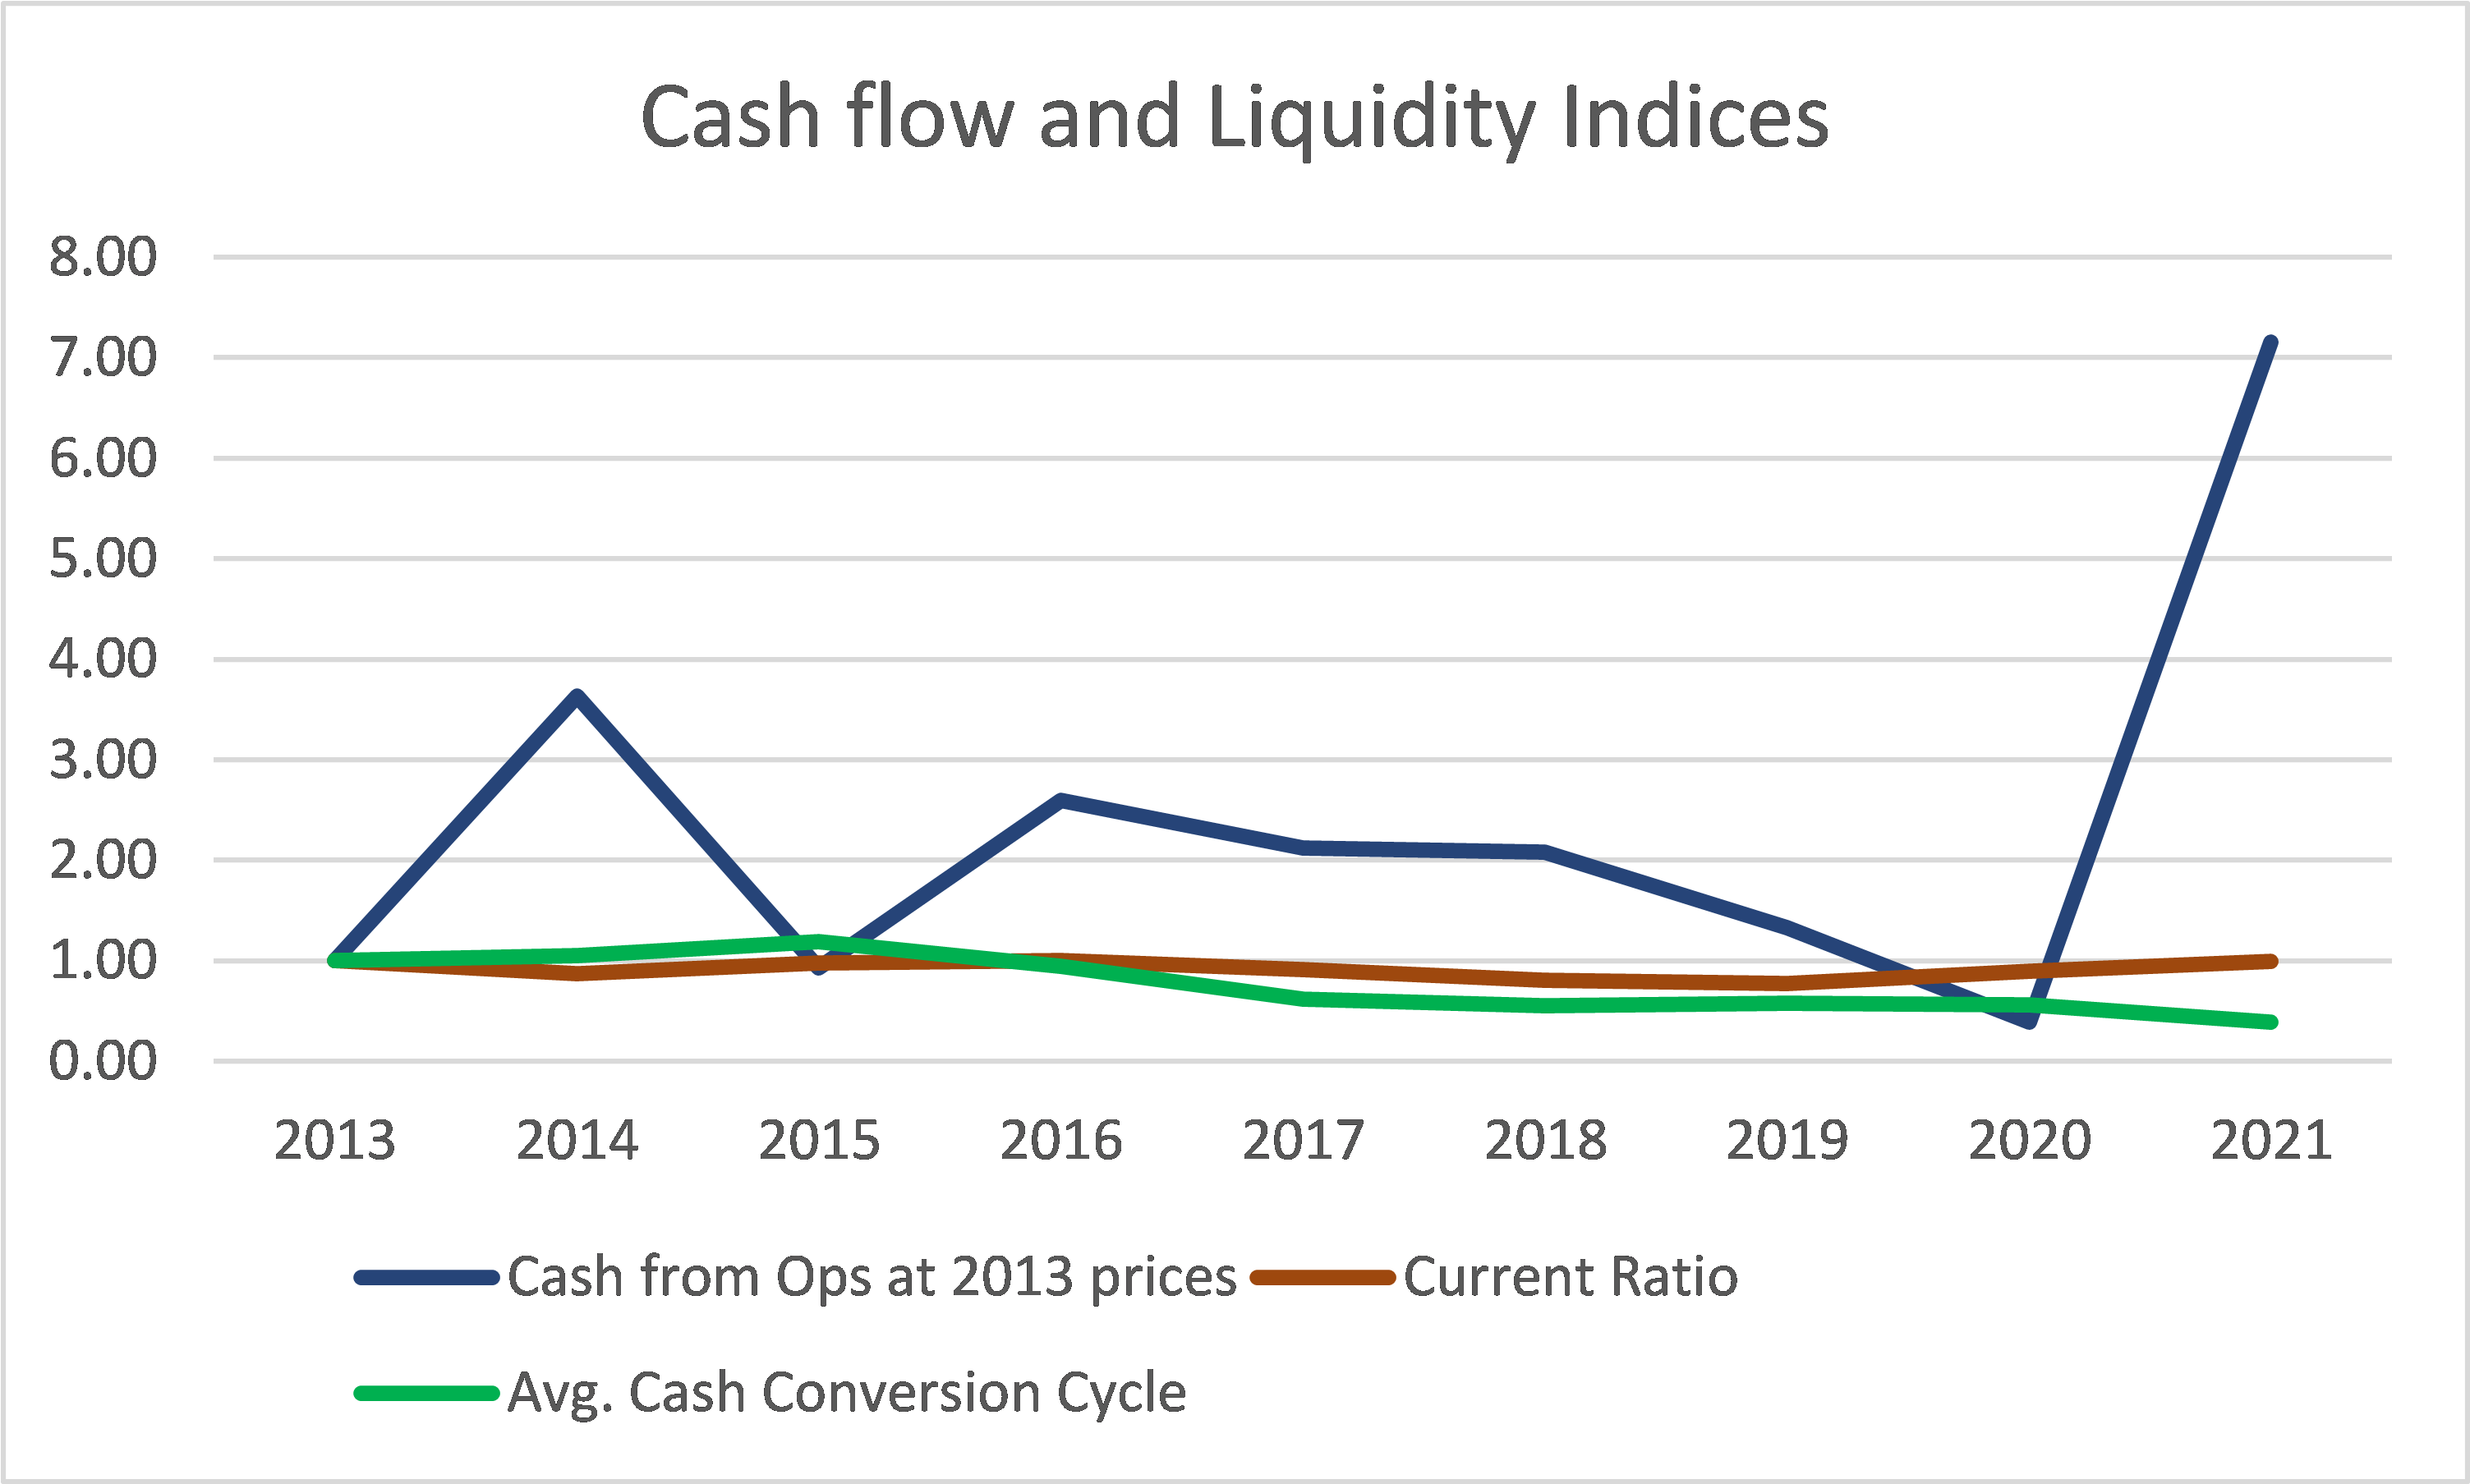
Chart 1: Cash Flow and Liquidity Indices (Author)
Note that for the Cash Flow from Operations, I have taken the values based on the 2013 hot roll prices. I have adjusted the values for the various years based on the Price Index as shown in Table 1.

Table 1 (Author)
Notes to Table 1
a) The Hot Roll Steel prices were extracted from Worthington Industries Form 10-K
b) The Price Index is derived with the 2013 price as the base of 1.00.
For example, the Price Index for 2015 = 591/616 = 0.96
The Cash Flow from Ops for 2013 = USD 405 m
Cash Flow from Ops for 2015 = USD 360
Cash Flow from Ops Index for 2015 at 2013 prices = (360/405) / 0.96 = 0.93
Balance Sheet
There have also been considerable changes in the Balance Sheet.
- Cash and short-term investments in 2021 amounted to USD 2.5 billion compared to USD 0.6 billion in 2013.
- While total Debt in 2021 at USD 3.8 billion is a bit higher than the USD 3.6 billion, the cash position meant a reduction in the net Debt as can be seen from Chart 2 below.
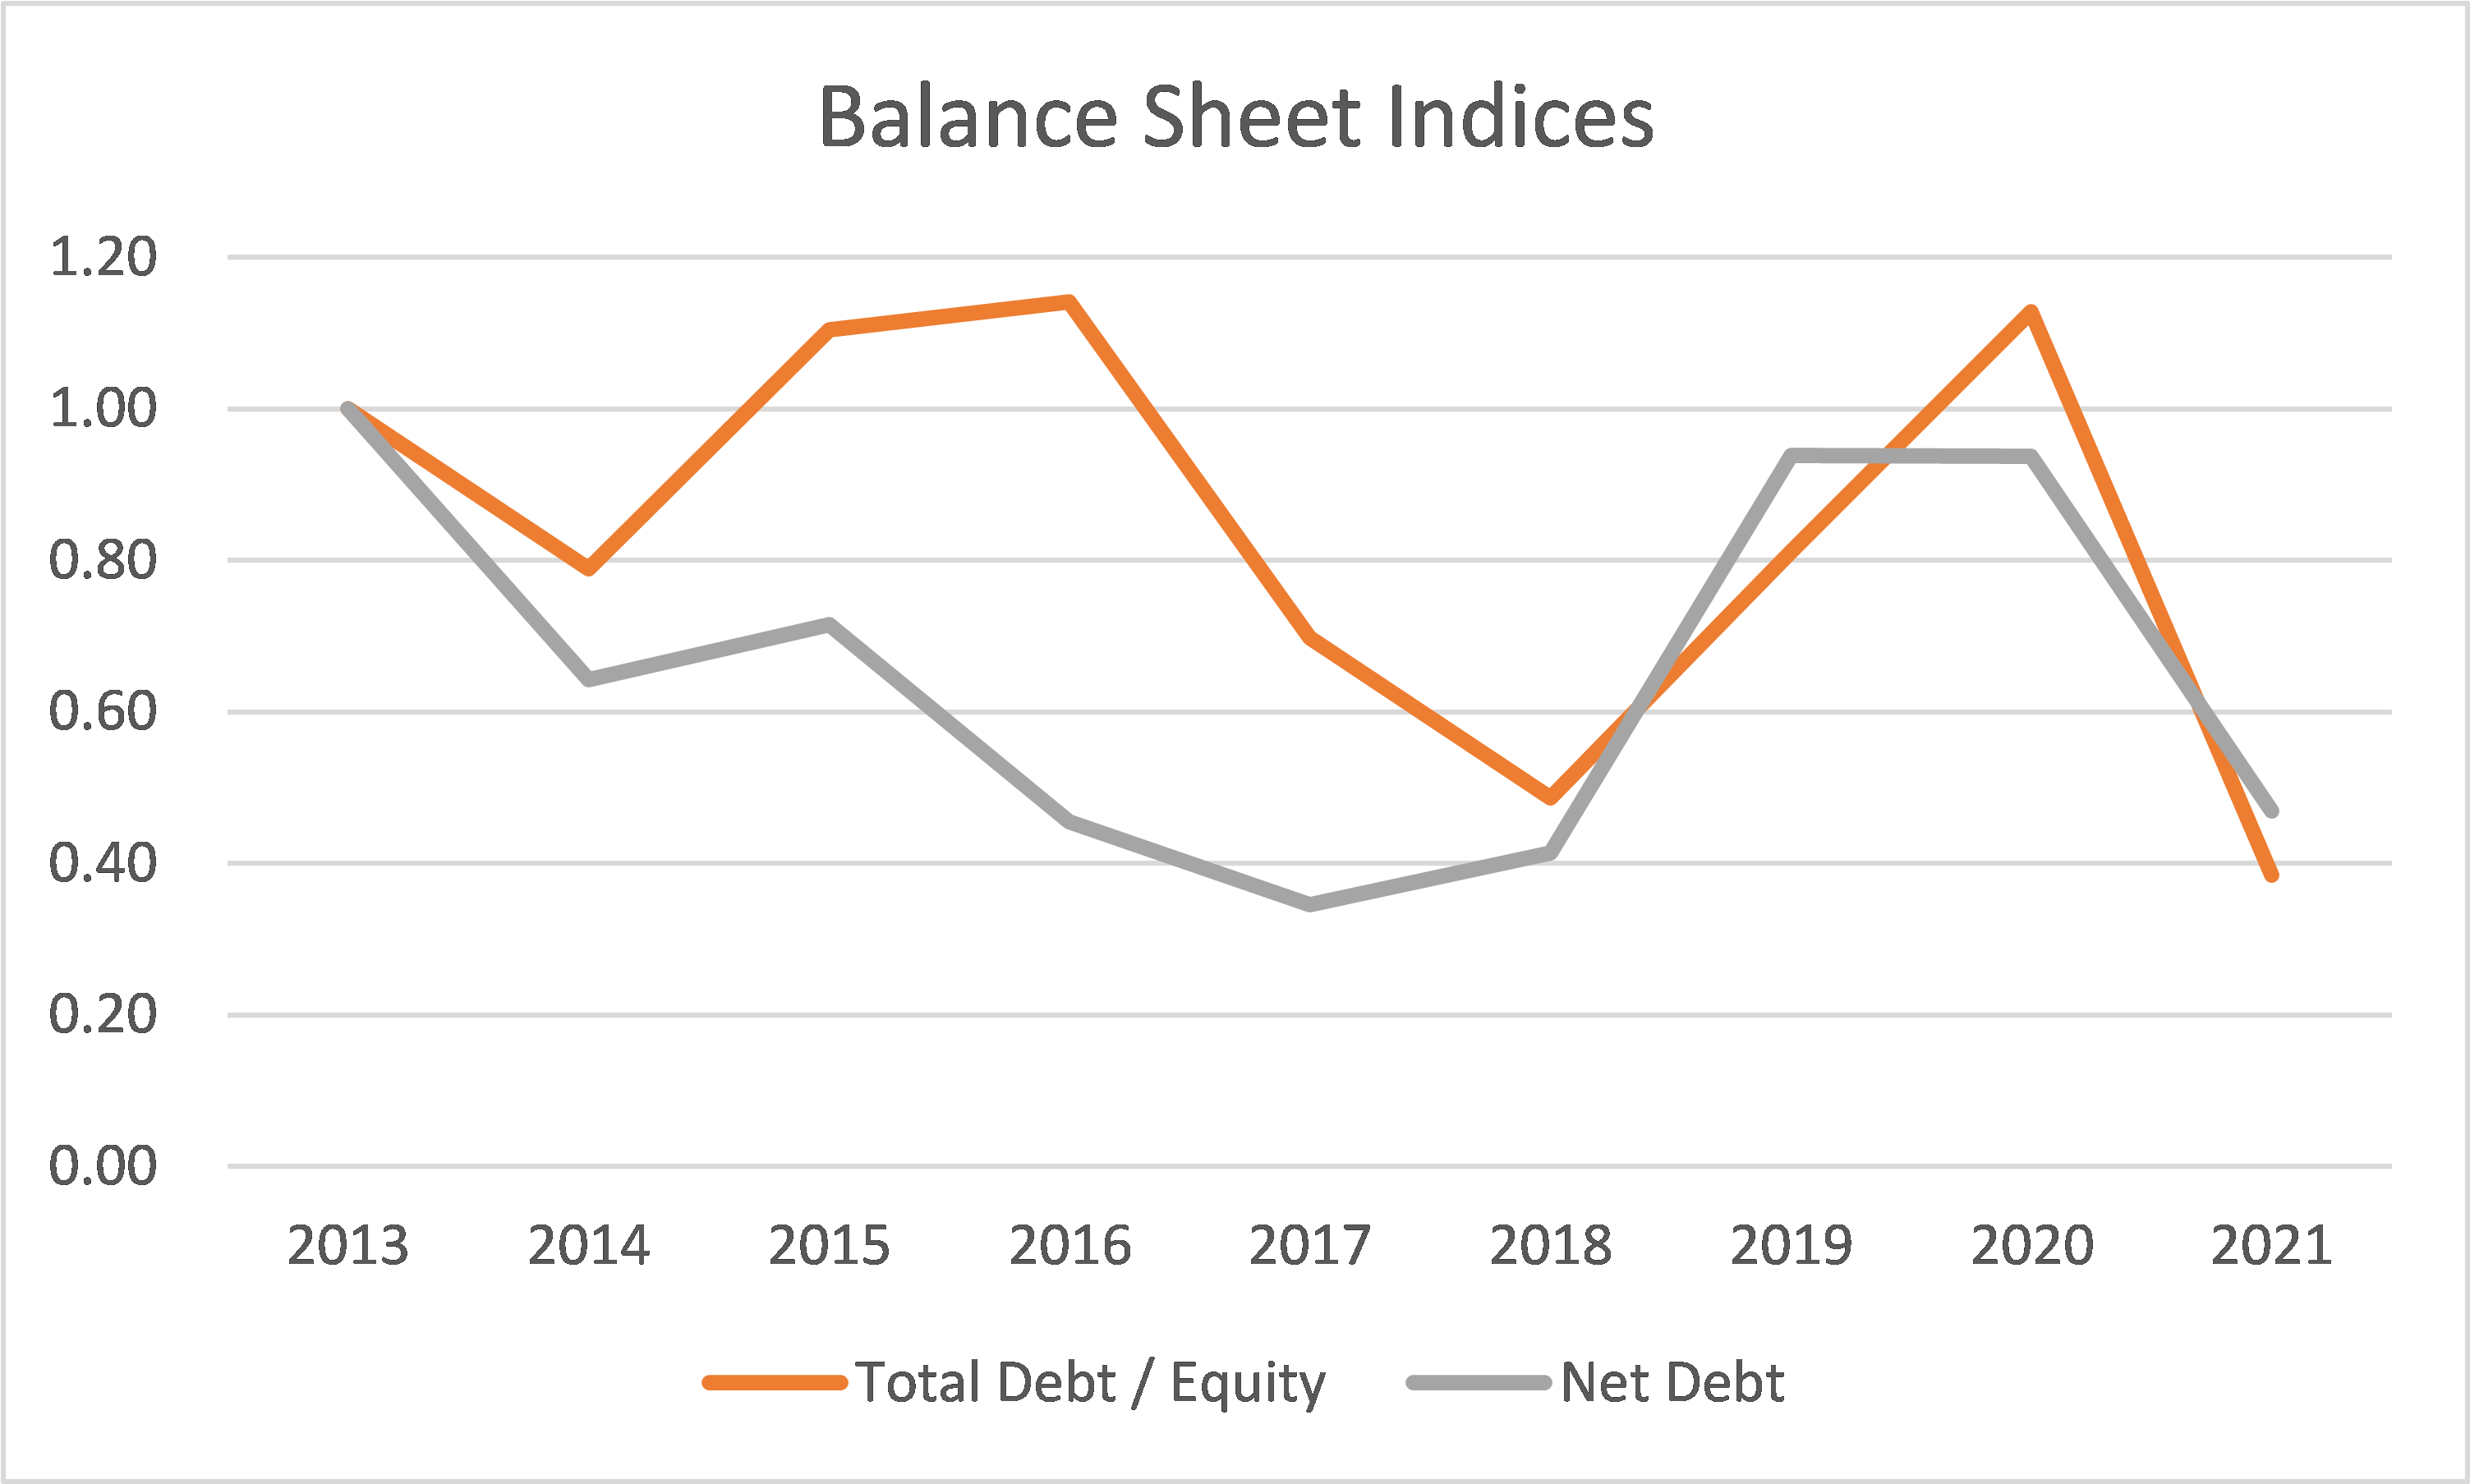
Chart 2: Balance Sheet Indices (Author)
Operating performance
The improvements in the operations are not so clear-cut. There were improvements in some metrics while others like shipment tonnage declined. The tonnage of steel shipped has dropped from 20.4 million tons in 2013 to 16.0 million tons in 2021. It would appear that since 2015 (and excluding the pandemic year) the Group’s annual steel shipments have hovered around 15 to 16 million tons.
Also, GP margin and SGA margins have improved but Asset Turnover has declined. Note that to “neutralize” the impact of the changes in the steel prices, I have compared the trends in the GP margin and SGA margin based on the 2013 price.
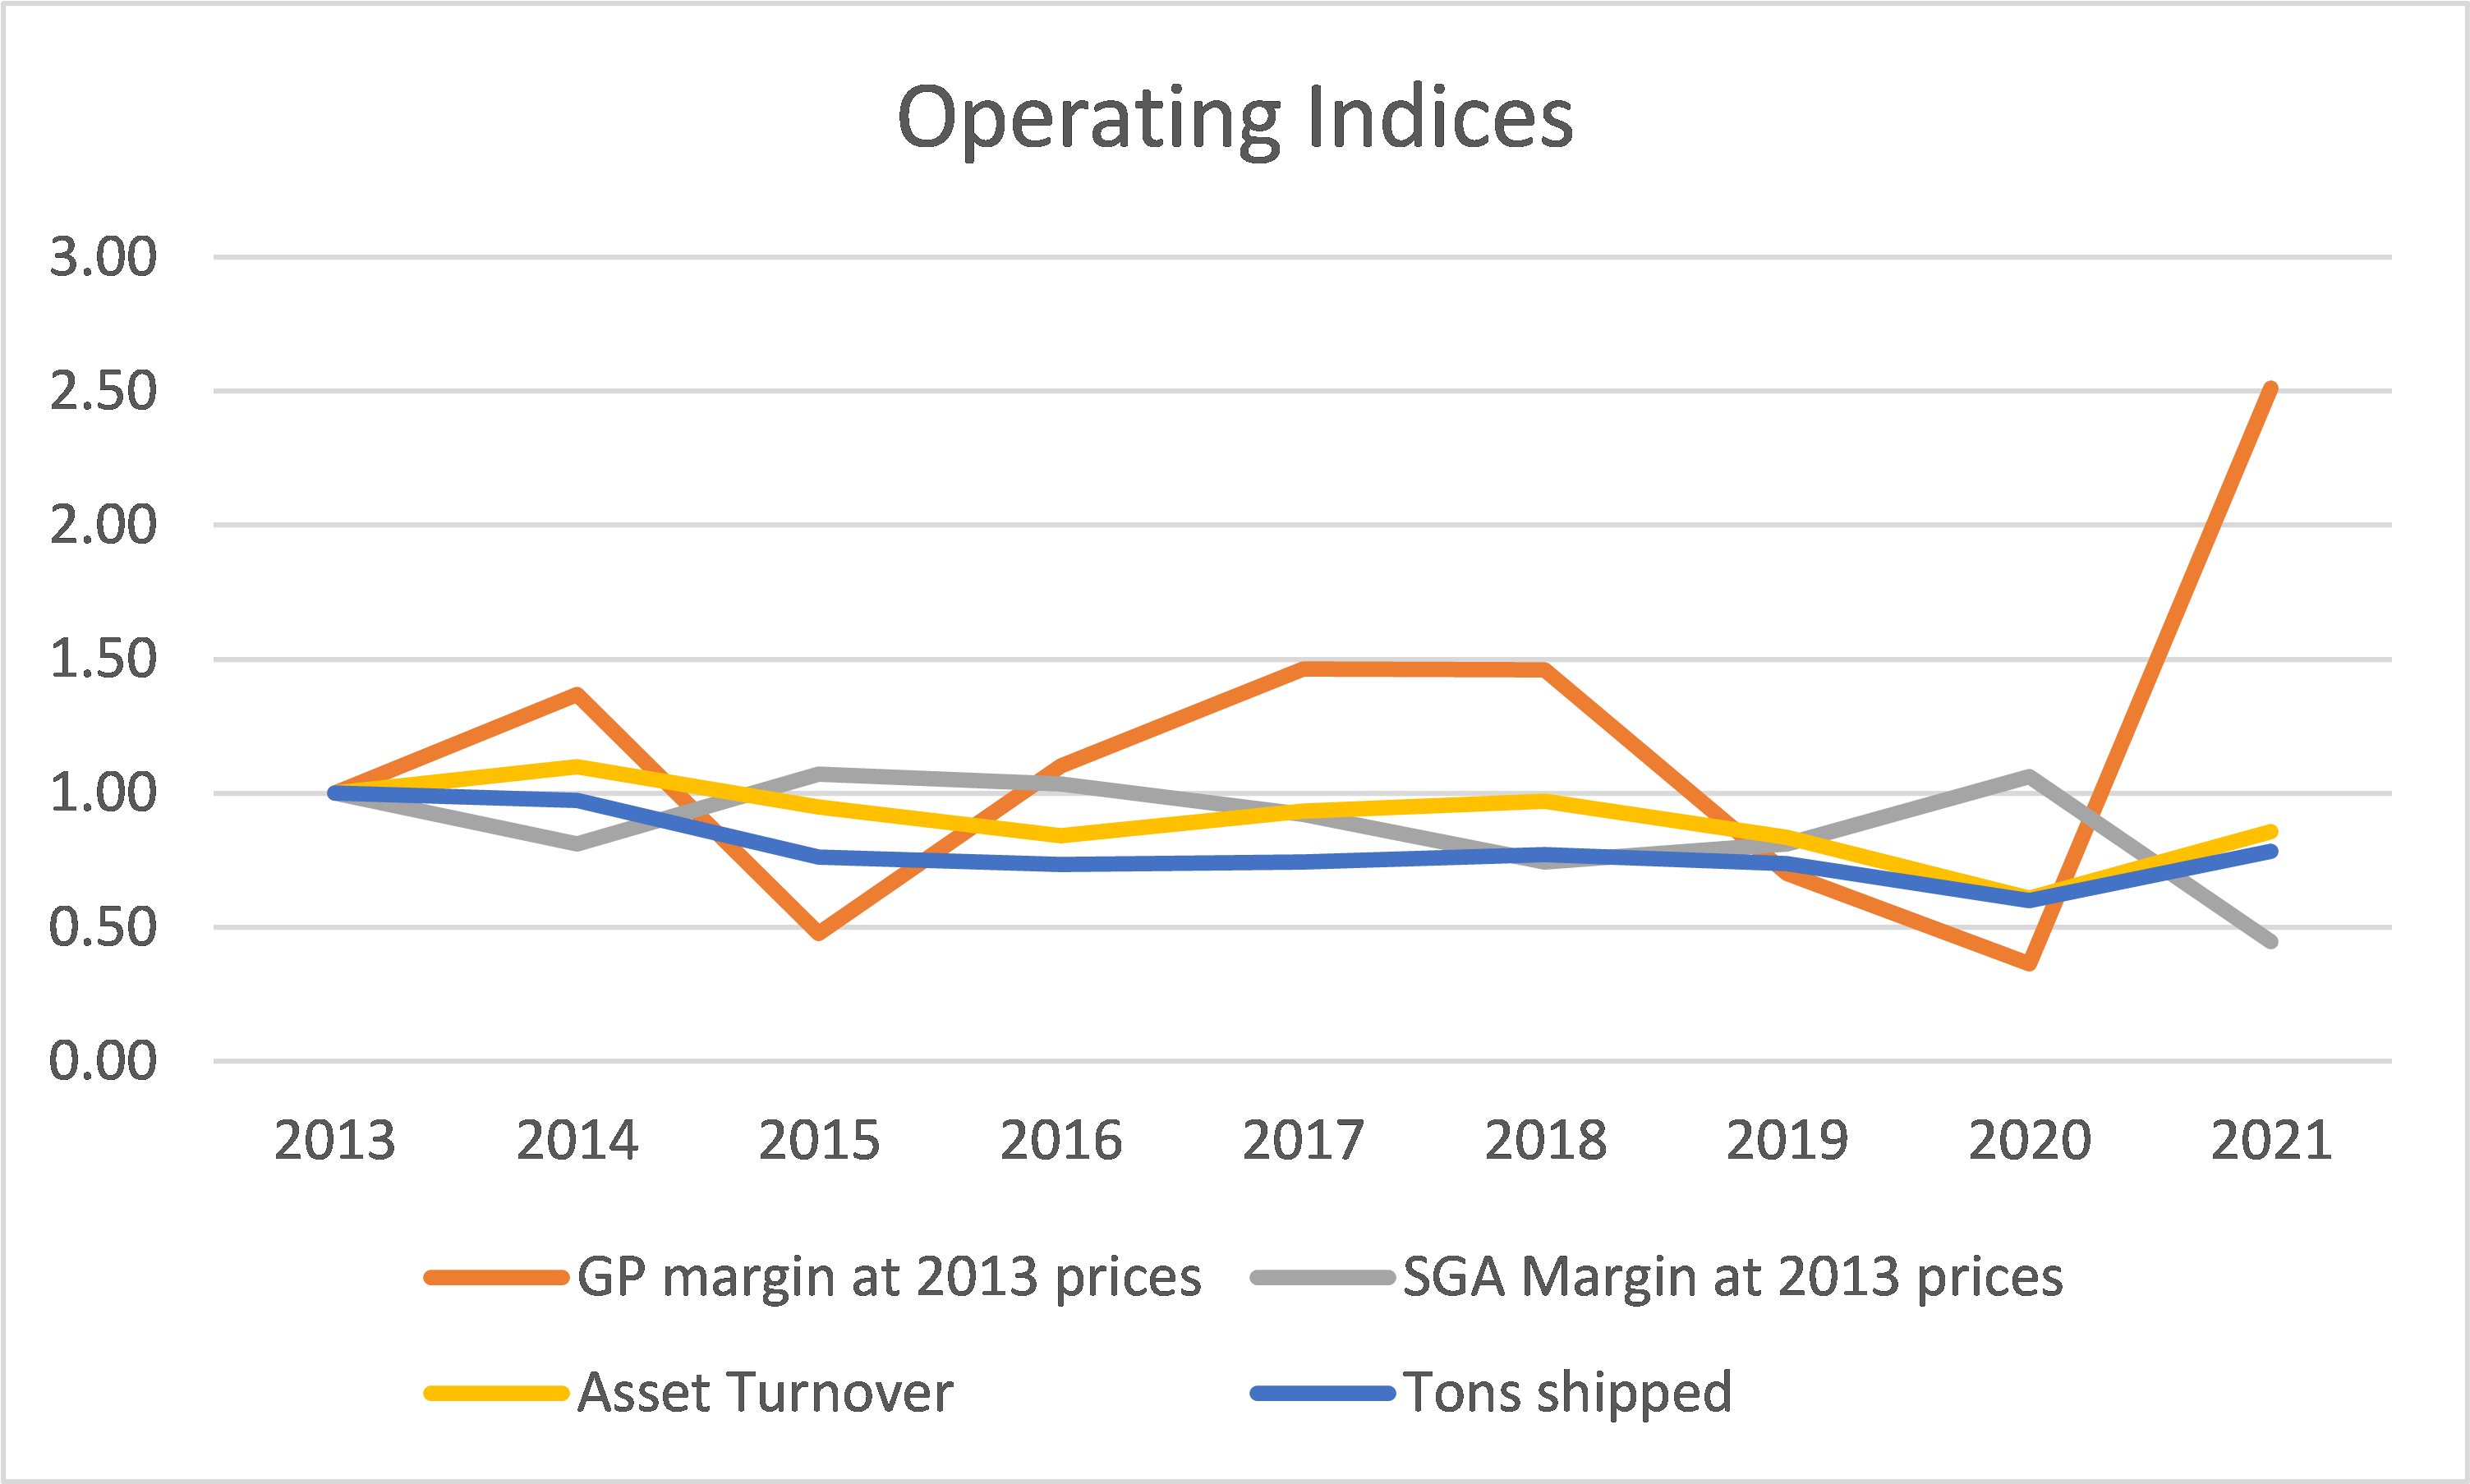
Chart 3: Operating Indices (Author)
But the significant change is the impact of the EAF mini-mill on the GP margin. In 2021, the steel-making GP margins were:
- US Flat Sheet – 27%
- USSE (Europe) – 26%
- Mini mills – 47%
Unfortunately, there is not enough mini-mill operating history to see these differences over the past decade. To give you a sense of the GP margins between EAF and conventional steel making, I compared the following GP margins.
- US Steel (based on US Flat Sheet segment) = 9.7%
- Steel Dynamics (based on Steel segment) = 15.2%
Note that both were the average margins from 2013 to 2021. You can see that Steel Dynamics, which uses EAF technology, has better margins than US Steel Flat Sheet segment. Since steel is a commodity I would consider that the difference in steel-making technology accounted for the difference in the margins.
Performance Index
I track the overall performance based on 3 metrics – revenue, net income, and gross profitability. Refer to Chart 4. Gross profitability = gross profits / total asset. According to Professor Novy-Marx, this metric is a good metric for predicting the returns of a company.
Because of the lower volume of shipments but better prices, the Group’s revenue over the past 7 years did not show any significant changes. However net income and gross profitability had improved.
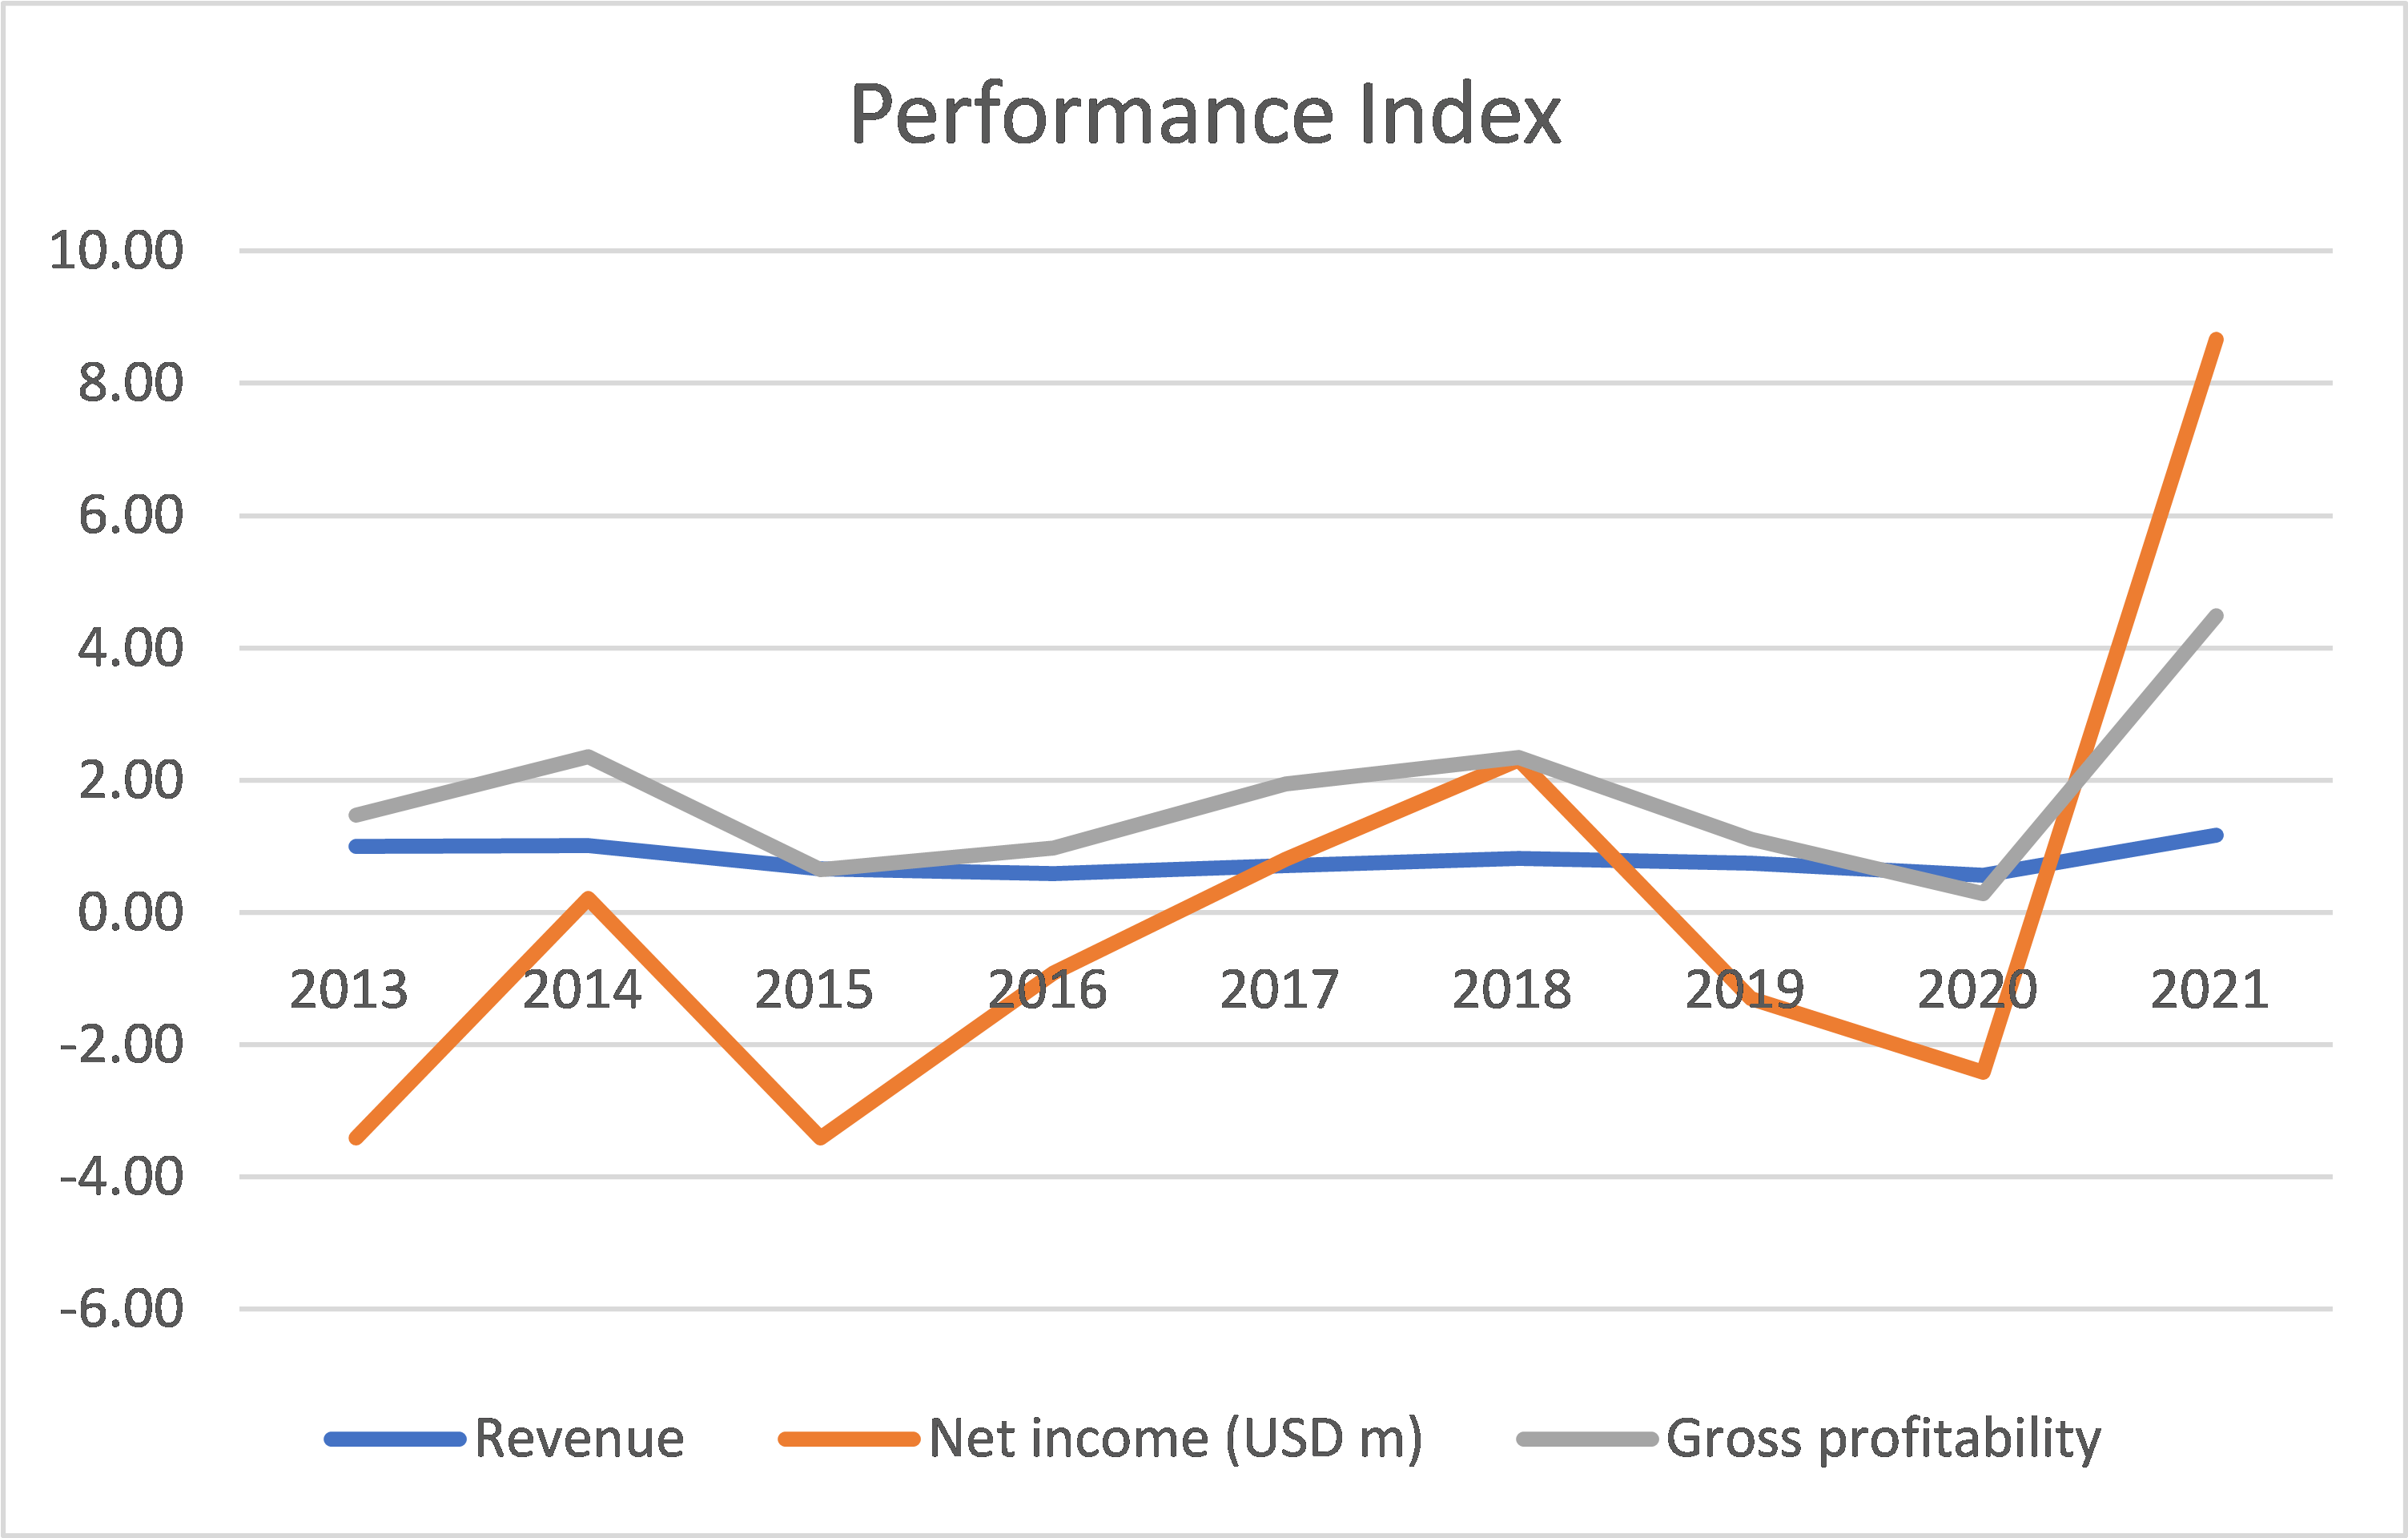
Chart 4: Performance Indices (Author)
Valuation
I valued the Group using a single-stage discounted free cash flow to the firm (FCFF) model.
Value of the firm = FCFF X (1 + g) / (r – g)
FCFF = EBIT(1 – tax rate) – Reinvestment
EBIT = Gross profit – SGA
Reinvestment = CAPEX + Net Acquisitions – Depreciation & Amortization + Net Working Capital
r = WACC.
g = growth rate = Reinvestment rate X Return.
Reinvestment rate = Reinvestment / EBIT(1 – tax rate)
Return = EBIT(1 – tax rate)/TCE where TCE = SHF + MI + Debt – Cash
Gross profit = Revenue X Gross profit margin.
SGA = Revenue X SGA margin
The value of equity = Value of firm – Debt + Cash & Securities
The key assumptions used in the valuation are
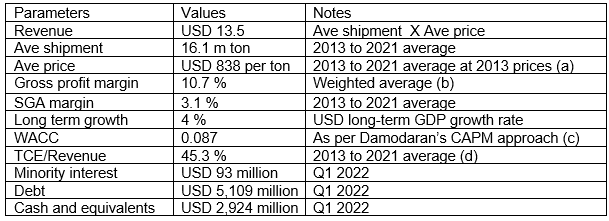
Table 2: Valuation assumptions (Author)
Notes to Table 2.
(a) Factorized as per Table 1
(b) Derived based on the following projected shipment tonnage and gross profits:
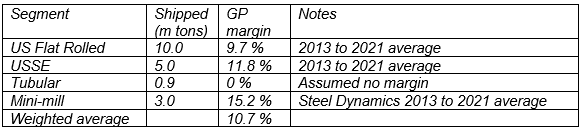
Table 3. Deriving the GP margin (Author)
(c) Risk-free rate = 1.51%, Unlevered Beta for steel sector of 0.98, Tax rate of 21%.
(d) This is to determine the TCE relevant for the assumed revenue so that we can determine the Reinvestment rate.
Based on this model, I valued the Group as:
Asset Value or Book Value = USD 37 per share.
EPV = USD 30 per share.
Earnings Value with 4% growth = USD 42 per share.
With the current price of USD 25.50 per share, you can see that there is an 18% sufficient margin of safety even based on the EPV.
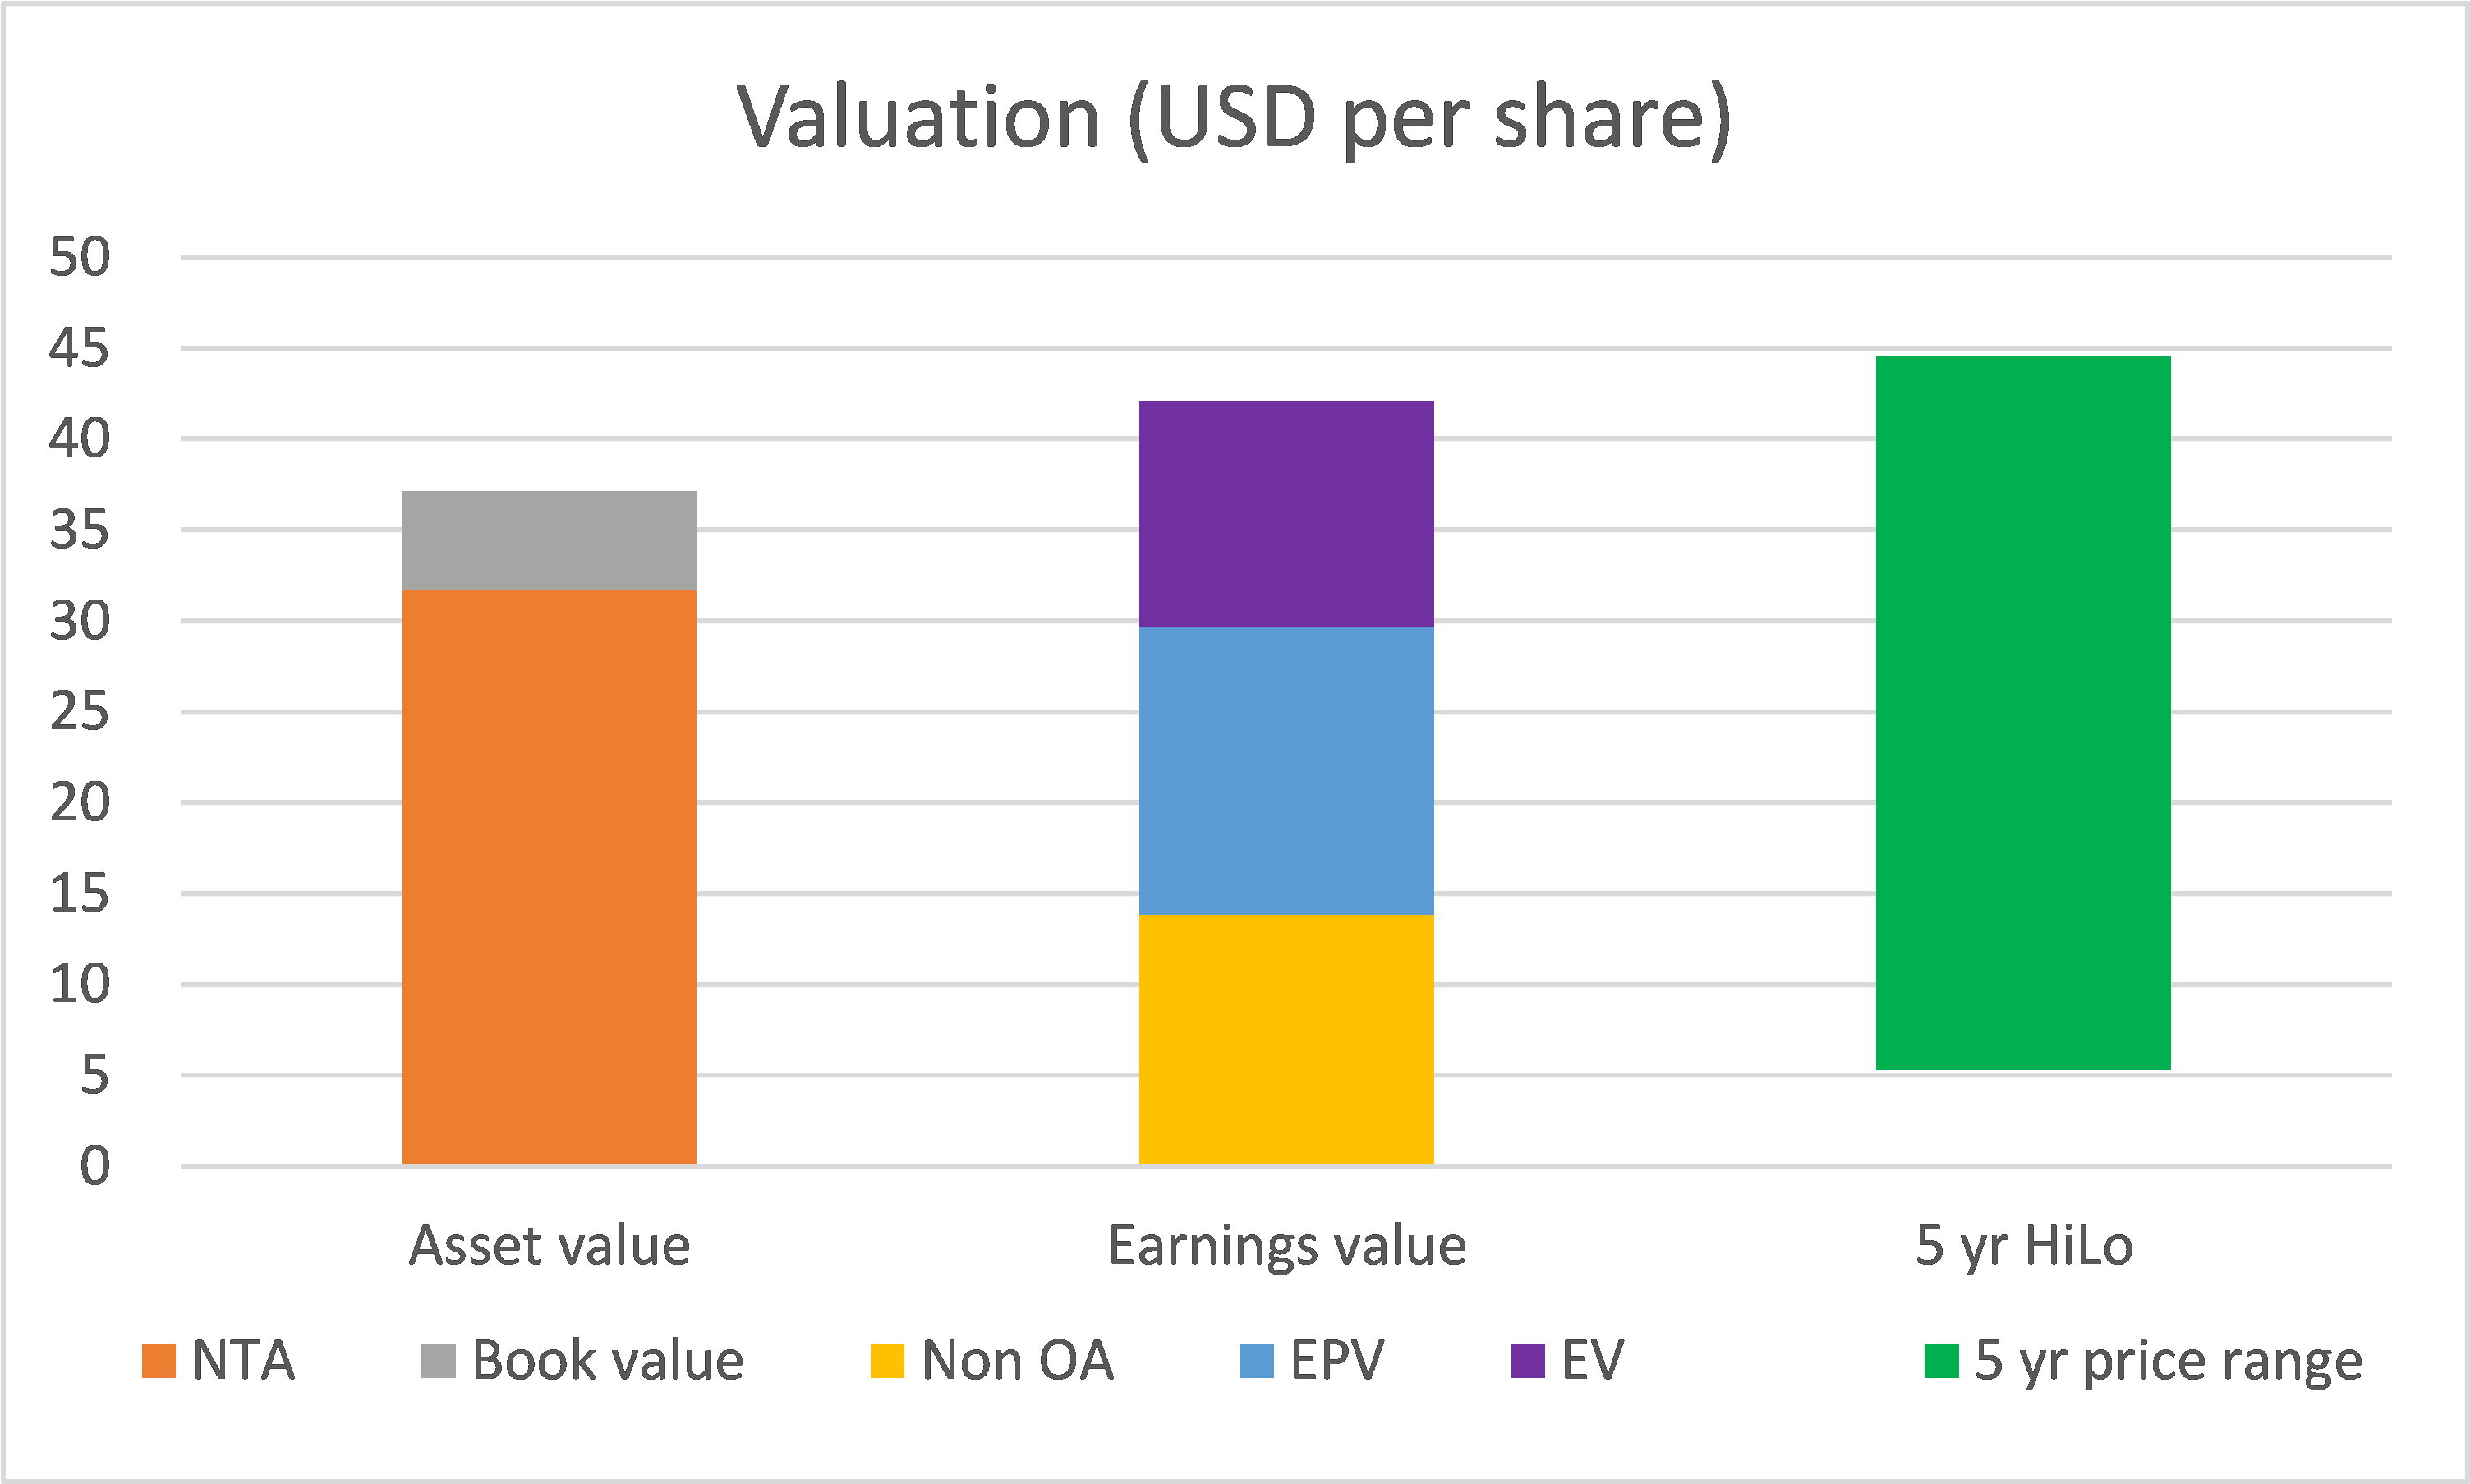
Chart 5: Valuation (Author)
From 2013 to 2021, the steel sector had gone through at least 1 price cycle. Refer to Table 1. In other words, my valuation is based on the performance of the Group over the price cycle and the margins of safety are conservative ones.
It would look like 2022 would be another bumper year for the Group with the first quarter EPS at USD 3.37. If the Group continues with this level of performance, the 2022 profit itself can be considered another margin of safety. This is especially since my valuations are based on the average profits over the cycle.
Risks
There are 3 key risks here:
- USSE/European business.
- Additional impairment and closure costs.
- Valuation risk.
The biggest risk for the Group is the European operations. This segment employed about 32% of the Group’s Total Assets as of end-March 2022, and historically accounted for about 20% of the Group’s Revenue.
According to its March 2022 Form 10-Q:
“…The war in Ukraine will likely continue to cause disruption and instability in Russia, Ukraine, and the markets in which we operate…USSE purchases certain raw materials from sources that procure supply from Russia, including natural gas, iron ore and coal.”
I have assumed that over the long-term, USSE would have alternative sources of materials as well as overcome its marketing problems.
In mitigation, I have assumed that the Group shipment is about 16 million tons. There is still spare production capacity. At the same time, the Group is still expanding its mini-mills. As such any reduction in the USSE contribution could be offset by the mini-mills and the US Flat Rolled excess capacity.
In the worst-case scenario, I estimated that it would cost the Group USD 9 per share if USSE was to be discontinued. This estimate assumes that USSE’s 32% of the Total Assets also apply to the Book Value. At the same time, in any closure, the impact is on the Non-Current Assets only. I had assumed that the Group’s Non-Current Assets to Total Assets ratio of 60% is also applicable to USSE. The write-down cost = USD 37 X 40% X 60% = USD 9.
The other risk for the Group is the restructuring and closure costs. Over the pasts 9 years, the Group had incurred about USD 369 million annually for impairments, mergers, and restructuring costs. I have assumed that no such costs are going forward since its capacity had reduced significantly.
As for the valuation risk, it relates to the WACC. My WACC was derived based on Damodaran’s Jan 2022 datasets. I am sure it did not take into account the Ukraine invasion and the high inflation impact. These 2 factors would mean greater risk. Damodaran does not have an updated dataset that takes into account the current situation. As such one way to account for this risk is to have a higher margin of safety.
Conclusion
US Steel is no longer the Group it was 9 years ago. While it is a smaller Group in terms of steel-making capacity, it is stronger from a cash generation and Balance Sheet perspective. It is also in a better position to deliver higher returns as it has a lower cost structure. This is partly due to its diversification into mini-mills and the lower SGA margins.
I have valued the Group on a conservative basis by assuming a revenue based on historical shipment tonnage and average past 9 years’ prices. Over the past 9 years, the steel sector has gone through at least 1 price cycle, and my valuation is thus based on its performance over the price cycle.
On such a basis, I have found that there is an 18% margin of safety based on the EPV. Based on the value with 4% growth, there is a 65% margin of safety.
The really big risk here is the impact of the Ukraine invasion. I have assumed that over the long term, the Group European segment would be able to continue with its historical performance. If you accept this proposition, then X is a buying opportunity.
Be the first to comment