

Gerasimov174/iStock via Getty Images
A guest post by Ovi
All of the oil (C + C) production data for the US state charts comes from the EIAʼs Petroleum Supply monthly PSM. After the state production charts, an analysis of two EIA monthly reports that project future production is provided. The charts below are updated to May 2022 for the 10 largest US oil-producing states.
EIA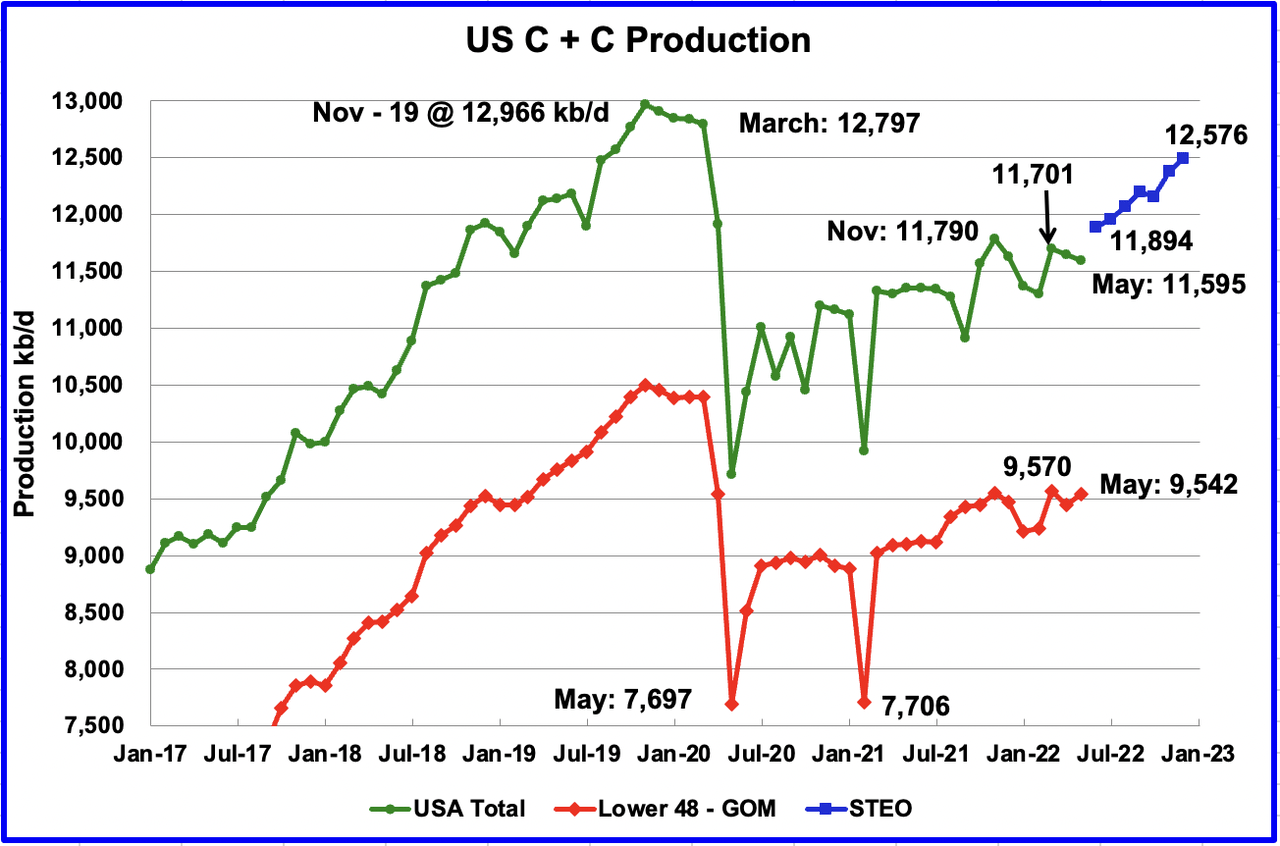
U.S. May production decreased by 57 kb/d to 11,595 kb/d. The largest production decreases came from the GOM, Texas and New Mexico. The largest drop occurred in the GOM but was offset by the increase in North Dakota. May production was 195 kb/d lower than November 2021 which was producing at a rate of 11,790 kb/d. The production drop in all three Southern areas was affected by the May storms.
May 23rd and 24th brought several rounds of thunderstorms, complete with tornadoes, damaging winds, hail and widespread rain, to the South Plains region of West Texas. The activity was fueled by returning Gulf of Mexico moisture following a strong May front that provided a relatively cool and dry weekend leading up to the stormy stretch. Moderate to strong instability developed across the western South Plains and eastern New Mexico Monday afternoon and evening (May 23rd) as the improving low-level moisture and temperatures warming into the 80s developed beneath an approaching upper level storm system
While overall US production was down, a clearer indication of the health of US onshore oil production can be gleaned by looking more closely at the On-shore L48 states. In the On-shore L48, May production increased by 95 kb/d to 9,542 kb/d.
The blue graph, taken from the July 2022 STEO, is the production forecast for the US from June 2022 to December 2022. Output for December 2022 is expected to be 12,576 kb/d. From June 2022 to December 2022, production is expected to increase by 682 kb/d or at an average rate of 113.7 kb/d/mth.
Oil Production Ranked by State
EIA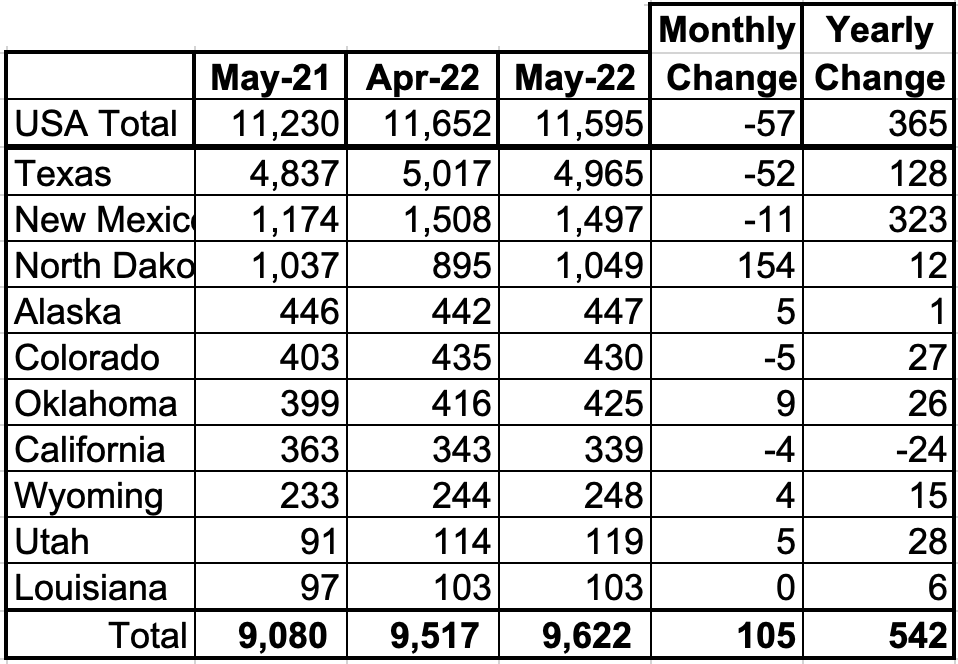
Listed above are the 10 states with the largest US production. These 10 accounted for 83.0% of all U.S. oil production out of a total production of 11,595 kb/d in May 2022.
On a YoY basis, US production increased by 365 kb/d, with the majority having come from New Mexico.
EIA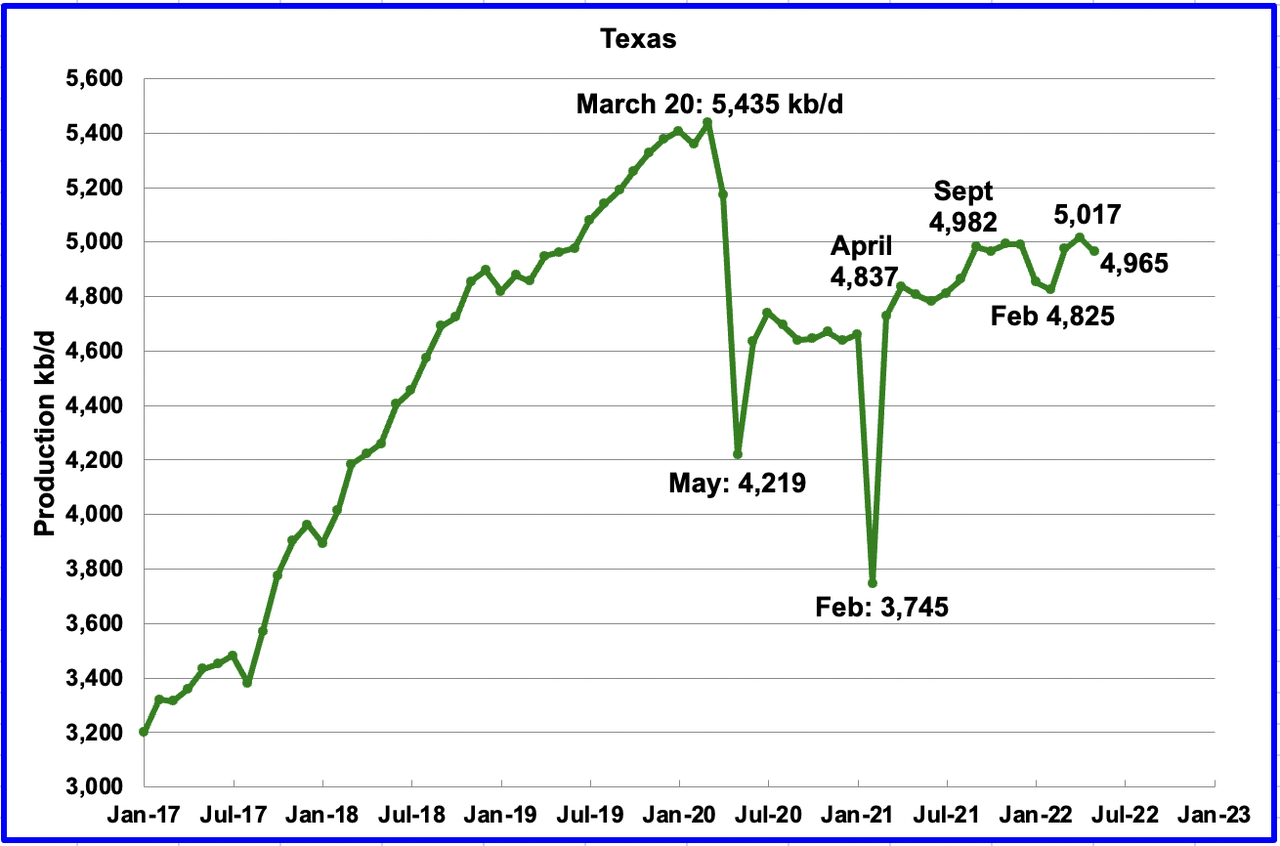
Texas production decreased by 52 kb/d in May to 4,965 kb/d from 5,017 kb/d in April due to weather.
In September 2021, there were 205 Hz oil rigs operating in Texas. By the last week of May 2022, 303 Hz oil rigs were operational, an increase of 98 rigs, and production decreased from 4,982 kb/d in September to 4,965 kb/d in May, a drop of 17 kb/d.
EIA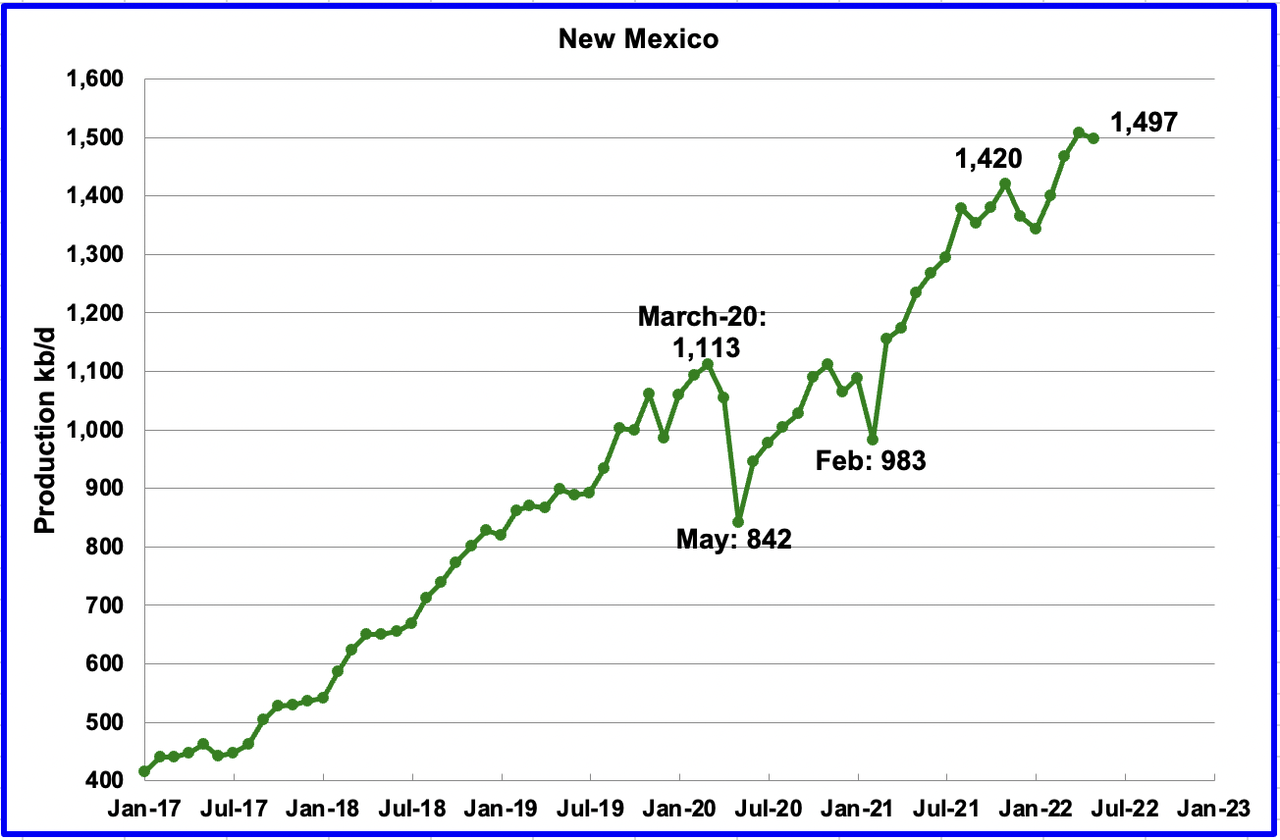
May’s New Mexico production decreased by 11 kb/d to 1,497 kb/d due to weather. From January 2022 to the end of May, close to 92 rigs have been in operation in the New Mexico Permian. However, in June and July, operational rigs exceeded 100. The recent production increase is due to more wells being completed than drilled.
EIA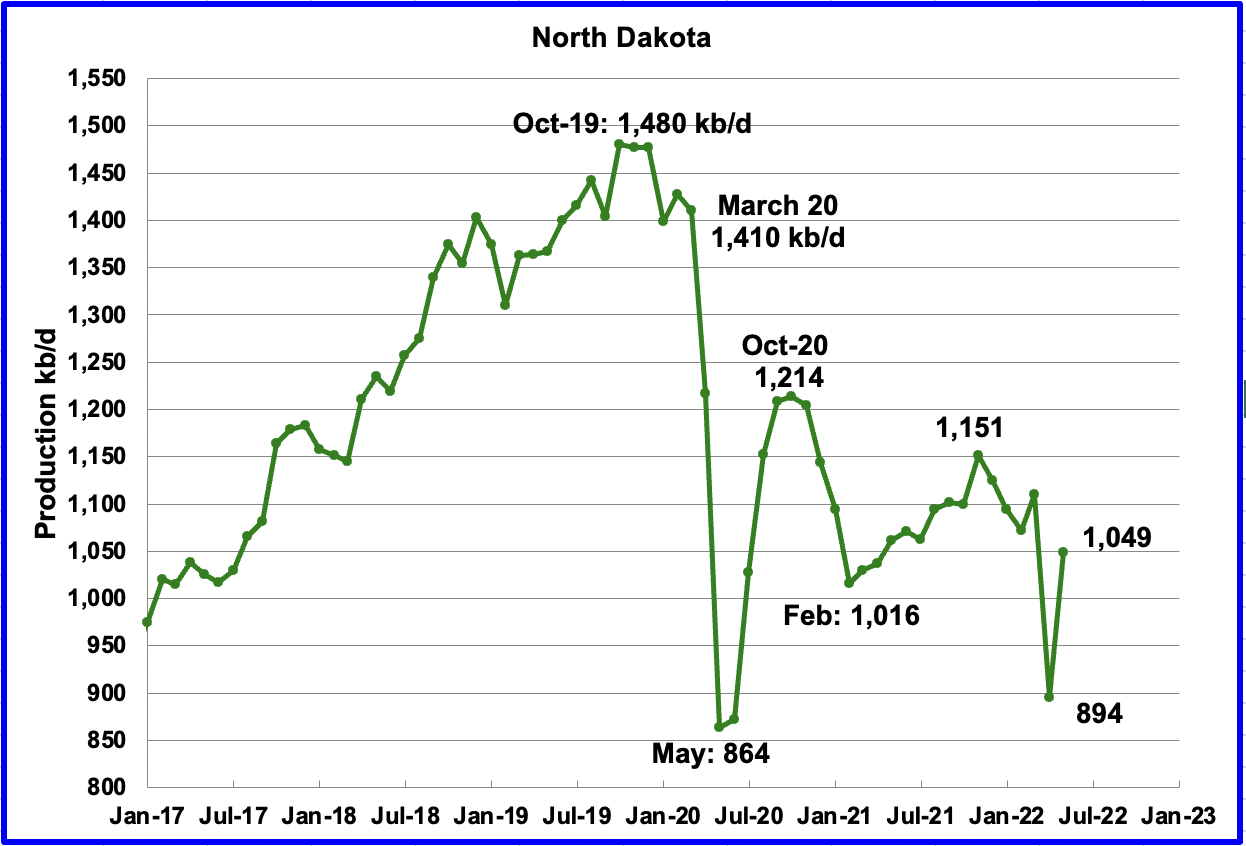
North Dakota’s May output rebounded from the April storm to 1,049 kb/d, an increase of 155 kb/d from April.
EIA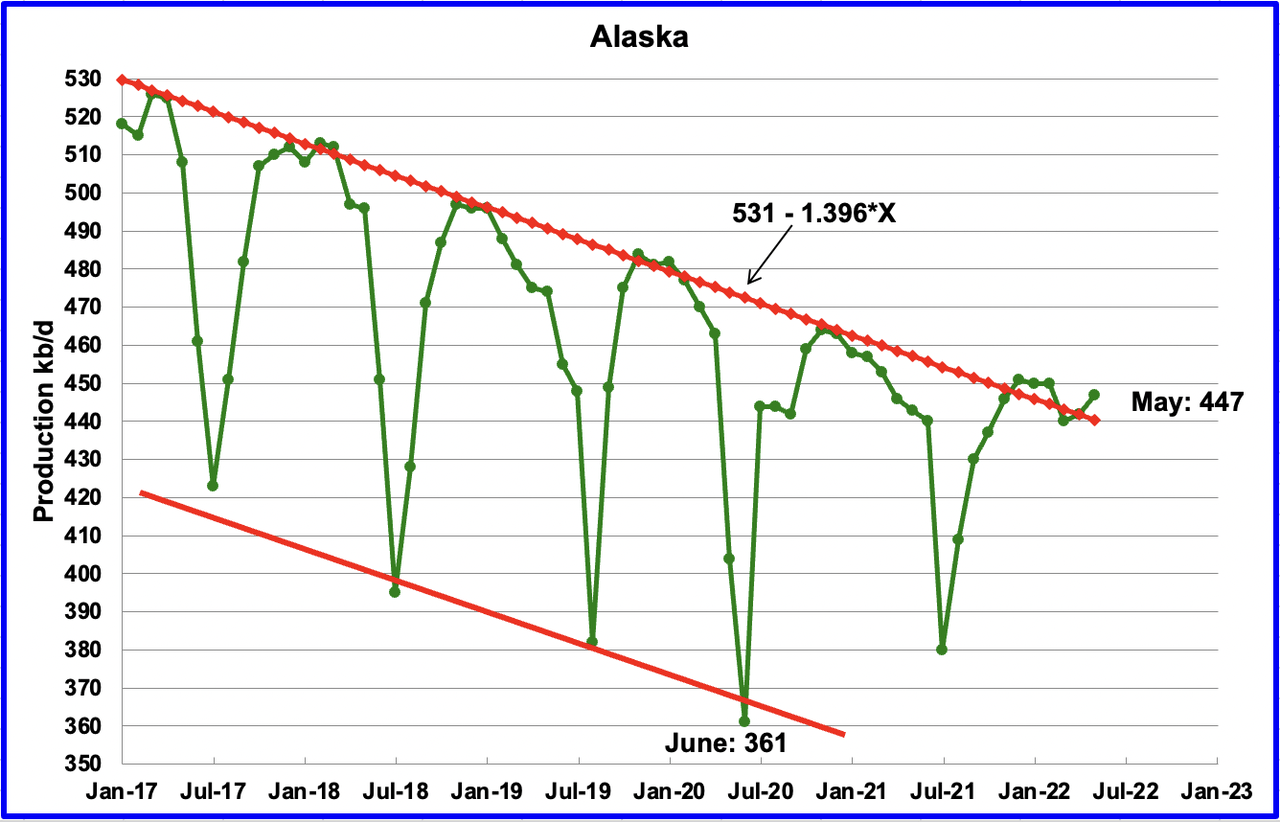
Alaskaʼs April output increased by 5 kb/d to 447 kb/d. Typically May production falls in between the red lines. Is this increase from a new production area in Alaska?
EIA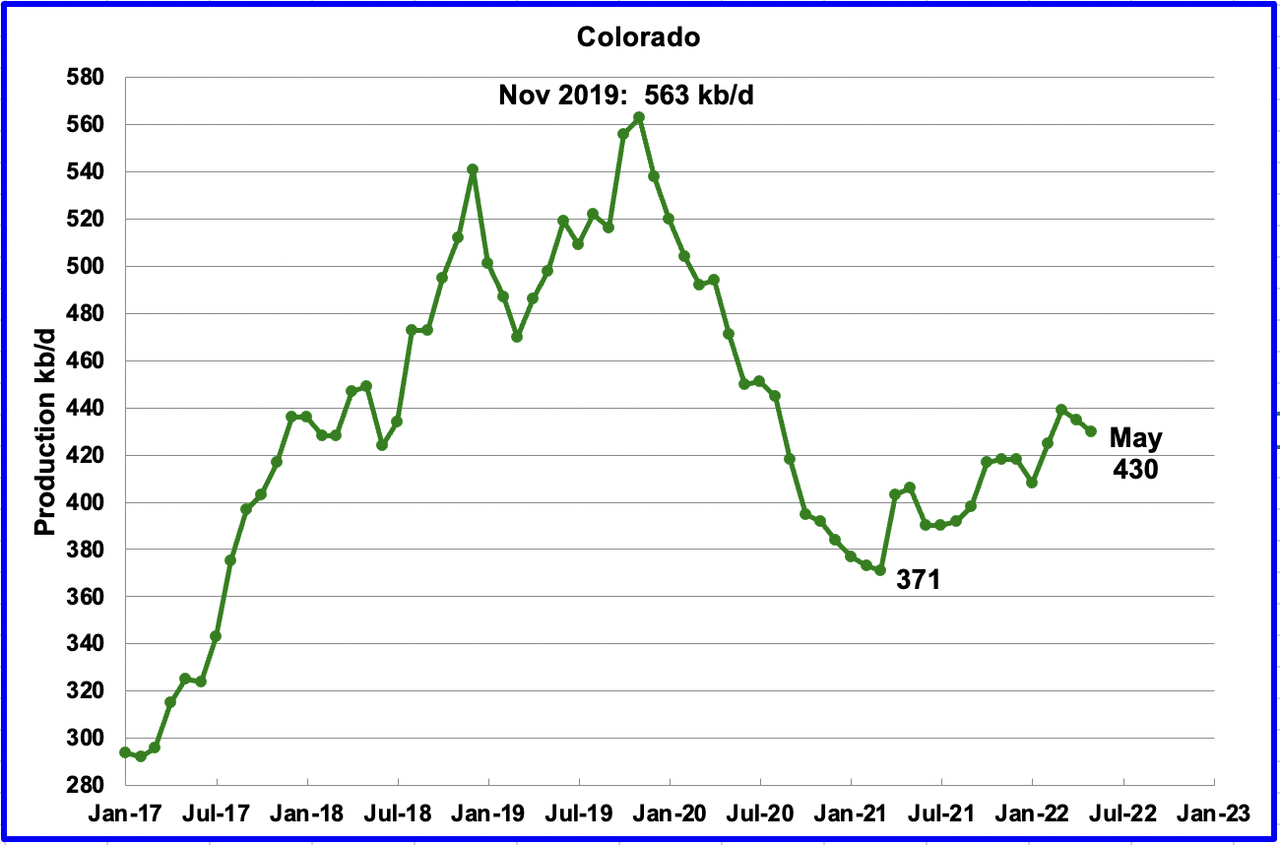
Coloradoʼs May production decreased by 5 kb/d to 430 kb/d. A recent Colorado report estimates little oil growth likely in Colorado for 2022.
EIA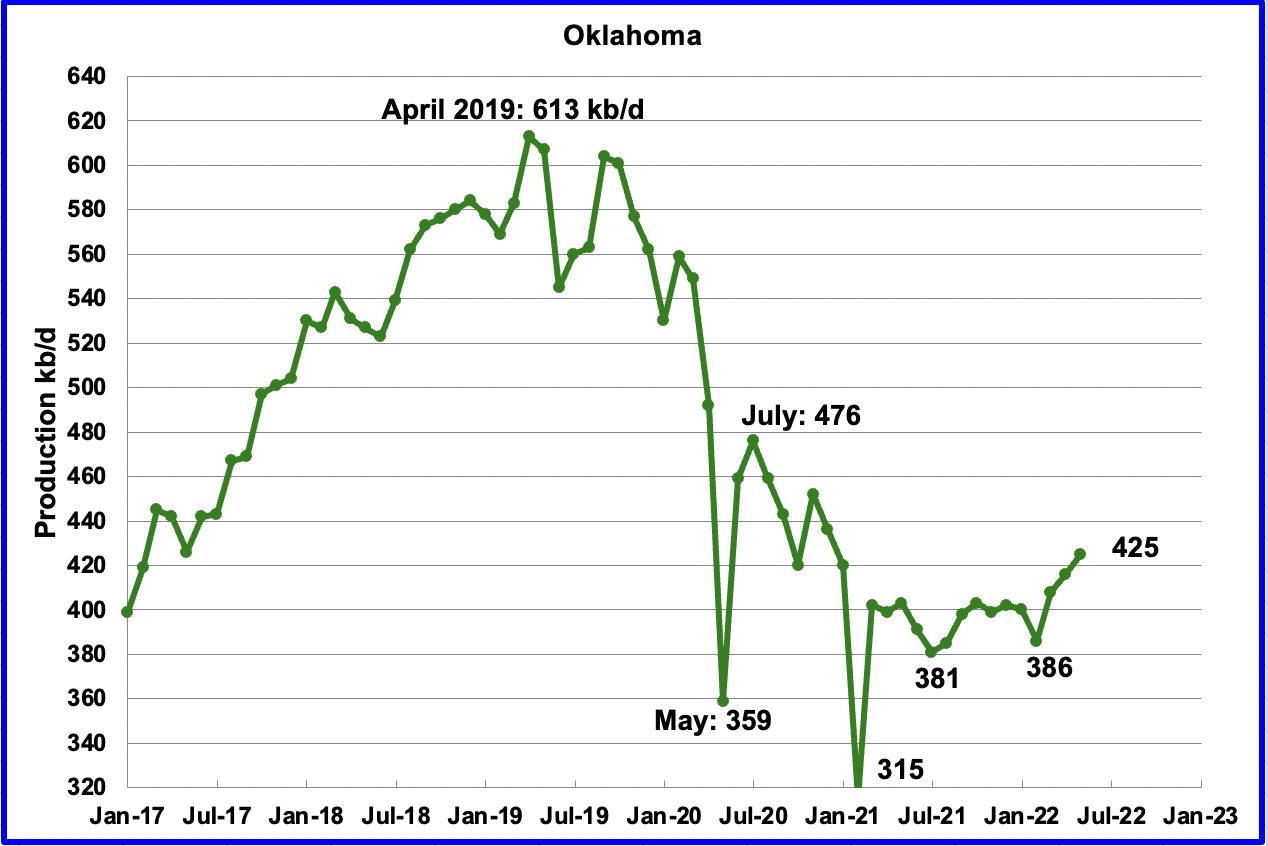
Oklahoma’s output in May increased by 9 kb/d to 425 kb/d. May’s output broke out above the 400 kb/d level it has been struggling with since September 2021. From January to April, close to fifty rigs were operating in Oklahoma. In May, the rig count increased to 54.
EIA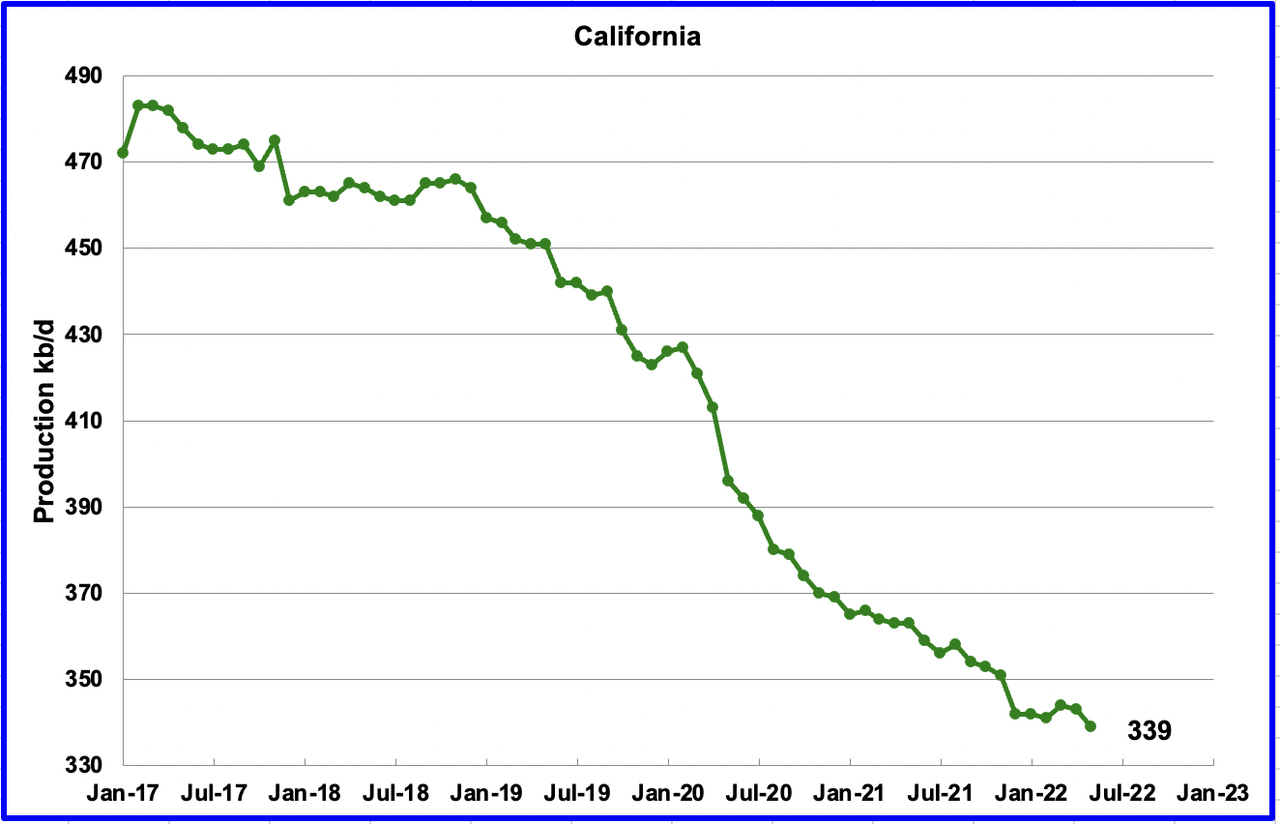
Californiaʼs slow output decline continued in May. Output decreased by 4 kb/d to 339 kb/d.
EIA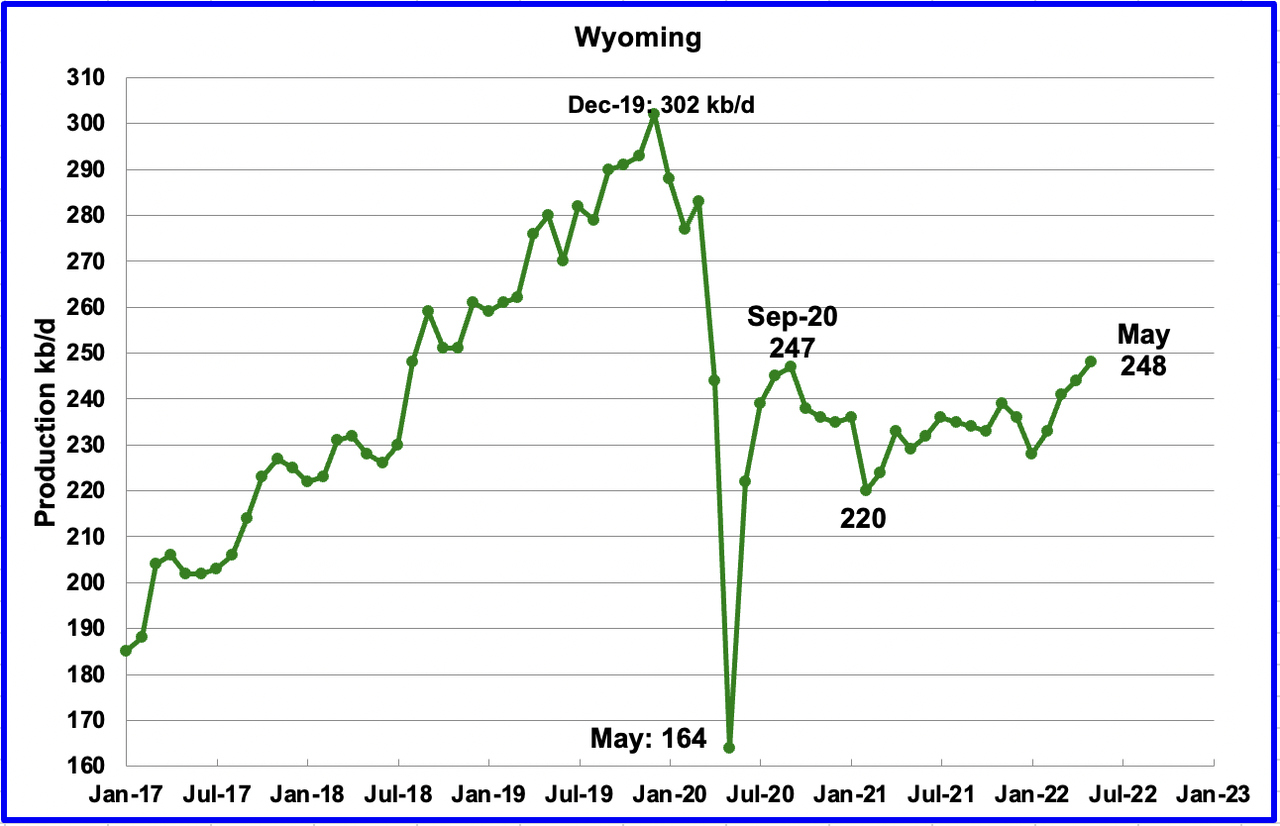
Wyoming’s oil production has been on an uptrend from the low of 220 kb/d in February 2021. According to this source, the increase is related to increased drilling. May’s output increased by 4 kb/d to 248 kb/d.
“Pete Obermueller, president of the Petroleum Association of Wyoming, told the Joint Minerals, Business and Economic Development Committee on Monday that the state’s drilling rig count is slowly increasing and reached 21 this week. (Baker Hughes, which tracks rigs differently, reported Friday that Wyoming had 18.)
(Note the difference between BH and local reporting as noted earlier by a few of our participants.)
The current rig count “obviously is better,” Obermueller said. “Still not where we’d like to be, but we’re moving in the right direction.”
EIA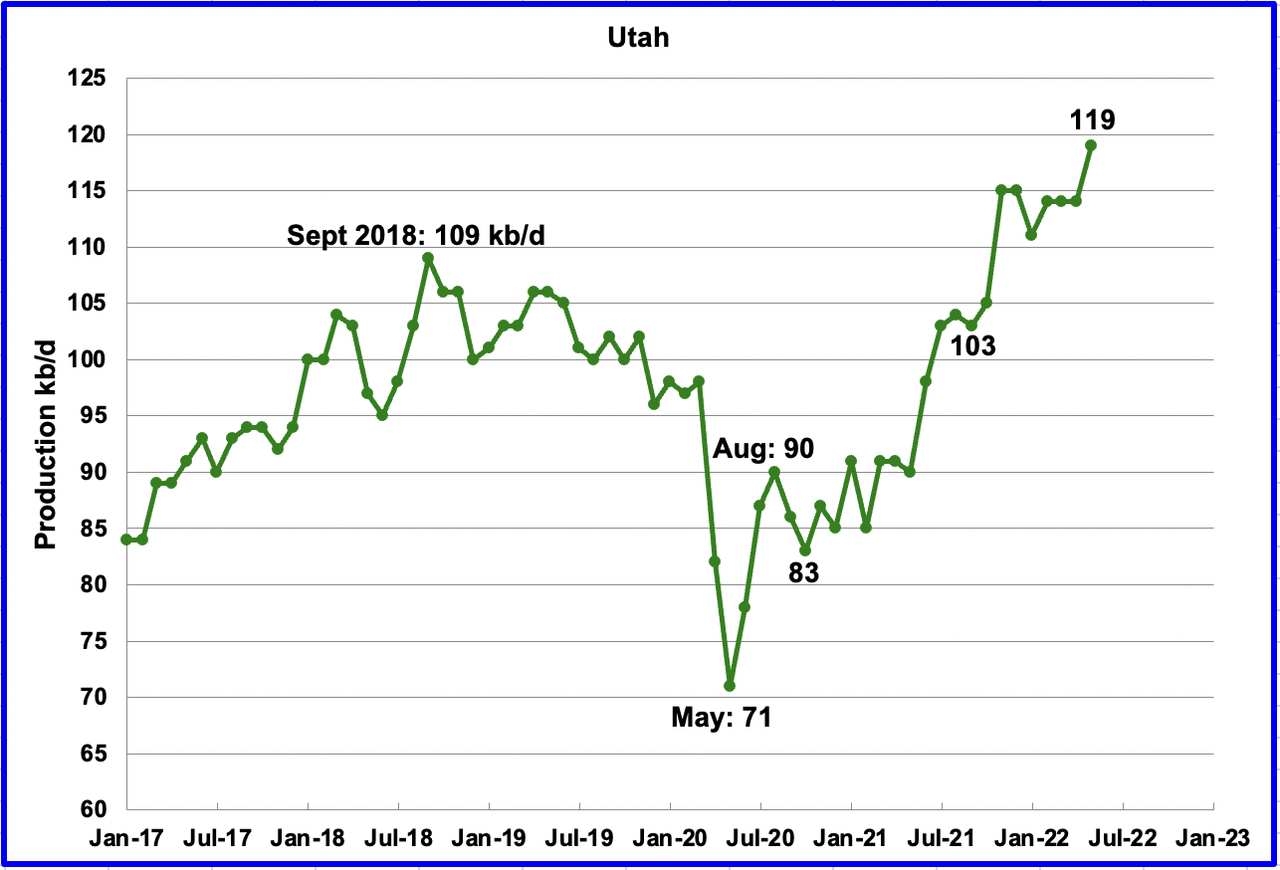
Utah’s production hit a new high in May. May’s production increased by 5 kb/d to 119 kb/d. Utah had 9 rigs operating in May, an increase of 4 over January.
EIA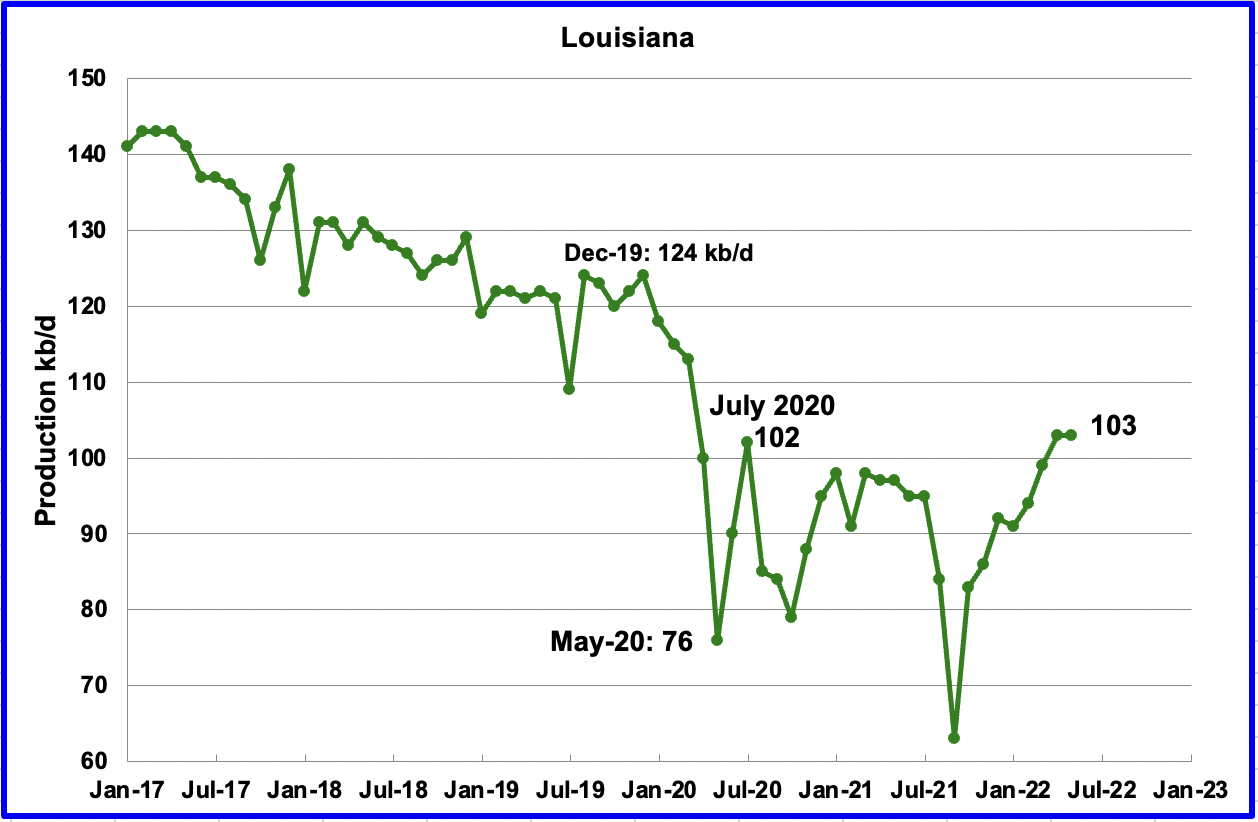
Louisiana’s output was unchanged in May at 103 kb/d.
EIA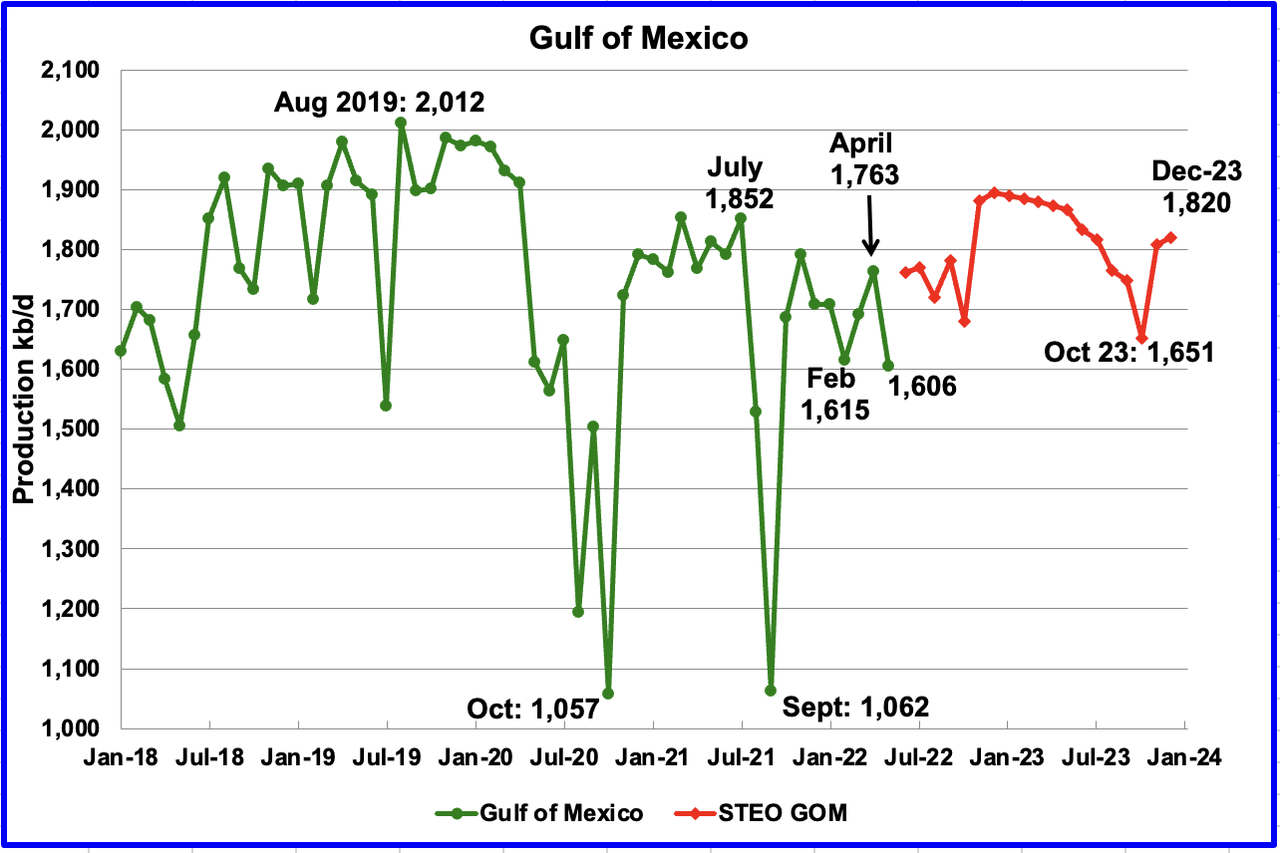
GOM production decreased by 157 kb/d to 1,606 kb/d in May due to weather. If the GOM was a state, its production would normally rank second behind Texas.
The July 2022 STEO projection for the GOM output has been added to this chart and projects output will be 1,820 kb/d in December 2023. For June 2022, the STEO is projecting a rebound of 155 kb/d to 1,761 kb/d.
A Different Perspective on US Oil Production
The Big Two states, combined oil output for Texas and New Mexico. (EIA) Oil production for The Rest (EIA)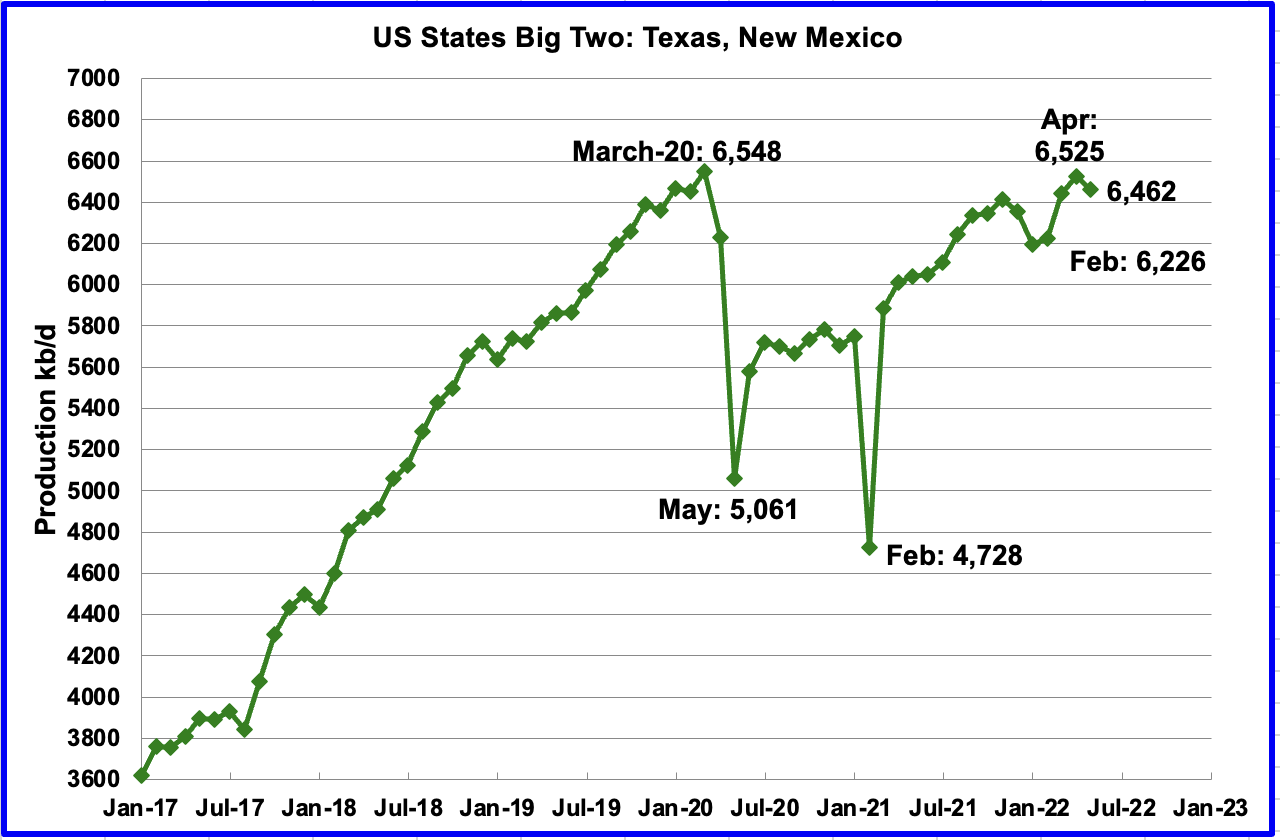
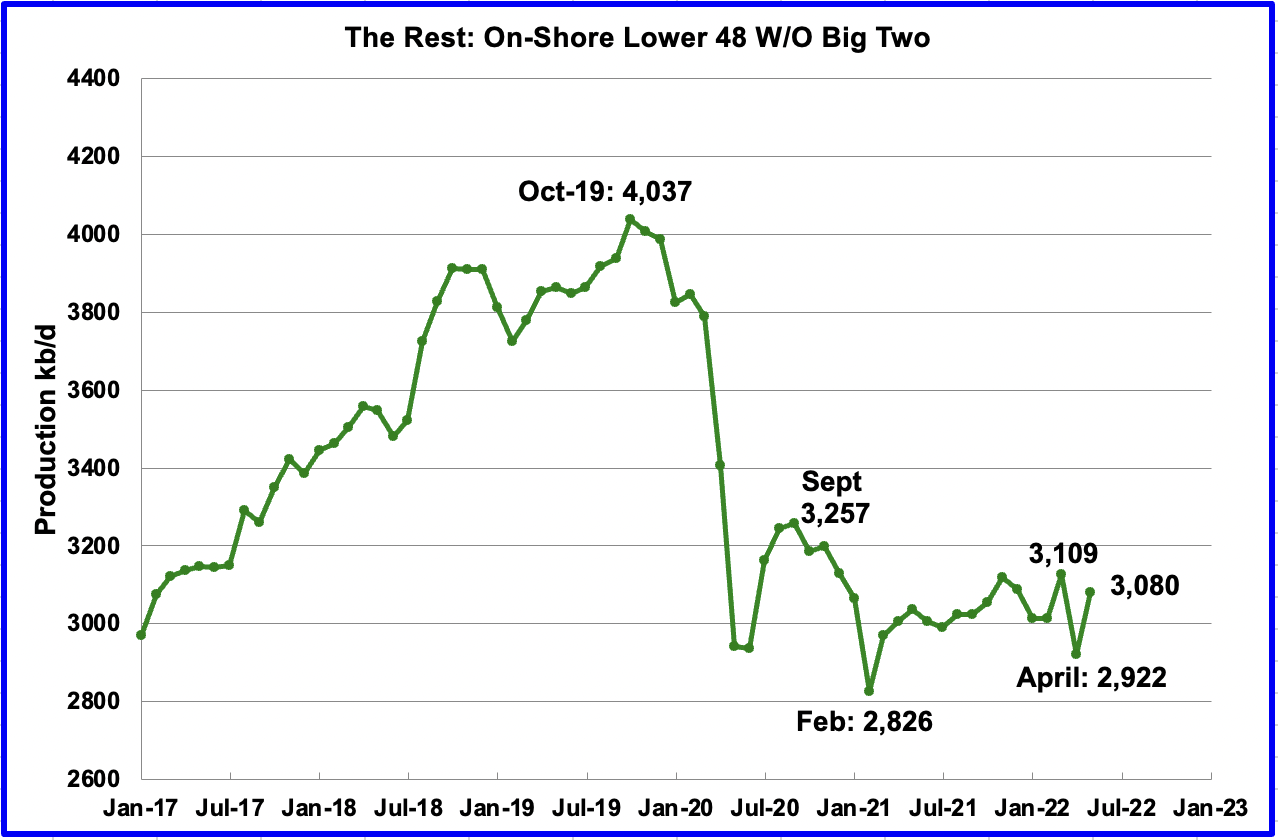
To get a different perspective on US oil production, the above two charts have segregated US state production into two groups, “The Big Two” and the “On-Shore L48 W/O Big Two” or The Rest.
May’s production dropped in the Big Two states by a combined 63 kb/d, with Texas dropping 52 kb/d and New Mexico dropping 11 kb/d.
Over the past year, production in The Rest appears to be holding steady at close to 3,100 kb/d.
Rigs and Frac Spreads
EIA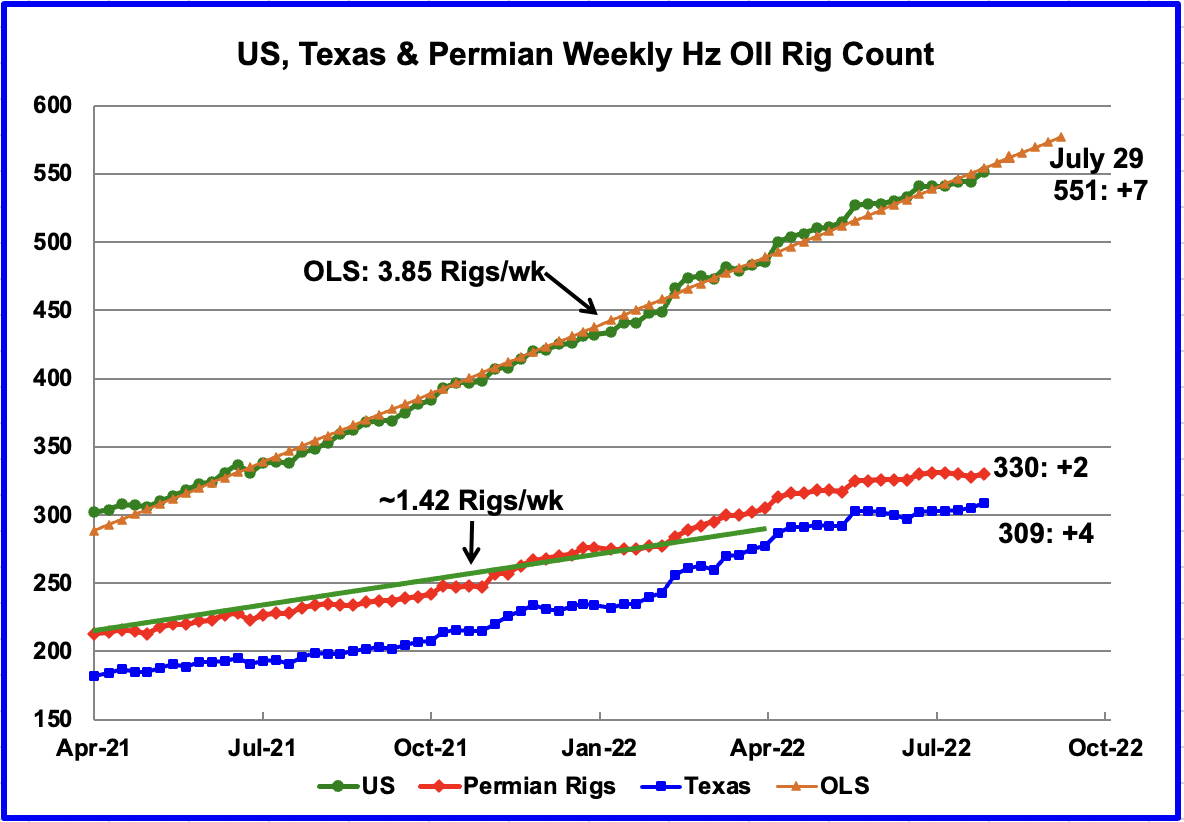
Since the beginning of April 2021 through to the week ending July 29, 2022, the US has been adding horizontal oil rigs at a rate of close to 3.85 rigs/wk, OLS line. From April 2021 to February 2022, 1.42 rigs/wk were added to the Permian. However, over the last 10 weeks, only 5 rigs have been added. This slowing of rig additions in the Permian relative to the whole U.S. indicates the increase in U.S. rigs is occurring in the smaller basins, see next table.
In the week ending July 29, there were 330 rigs operating in the Permian, an increase of 2 over the previous week. In Texas, 309 were operational, an increase of 4 over the previous week.
EIA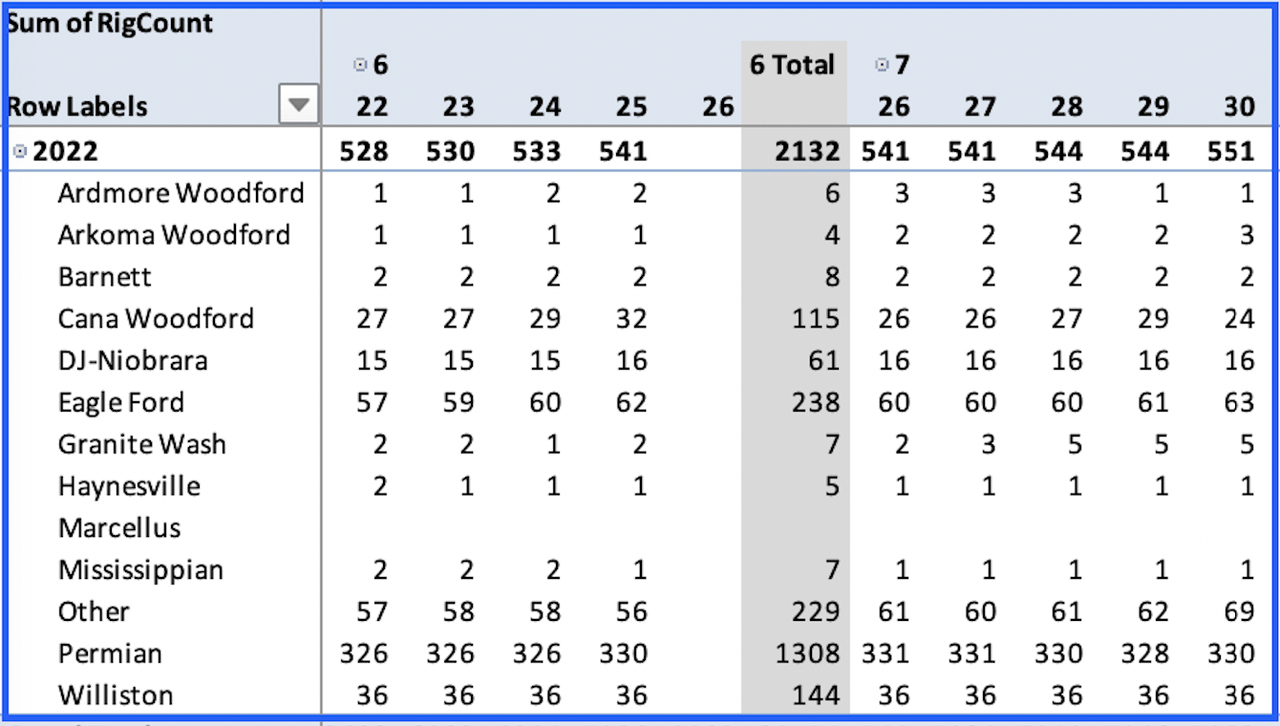
This table shows the horizontal rig count in the US basins starting from the beginning of June to the end of July. From the beginning of June to the end of July, a total of 23 (551 – 528) rigs were added in the U.S. Comparing the first column with the last, the biggest increase occurred in “Other” basins, 12. Over the same period, the Permian added 4 and Eagle Ford added 6, for a total of 22. Clearly 50% of the rigs are going to smaller lesser known basins/areas.
EIA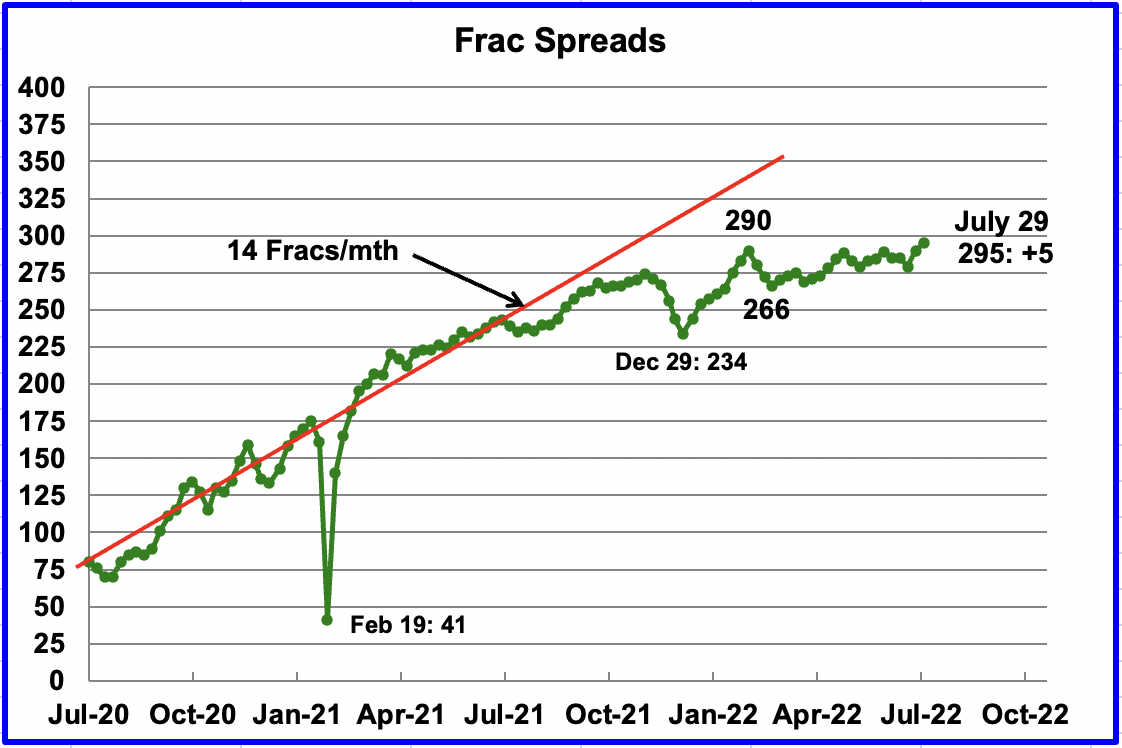
Over the last two weeks, completion activity has increased since 16 Frac spreads were added, while over the previous 5 to 6 weeks, there was no net change since additions and deletions were offsetting each other. In the week ending July 22, 11 were added while 5 were added in the current week ending July 29 for a total of 295.
Since early February, the growth in frac spreads has not been keeping pace with the growth in rigs. In the week ending July 29, 295 frac spreads were operating, 5 more than the 290 operating in the week ending February 25. Now that summer is here, the frac spread count may begin to increase provided the hurricane season does not impact plans/operations.
As noted in the Rig count table, only 4 rigs were added to the Permian from the beginning of June to the end of July. Would that imply that only a few, say 1 or 2, frac spreads were added in the Permian?
Note that these 295 frac spreads include both gas and oil spreads.
ShaleExperts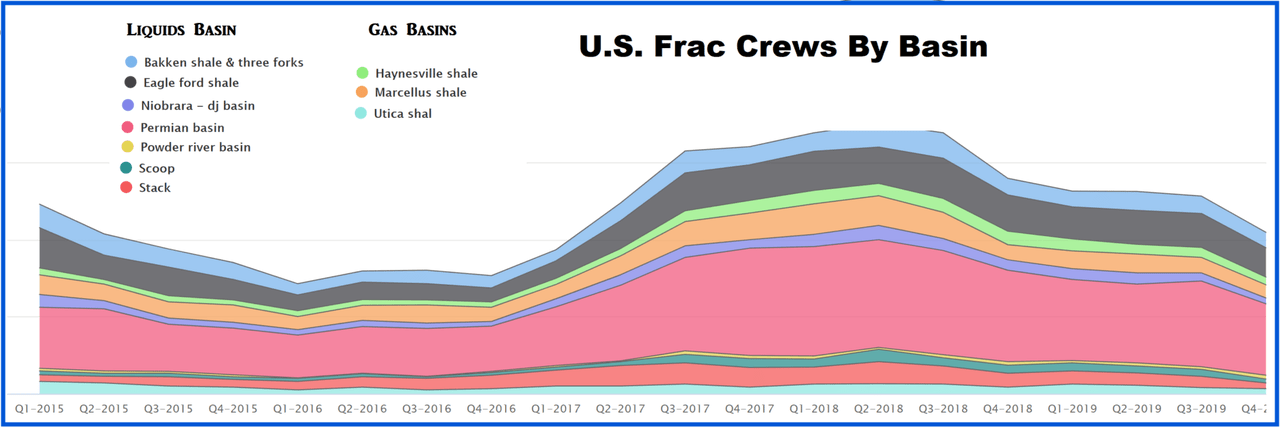
This is an old graphic taken from this source. Throughout the period Q1-16 to Q4-2019, the majority of Frac spreads, over 50%, were located in the Permian. Is it safe to assume the same is true today?
Assuming that 50% is a good estimate for the number of Frac crews in the Permian, that means that close to 148 are operating in the Permian. In the DPR section below, it shows that 436 DUCs were completed in the Permian in May. As a rough guide, this means one DUC crew can complete three DUCs per month.
1) Short-Term Energy Outlook
The July STEO provides projections for the next 20 months, starting with May 2022 to December 2023, for US C + C and other countries.
EIA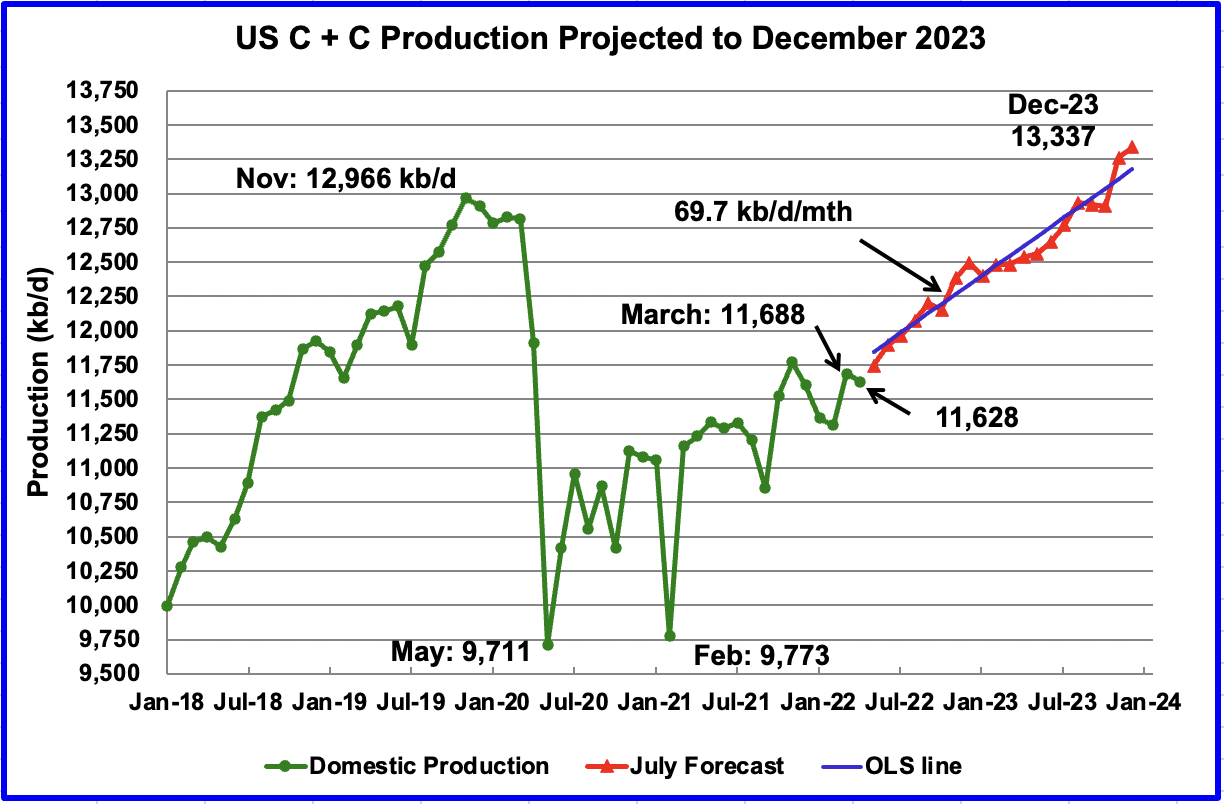
The July 2022 STEO revised down its projected US oil output from May 2022 to December 2023. In December 2023, output is expected to reach 13,337 kb/d, 107 kb/d lower than reported in the June report.
Using only the projected data from June 2022 to December 2023 to fit an OLS line, the STEO is forecasting production will increase at an average rate of 69.7 kb/d/mth, lower than the average rate of 83.8 kb/d/mth estimated in the June report. If the December 2023 output is achieved, it will be 71 kb/d higher than the November 2019 record. The monthly rate of 69.7 kb/d translates into a yearly increase of 836 kb/d.
EIA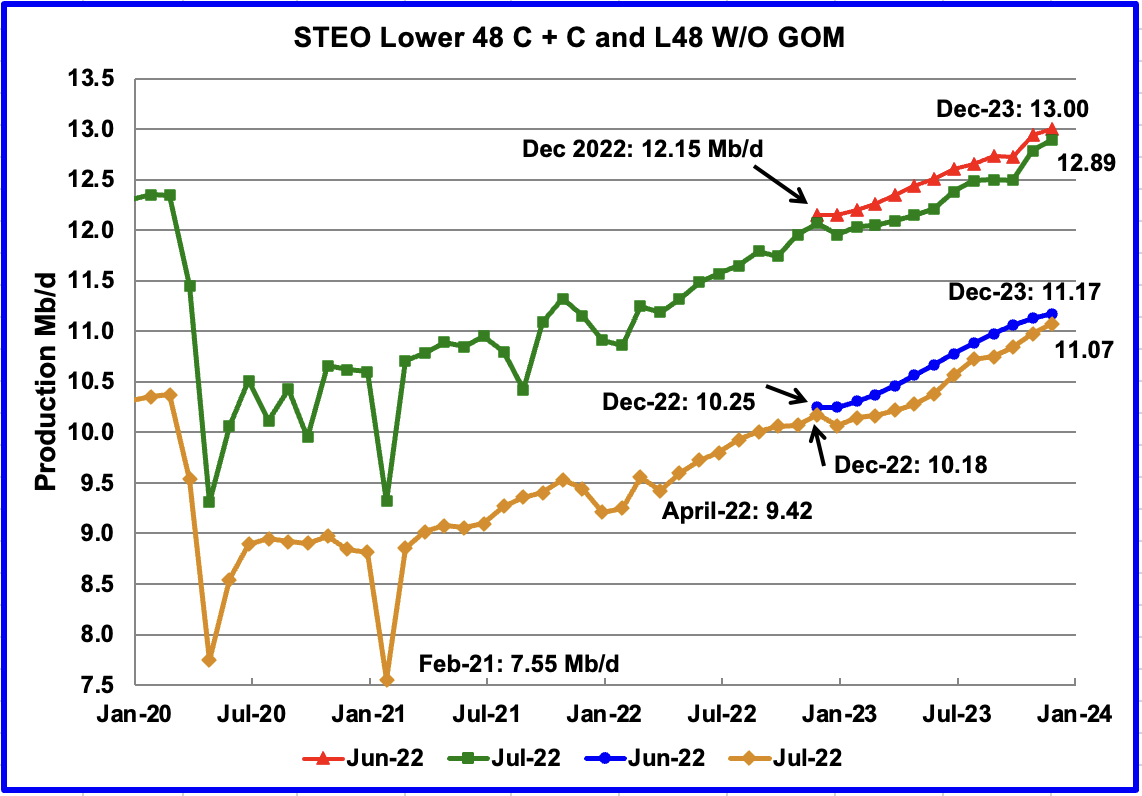
This chart compares the STEO forecast from the June report with the current July report to better illustrate how the output forecast for July 2022 changed. For the Lower 48, the December 2023 output has been revised down by 110 kb/d to 12.89 Mb/d.
The July output projection for the Onshore L48 states has also been revised down from the June forecast. For December 2023, output was lowered by 100 kb/d to 11.07 Mb/d.
EIA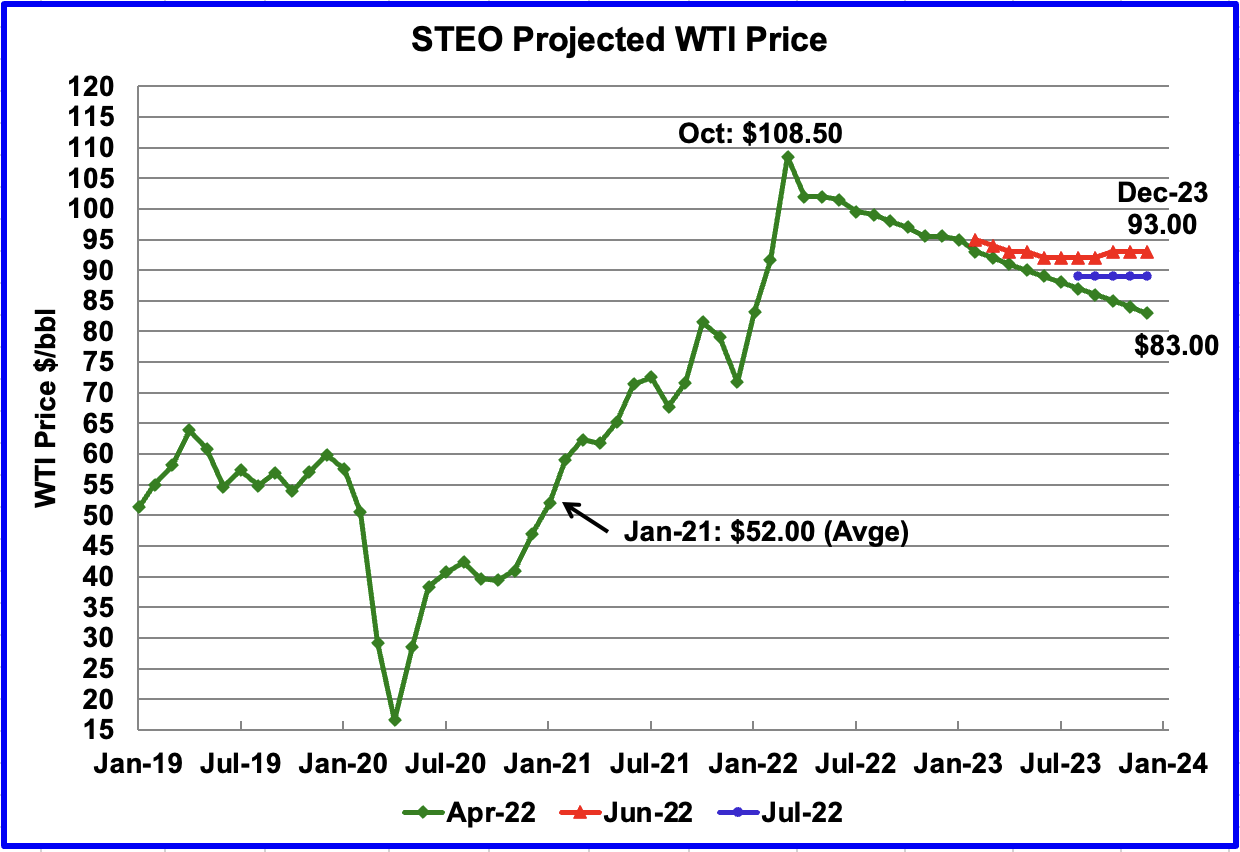
The July 2022 STEO oil price forecast continues to show a steady decline from the EIA’s March peak of $108.50/bbl to $89/bbl in December 2023, blue markers. Essentially the EIA is continuing to forecast that the only direction for the price of WTI going forward is down to the $90/b range. However, what is different with their latest forecast is that the price of oil stabilizes in the $90/b area during the latter half of 2023. The July forecast has been added to the chart to show how the STEO WTI forecasts from April to July have converged on a year-end WTI price in the $90/b range.
The September WTI contract settled at $98.62 on July 29, $0.62/b higher than the EIA’s forecast average price of $98.00/b for the September contract. An incredibly great projection.
EIA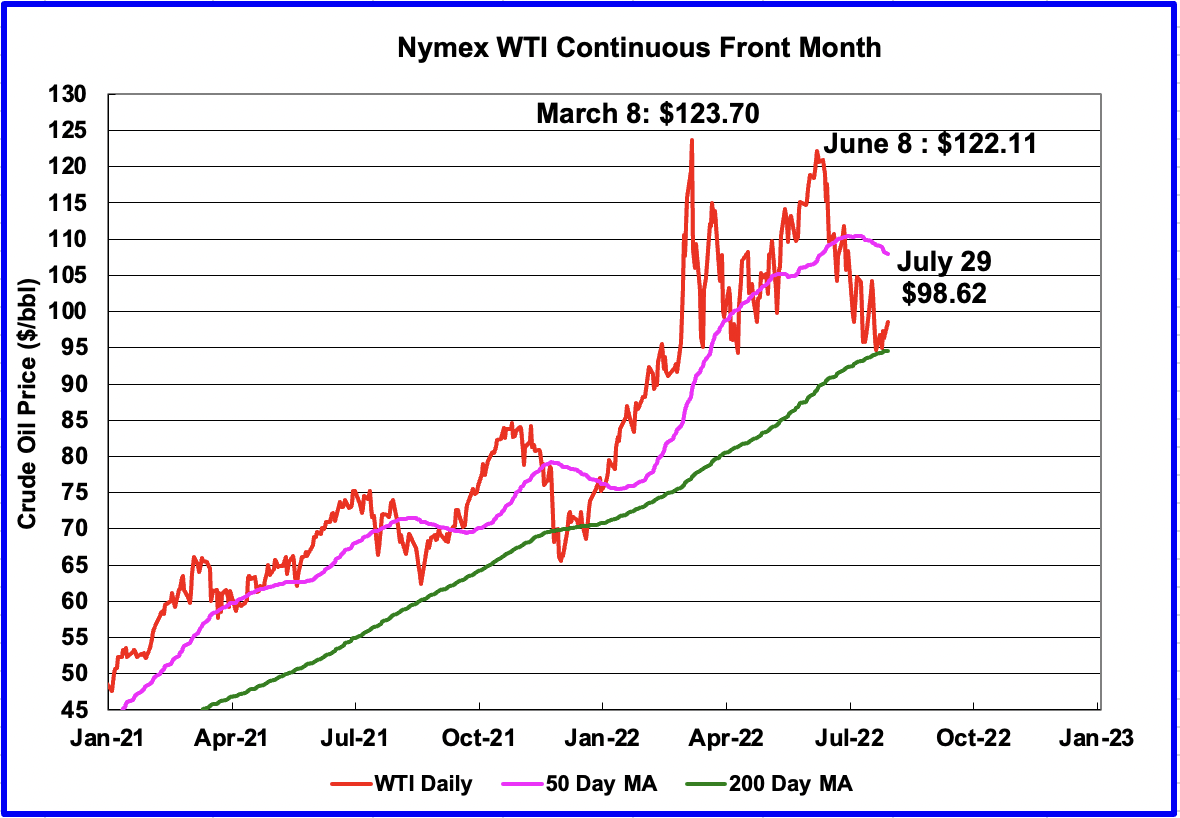
WTI on July 29 settled above the 200-day moving average after bouncing off it on July 22. It has now formed a triple bottom at $95/b along with bouncing off the 200-day moving average at $94/b. These are bullish indicators for WTI, over the near term, next three months.
EIA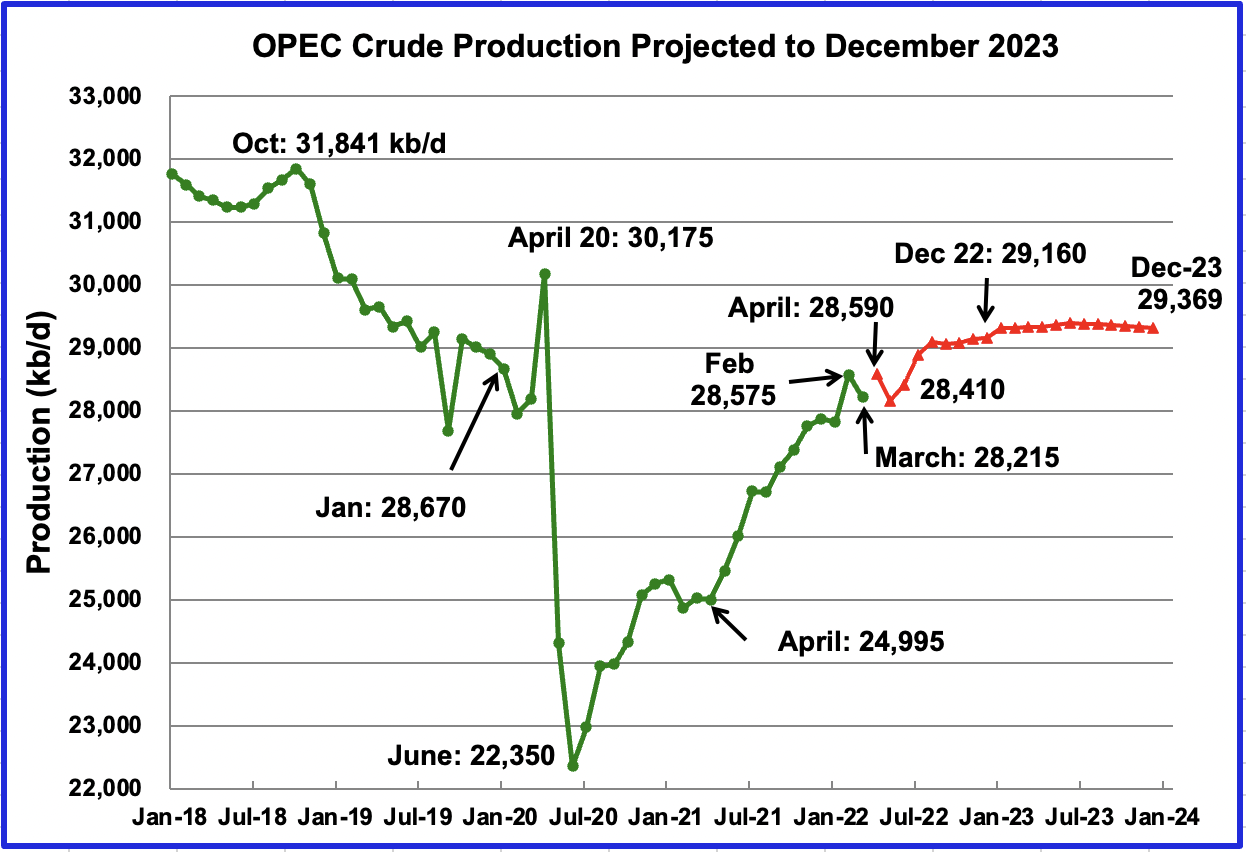
This chart shows the STEO’s July forecast for OPEC crude output from April 2022 to December 2023. OPEC’s output is projected to increase from April 2022 to December 2022 by 570 kb/d to 29,160 kb/d, which is 200 kb/d lower than in the June report. After December 2022, production remains essentially flat at close to 29,350 kb/d out to December 2023. The July OPEC report indicates that the call on OPEC in Q4-22 is 30.46 Mb/d, which is 1.31 Mb/d higher than the STEO is forecasting for December 2022, 29,160 kb/d.
EIA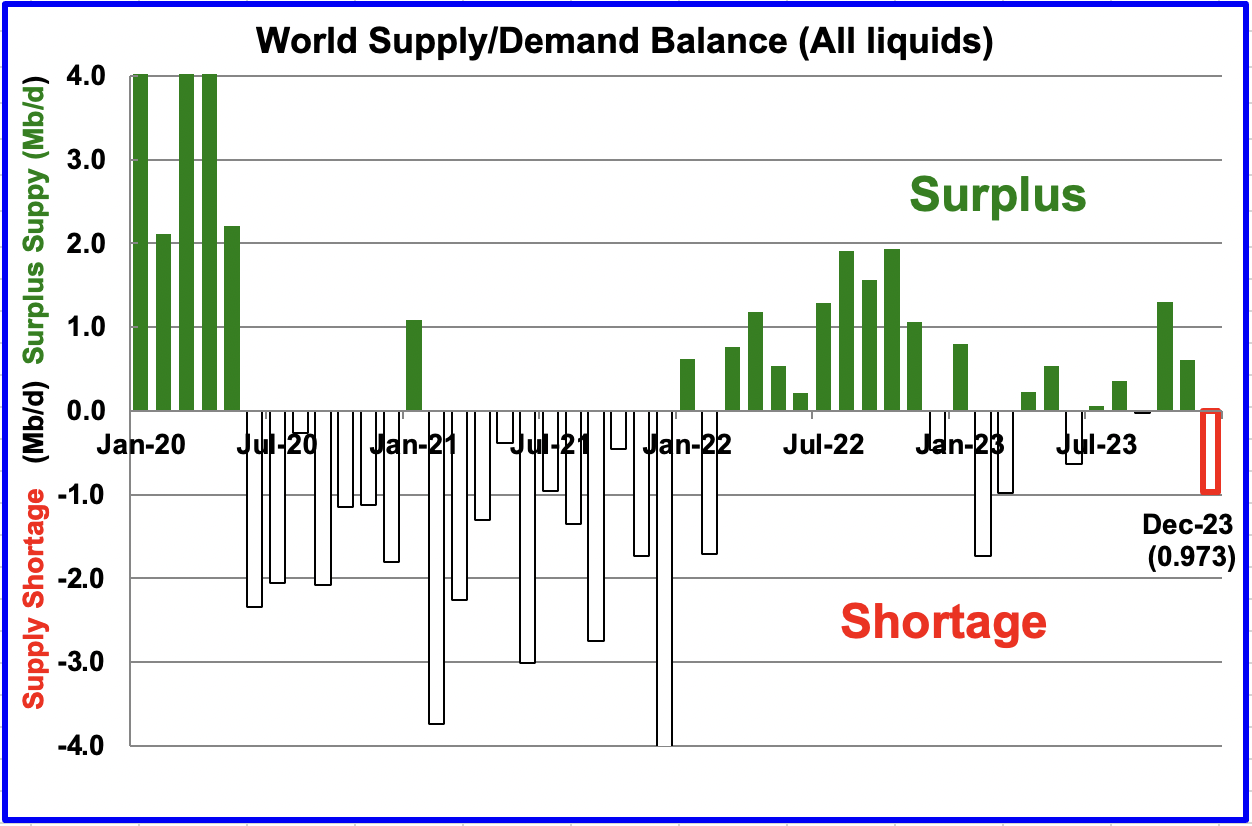
This chart shows the historical world supply/demand balance up to April 2022 and after that, the EIA’s forecast out to December 2023. The surplus of over 1,000 kb/d between August and December is inconsistent with the current tight market and expected increase in demand heading into winter.
2) Drilling Productivity Report
The Drilling Productivity Report (DPR) uses recent data on the total number of drilling rigs in operation along with estimates of drilling productivity and estimated changes in production from existing oil wells to provide estimated changes in oil production for the principal tight oil regions. The July DPR forecasts production to August 2022 and the following charts are updated to August 2022.
EIA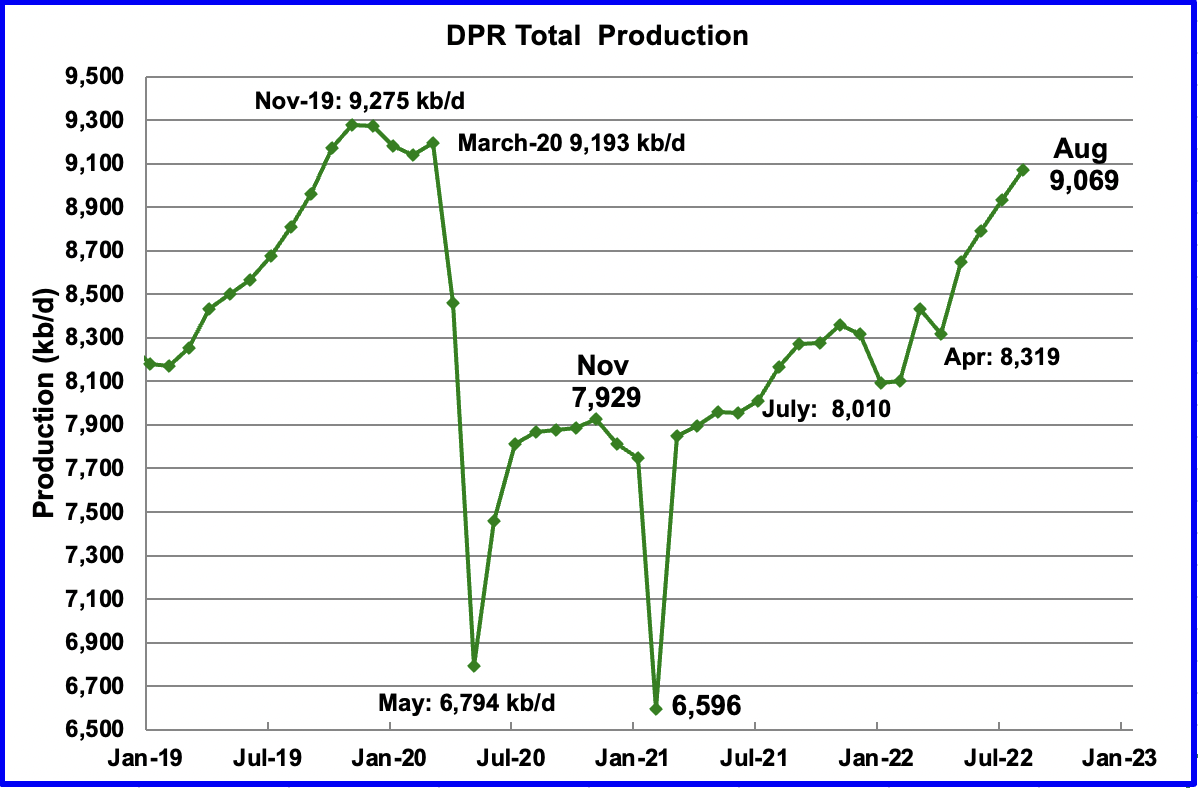
Above is the total oil production projected to August 2022 for the 7 DPR basins that the EIA tracks. Note that DPR production includes both LTO oil and oil from conventional wells.
The DPR is projecting oil output for August 2022 will increase by 138 kb/d to 9,069 kb/d. Note that the chart now shows the April decline that occurred in the Bakken. From January’s output of 8,093 kb/d to August 2022, output in the DPR basins is forecast to increase by 976 kb/d or by an average of 139.4 kb/d/mth. Note that this monthly production rate is much higher than the STEO rate of 83.8 kb/d projected in the STEO section above.
EIA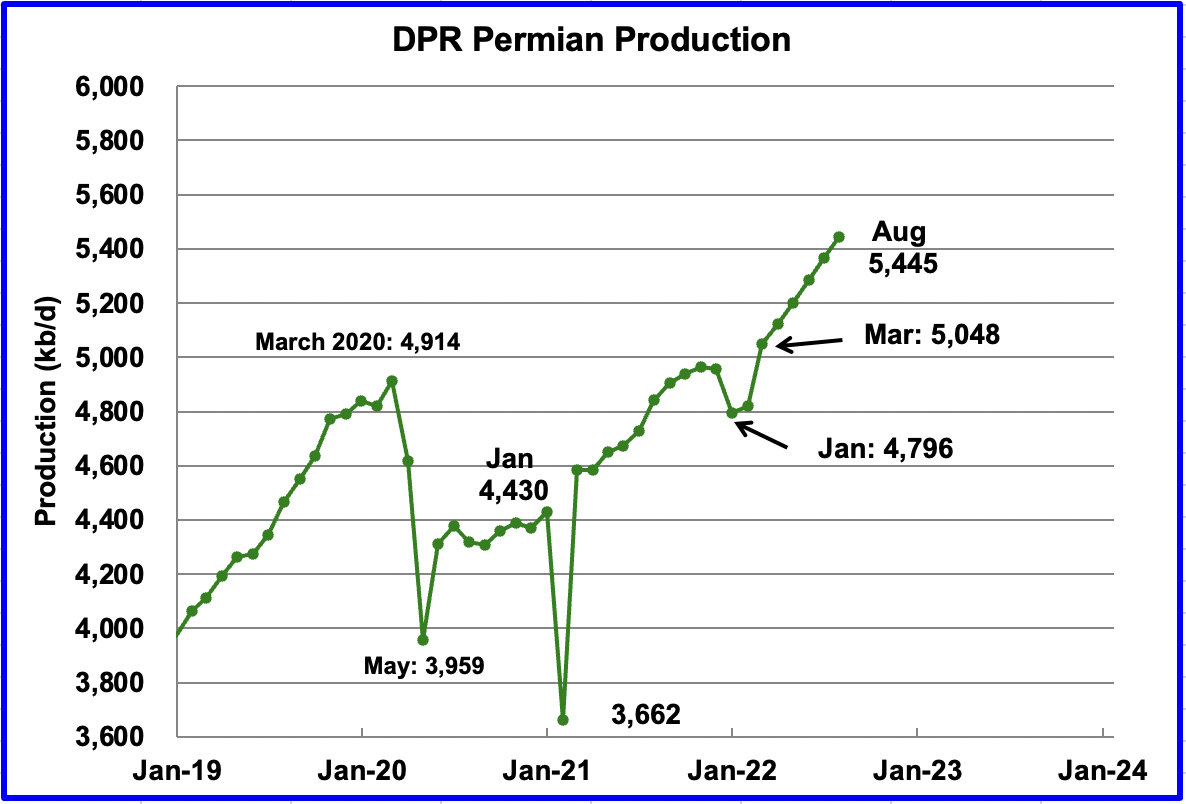
Permian output exceeded 5,000 kb/d in April 2022 and continues to increase. August production is expected to increase by 78 kb/d to a new high of 5,445 kb/d. From March to August, production is forecast to increase by 397 kb/d or at an average rate of 79.4 kb/d/mth. If the Permian were part of OPEC, at 5,445 kb/d it would be the second-largest producer after Saudi Arabia.
During June, 408 wells were drilled and 438 were completed in the Permian. The completed wells added 373 kb/d to June’s output for an average of 852 kb/d/well. The overall decline was 288 kb/d, which resulted in a net increase for Permian output of 85 kb/d. The completion of 30 extra DUCs over the drilled wells contributed 25.6 kb/d of the 85 kb/d increase.
EIA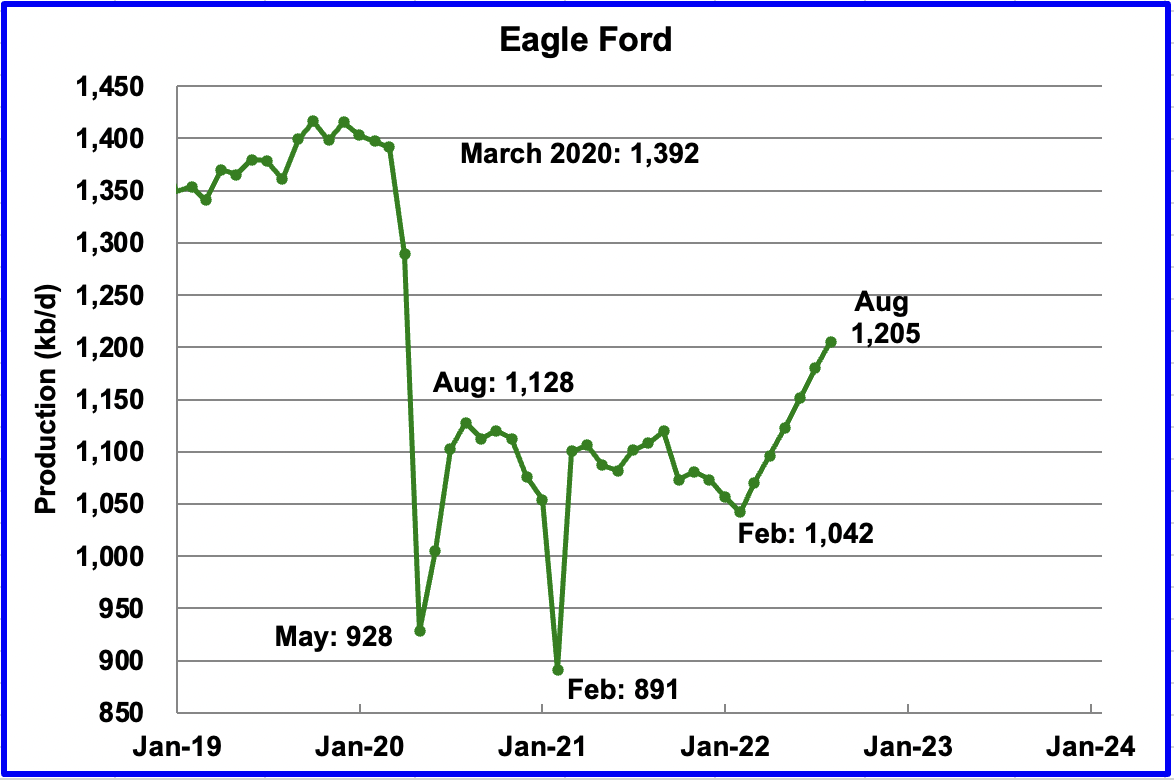
Output in the Eagle Ford basin has been showing an increasing trend since March 2022. For August, output is expected to increase by 25 kb/d to 1,205 kb/d.
EIA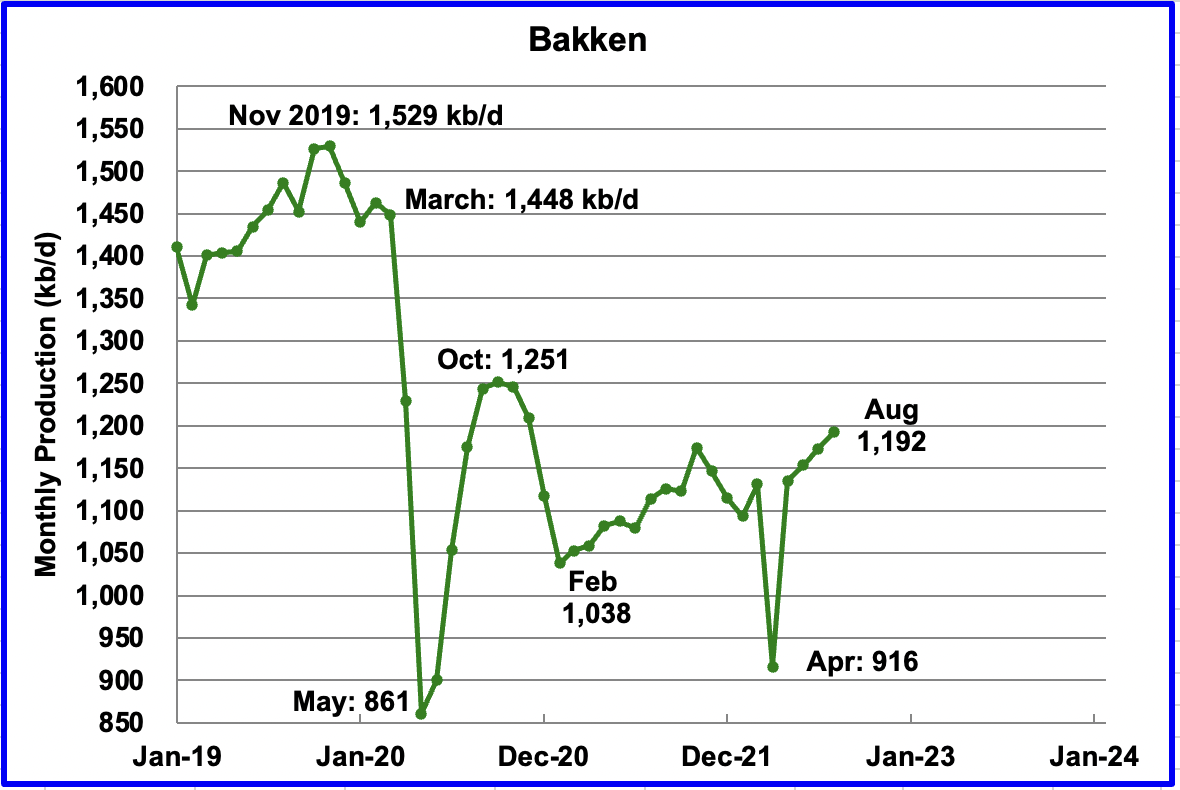
The DPR forecasts Bakken output in August to be 1,192 kb/d, an increase of 19 kb/d from July. The April drop reflects the severe winter weather in April. According to the ND Department of Mineral Resources, Bakken production rebounded in May to 1,018 kb/d, which is much lower than shown in the DPR Bakken chart.
EIA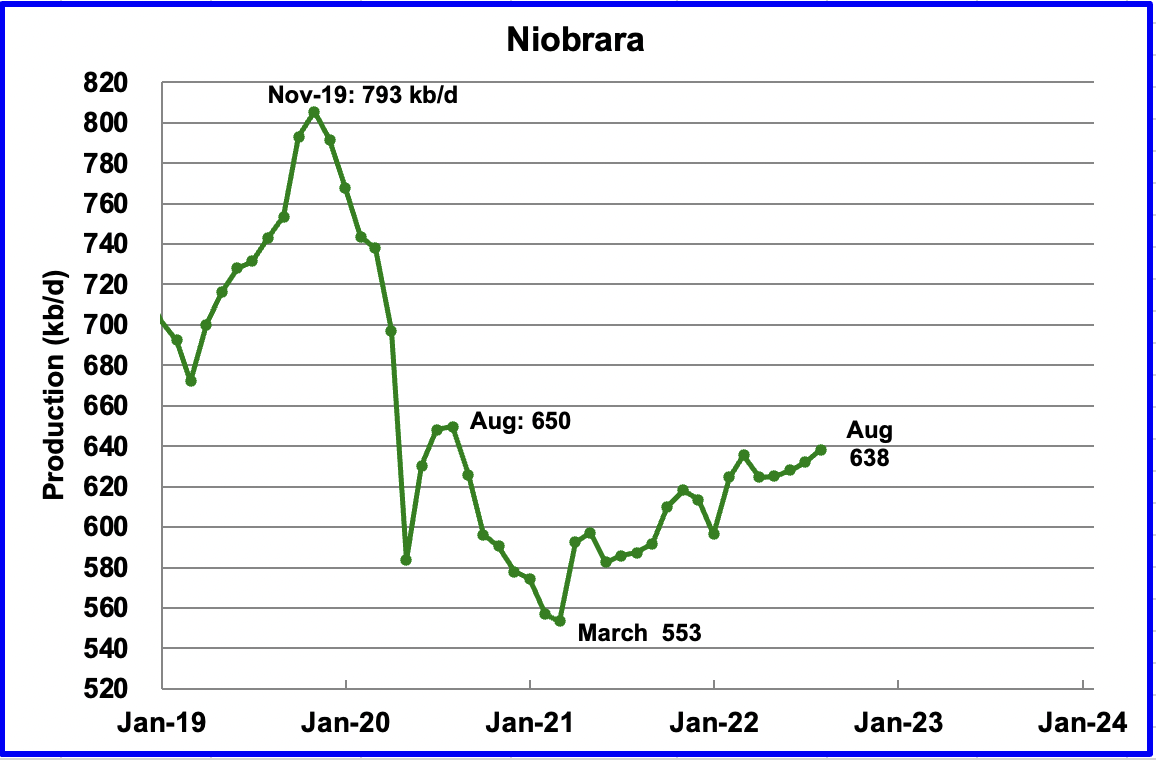
Output in the Niobrara is growing slowly. August output increased by 6 kb/d to 638 kb/d.
DUCs and Drilled Wells
EIA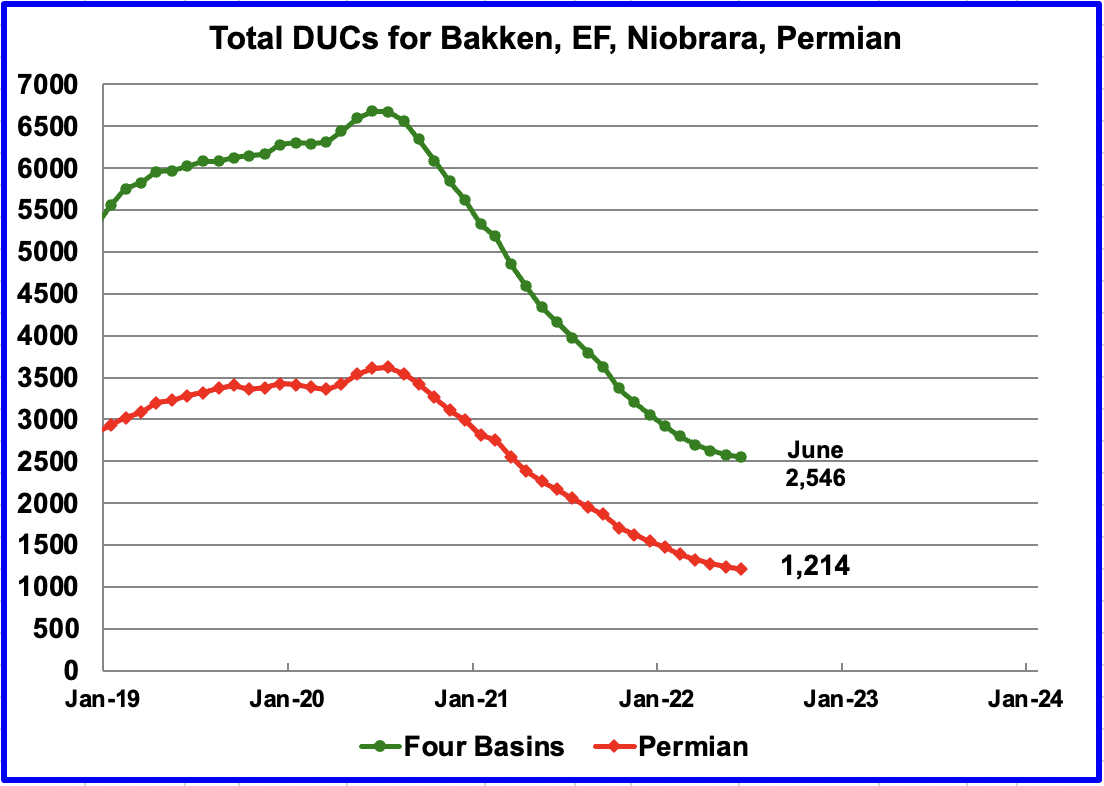
The number of DUCs available for completion in the Permian and the four major DPR oil basins has continued to fall every month since July 2020. Prior to July, more wells were drilled than were completed. Also note how the monthly use of DUCs is slowing and stabilizing at a lower level .
EIA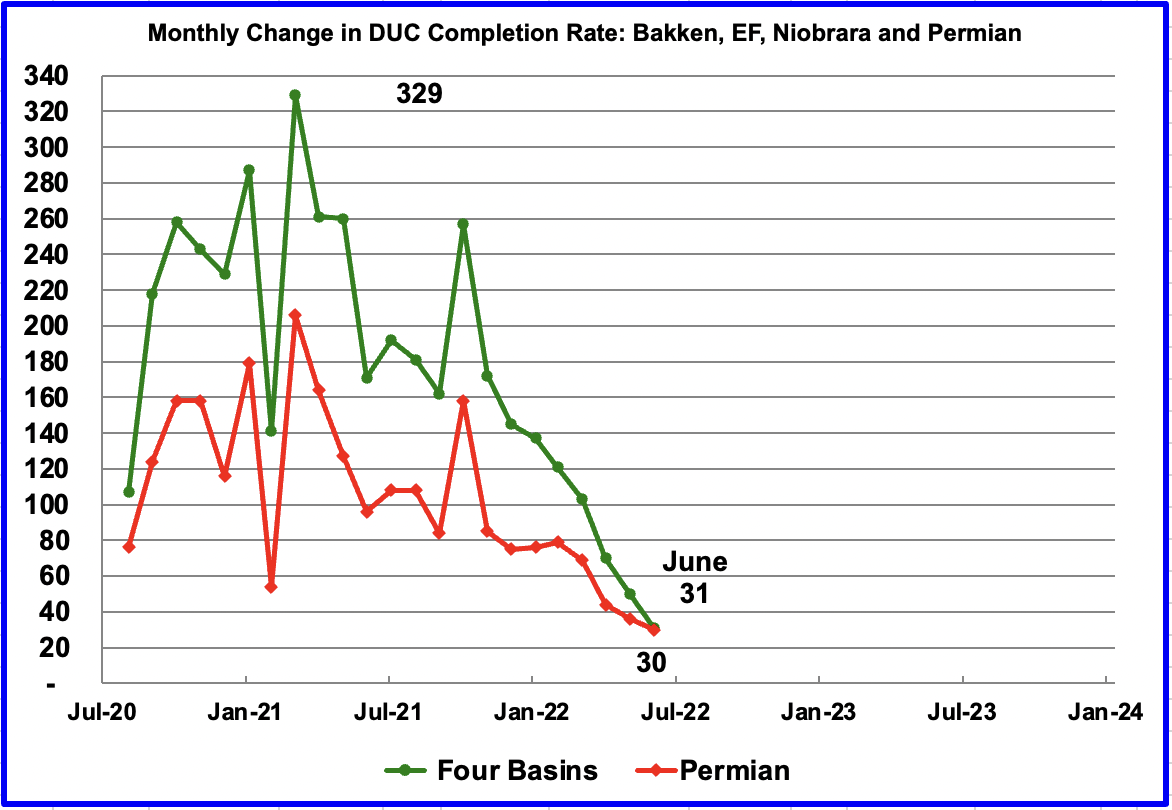
In these four primarily oil basins, the change in the monthly completion rate of DUCs started to slow after peaking in March 2021 at 329. In June 2022, 31 fewer DUCs were completed, 2577 vs. 2546, than in the previous month, see previous chart. Similarly the change in monthly completion rate for DUCs in the Permian slowed. It dropped from 36 in May to 30 in June, 1,244 vs. 1,214, see previous chart.
This chart shows that the number of completions of DUCs has stabilized in the Bakken, Eagle Ford and Niobrara basins while they continue to drop in the Permian since 30 of 31 fewer completed DUCs came from the Permian.
EIA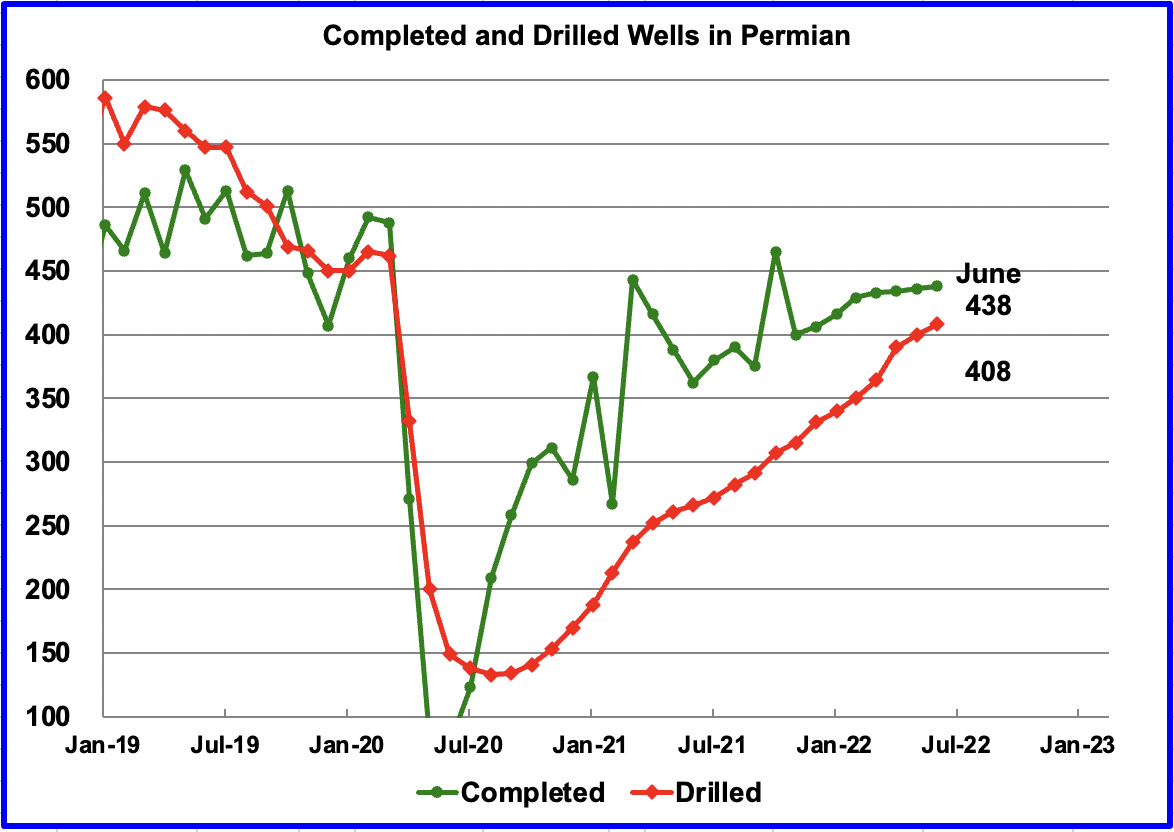
In the Permian, the monthly completion rate of wells has been showing signs of slowing since March. In June, 438 wells were completed, 2 more than in May. During June, 408 new wells were drilled, an increase of 8 over May. To counteract the lowering use of DUCs, drilling has been increased.
Editor’s Note: The summary bullets for this article were chosen by Seeking Alpha editors.
Be the first to comment