

Konoplytska
If August 2022’s trade between the U.S. and China was defined by much stronger-than-expected exports flowing from the U.S. to China, September 2022’s trade data is just as definable. Except in a negative sense, because U.S. imports of goods from China plummeted during the month.
It’s still positive when measured year-over-year, but the growth rate of U.S. imports from China dropped to the low single digits from the double-digit levels recorded in each month from December 2021 through August 2022. The following chart tracking the growth rate of U.S. exports to China and imports from China since January 1986 shows that sudden change.
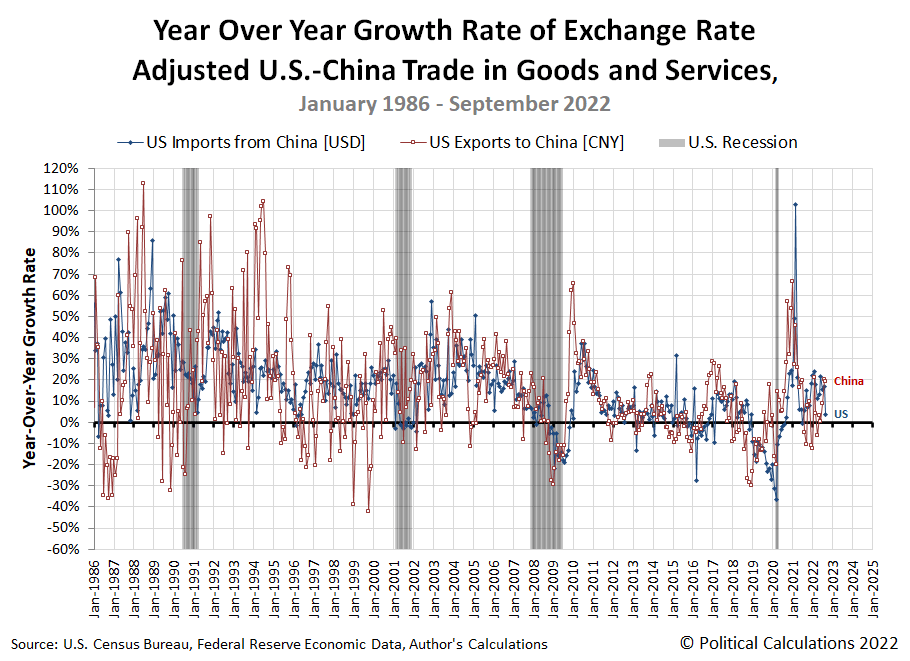
This change follows the cancellation of billions of dollars in orders in recent months by major U.S. retailers, who have also cancelled or delayed plans to build warehouses to accommodate goods, many of which would have been imported from China.
The change also means that instead of following the seasonal pattern of September’s total trade volume increasing above August’s level, the combined value of goods traded between the U.S. and China fell month over month. That development can be seen in the next chart.
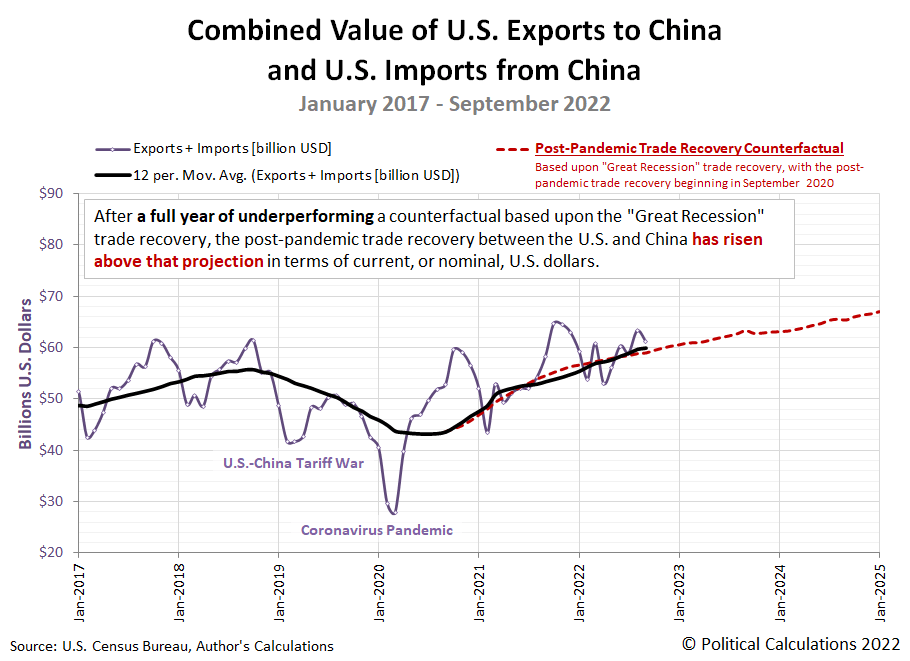
Typically, the combined value of goods traded between the U.S. and China rises from August through October each year, peaking in October. 2022 is breaking that pattern, suggesting the relative health of the U.S. economy is declining going into the fourth quarter of the year.
Reference
U.S. Census Bureau. Trade in Goods with China. Last updated: 3 November 2022.
Editor’s Note: The summary bullets for this article were chosen by Seeking Alpha editors.
Be the first to comment