

U.S. DOLLAR ANALYSIS
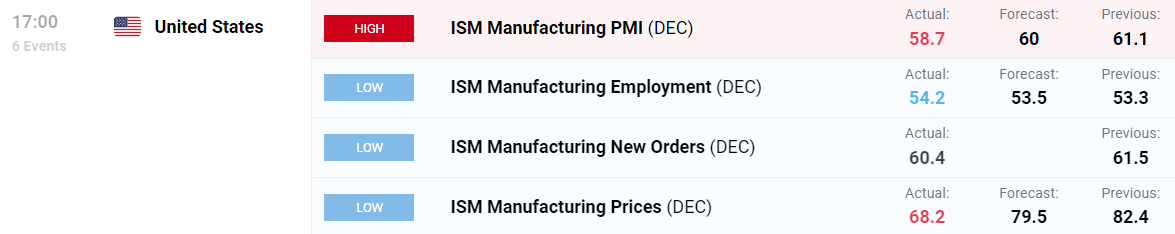
- ISM (DEC) – ACT:58.7;EST:60.1.
- Market unphased by Omicron.
- Bull flag pattern remains.
ISM PMI FALLS BUT POSITIVES SEEN IN OTHER METRICS
The ISM manufacturing PMI data release for December came in below expectations (58.7) resulting in initial dollar weakness however, better than expected employment figures may favor the hawkish rhetoric currently flooding the market. Inflation on the other hand could be waning and the Fed’s fierce stance on curbing inflation may be untimely. As a rule of thumb, a print above 50 reflects and expanding manufacturing sector and vice versa which leaves the U.S. manufacturing sector in solid footing. All eyes turn to Non-farm payrolls (NFP) later this week for further guidance.
ISM MANUFACTURING PMI (DEC):
Source: DailyFX economic calendar
DOLLAR FUNDAMENTAL BACKDROP
POSITIVE START TO 2022 FOR THE U.S. DOLLAR
Yesterday, the IHS Markit PMI data was released for the U.S. and came in roughly in line with expectations (see calendar below).
MARKIT MANUFACTURING PMI (DEC):

Source: DailyFX economic calendar
Despite the slight undershoot, the dollar rallied on the back of higher U.S. Treasury yields due to increased Fed rate hike expectations. The first rate hike since 2018 is currently projected in March of this year according to the Fed’s implied rates below. U.S. 10-year Treasury yields have extended their upside surge today giving further impetus to the greenback. Outlook for 2022 is likely to see yields push towards the 2% mark which could see a strong here for the DXY. Rate hike timing and communication will also be key to avoid market shocks because of the frequency expected due to rising inflationary pressures.
FED INTEREST RATE PROBABILITIES:
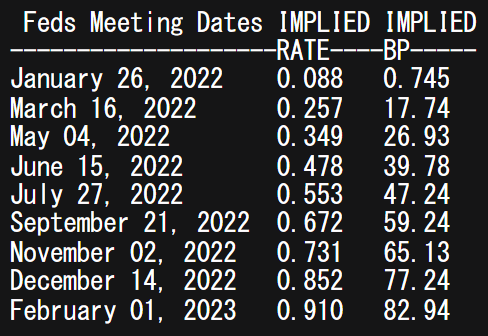
Source: Refinitiv
Concerns around the Omicron variant are being shelved by financial markets in expectation that there will be minimal economic impact from this strain of COVID-19.
TECHNICAL ANALYSIS
U.S. DOLLAR INDEX DAILY CHART
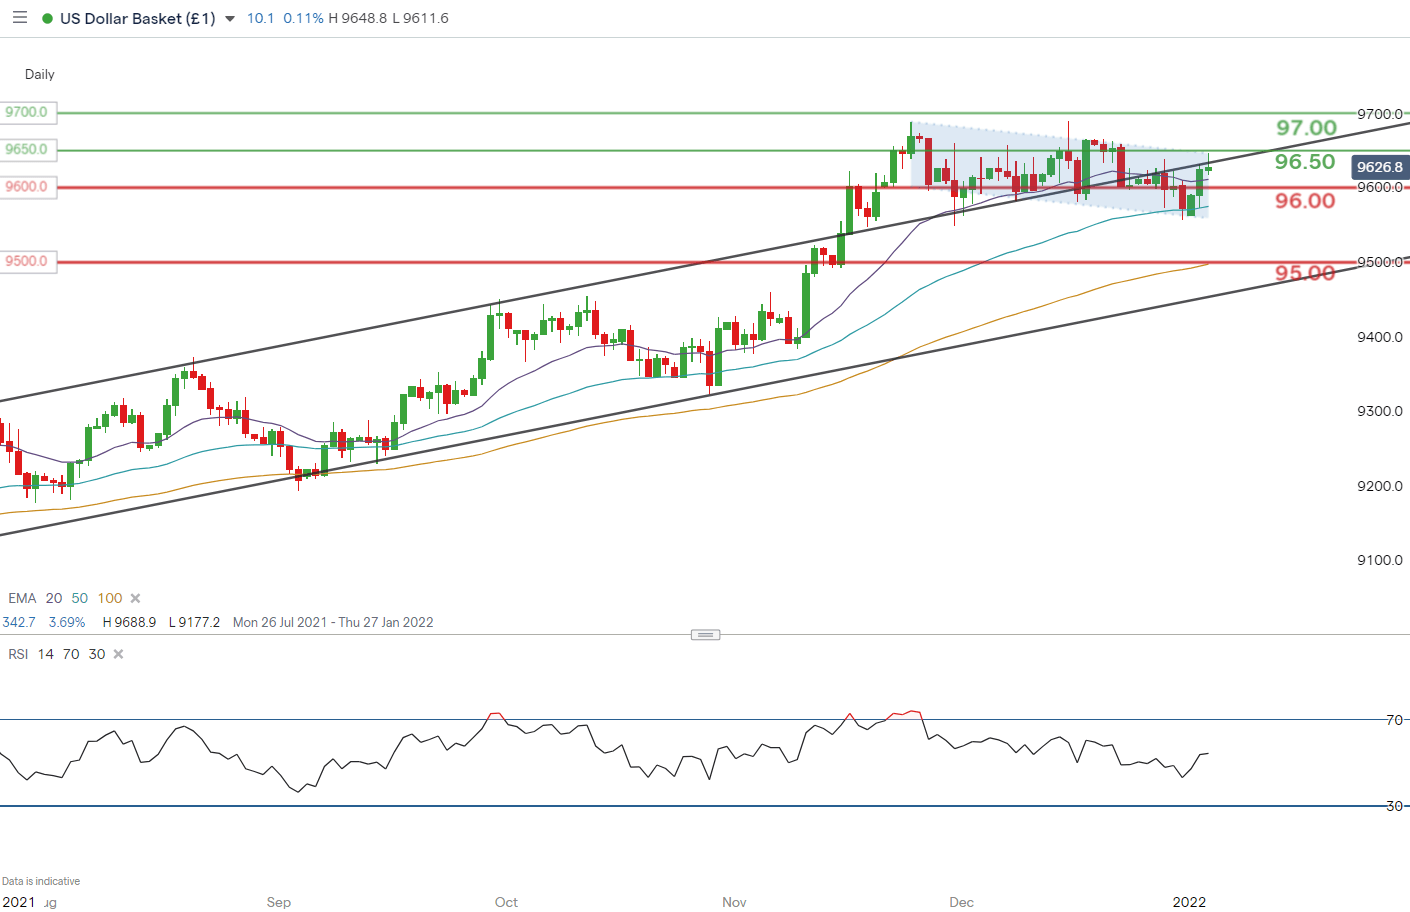
Chart prepared by Warren Venketas, IG
Since the bullish breakout from the medium-term channel (black), the DXY has consolidated in the form of a bull flag pattern (blue). Price action has held within this band since late November but may push higher should we see a daily candle close above flag resistance. This would then bring into focus the 97.00 psychological handle once more. Long-term, the U.S. dollar outlook remains firmly bullish in the current fundamental backdrop.
Resistance levels:
Support levels:
Contact and follow Warren on Twitter: @WVenketas
Be the first to comment