

cagkansayin
I bought my first real estate property in the early 1980s when mortgage rates were in double-digit territory. I do not remember the exact fixed rate on the thirty-year conventional mortgage, but it was above the 12% level. At the time I remember thinking how fortunate my dad was when he bought our family home in Brooklyn, New York, and benefited from his service with a VA 4.25% loan. I thought I would never have an opportunity like my father, but I was wrong.
My current home, purchased in 2017, came with a 4.25% fixed-rate mortgage. In late 2021, I refinanced the loan to 2.95%. At below 3%, it felt like the banks were giving away free money, and they were. Six months after signing the refinance documents, the rate doubled to 6%. As of Friday, July 22, it stood at just under 6%, double the rate I locked in late 2021.
Meanwhile, the US 30-Year Treasury bond futures have been declining steadily over the past years. While the US central bank determines the short-term Fed Funds Rate via its monetary policy path, market forces are responsible for rates further out along the yield curve. Inflation at the highest level in over four decades has been a bearish factor for the US 30-Year government bonds.
The ProShares UltraPro Short 20+ Year Treasury ETF (NYSEARCA:TTT) product is a leveraged instrument that moves higher when the back end of the yield curve rises on a short-term basis.
The long-bond futures have trended lower
Since spiking higher in March 2020 as the global pandemic gripped markets across all asset classes, the US Treasury bond futures have been trending lower.
Three-Year Chart of the 30-Year US Treasury Bond Futures (Barchart)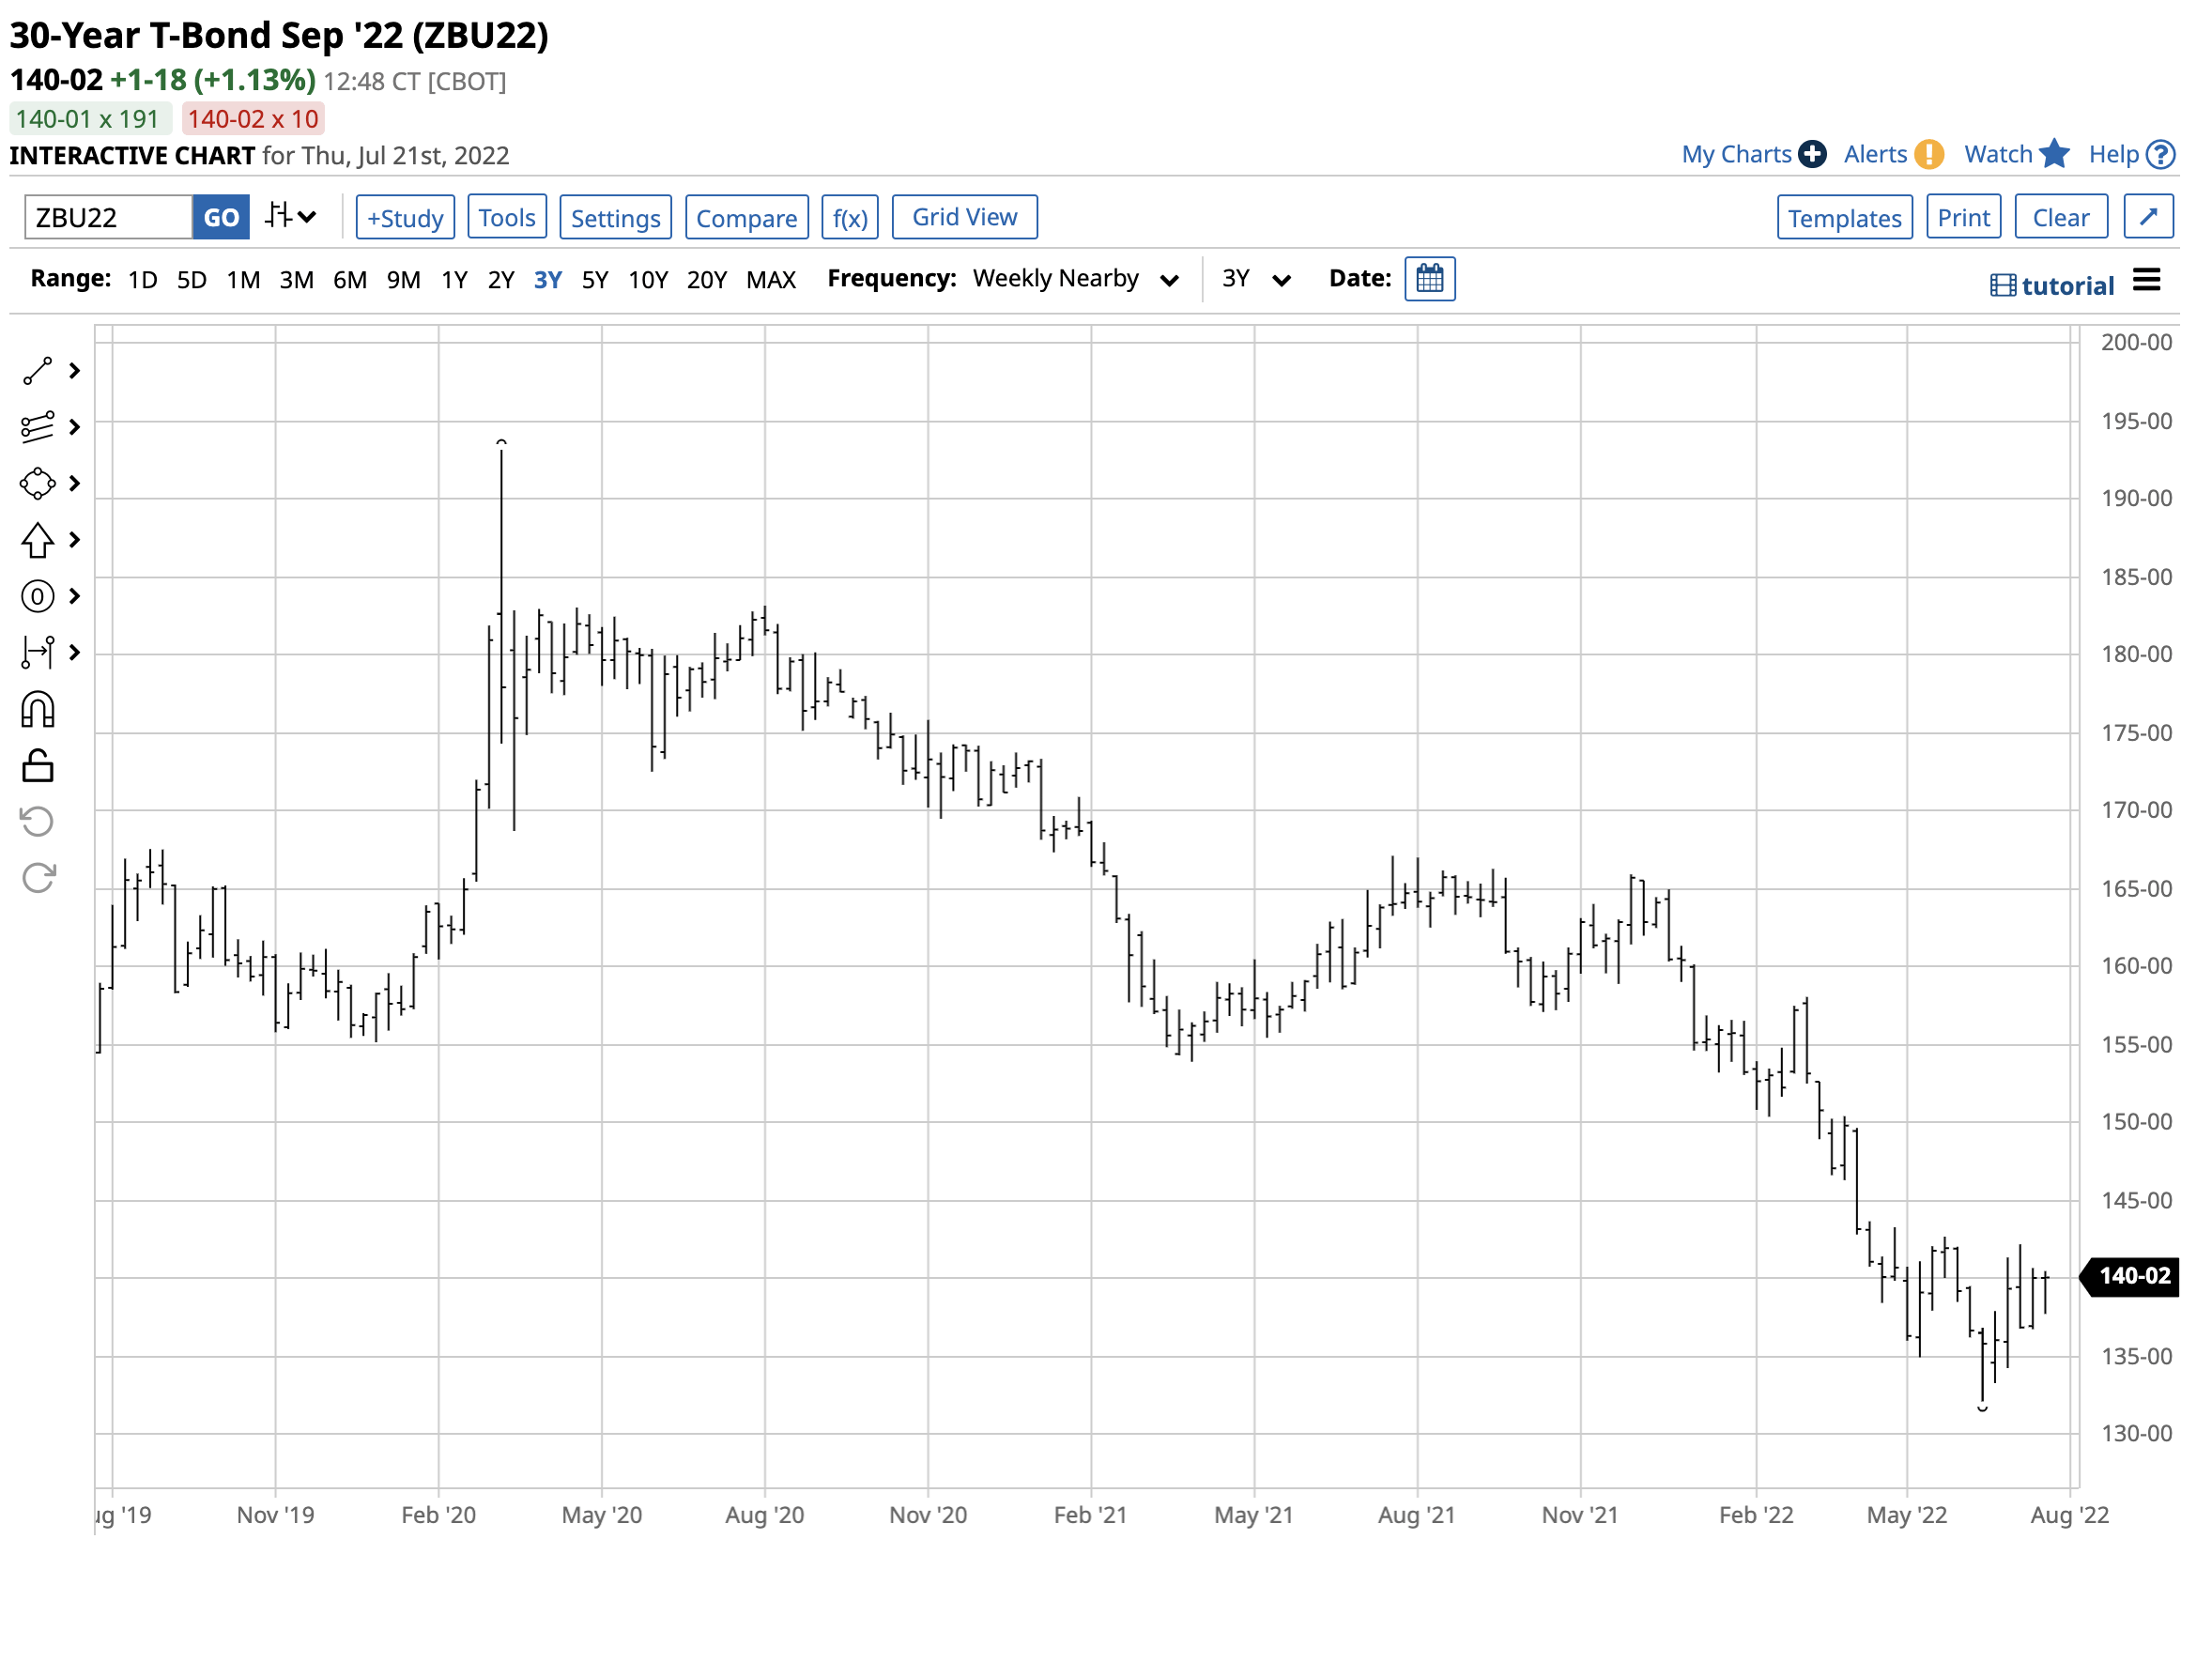
The chart shows the pattern of lower highs and lower lows in the US long bond futures market. While the US Federal Reserve controls short-term interest rates via the Fed Funds Rate, the rates further out along the yield curve are a function of free market dynamics. The bonds rise when buyers are more aggressive than sellers and fall when selling dominates buying. Since early 2020, sellers have been the most influential factor in the bond market.
Ten-Year Chart of the US 30-Year Treasury Bond Futures (Barchart)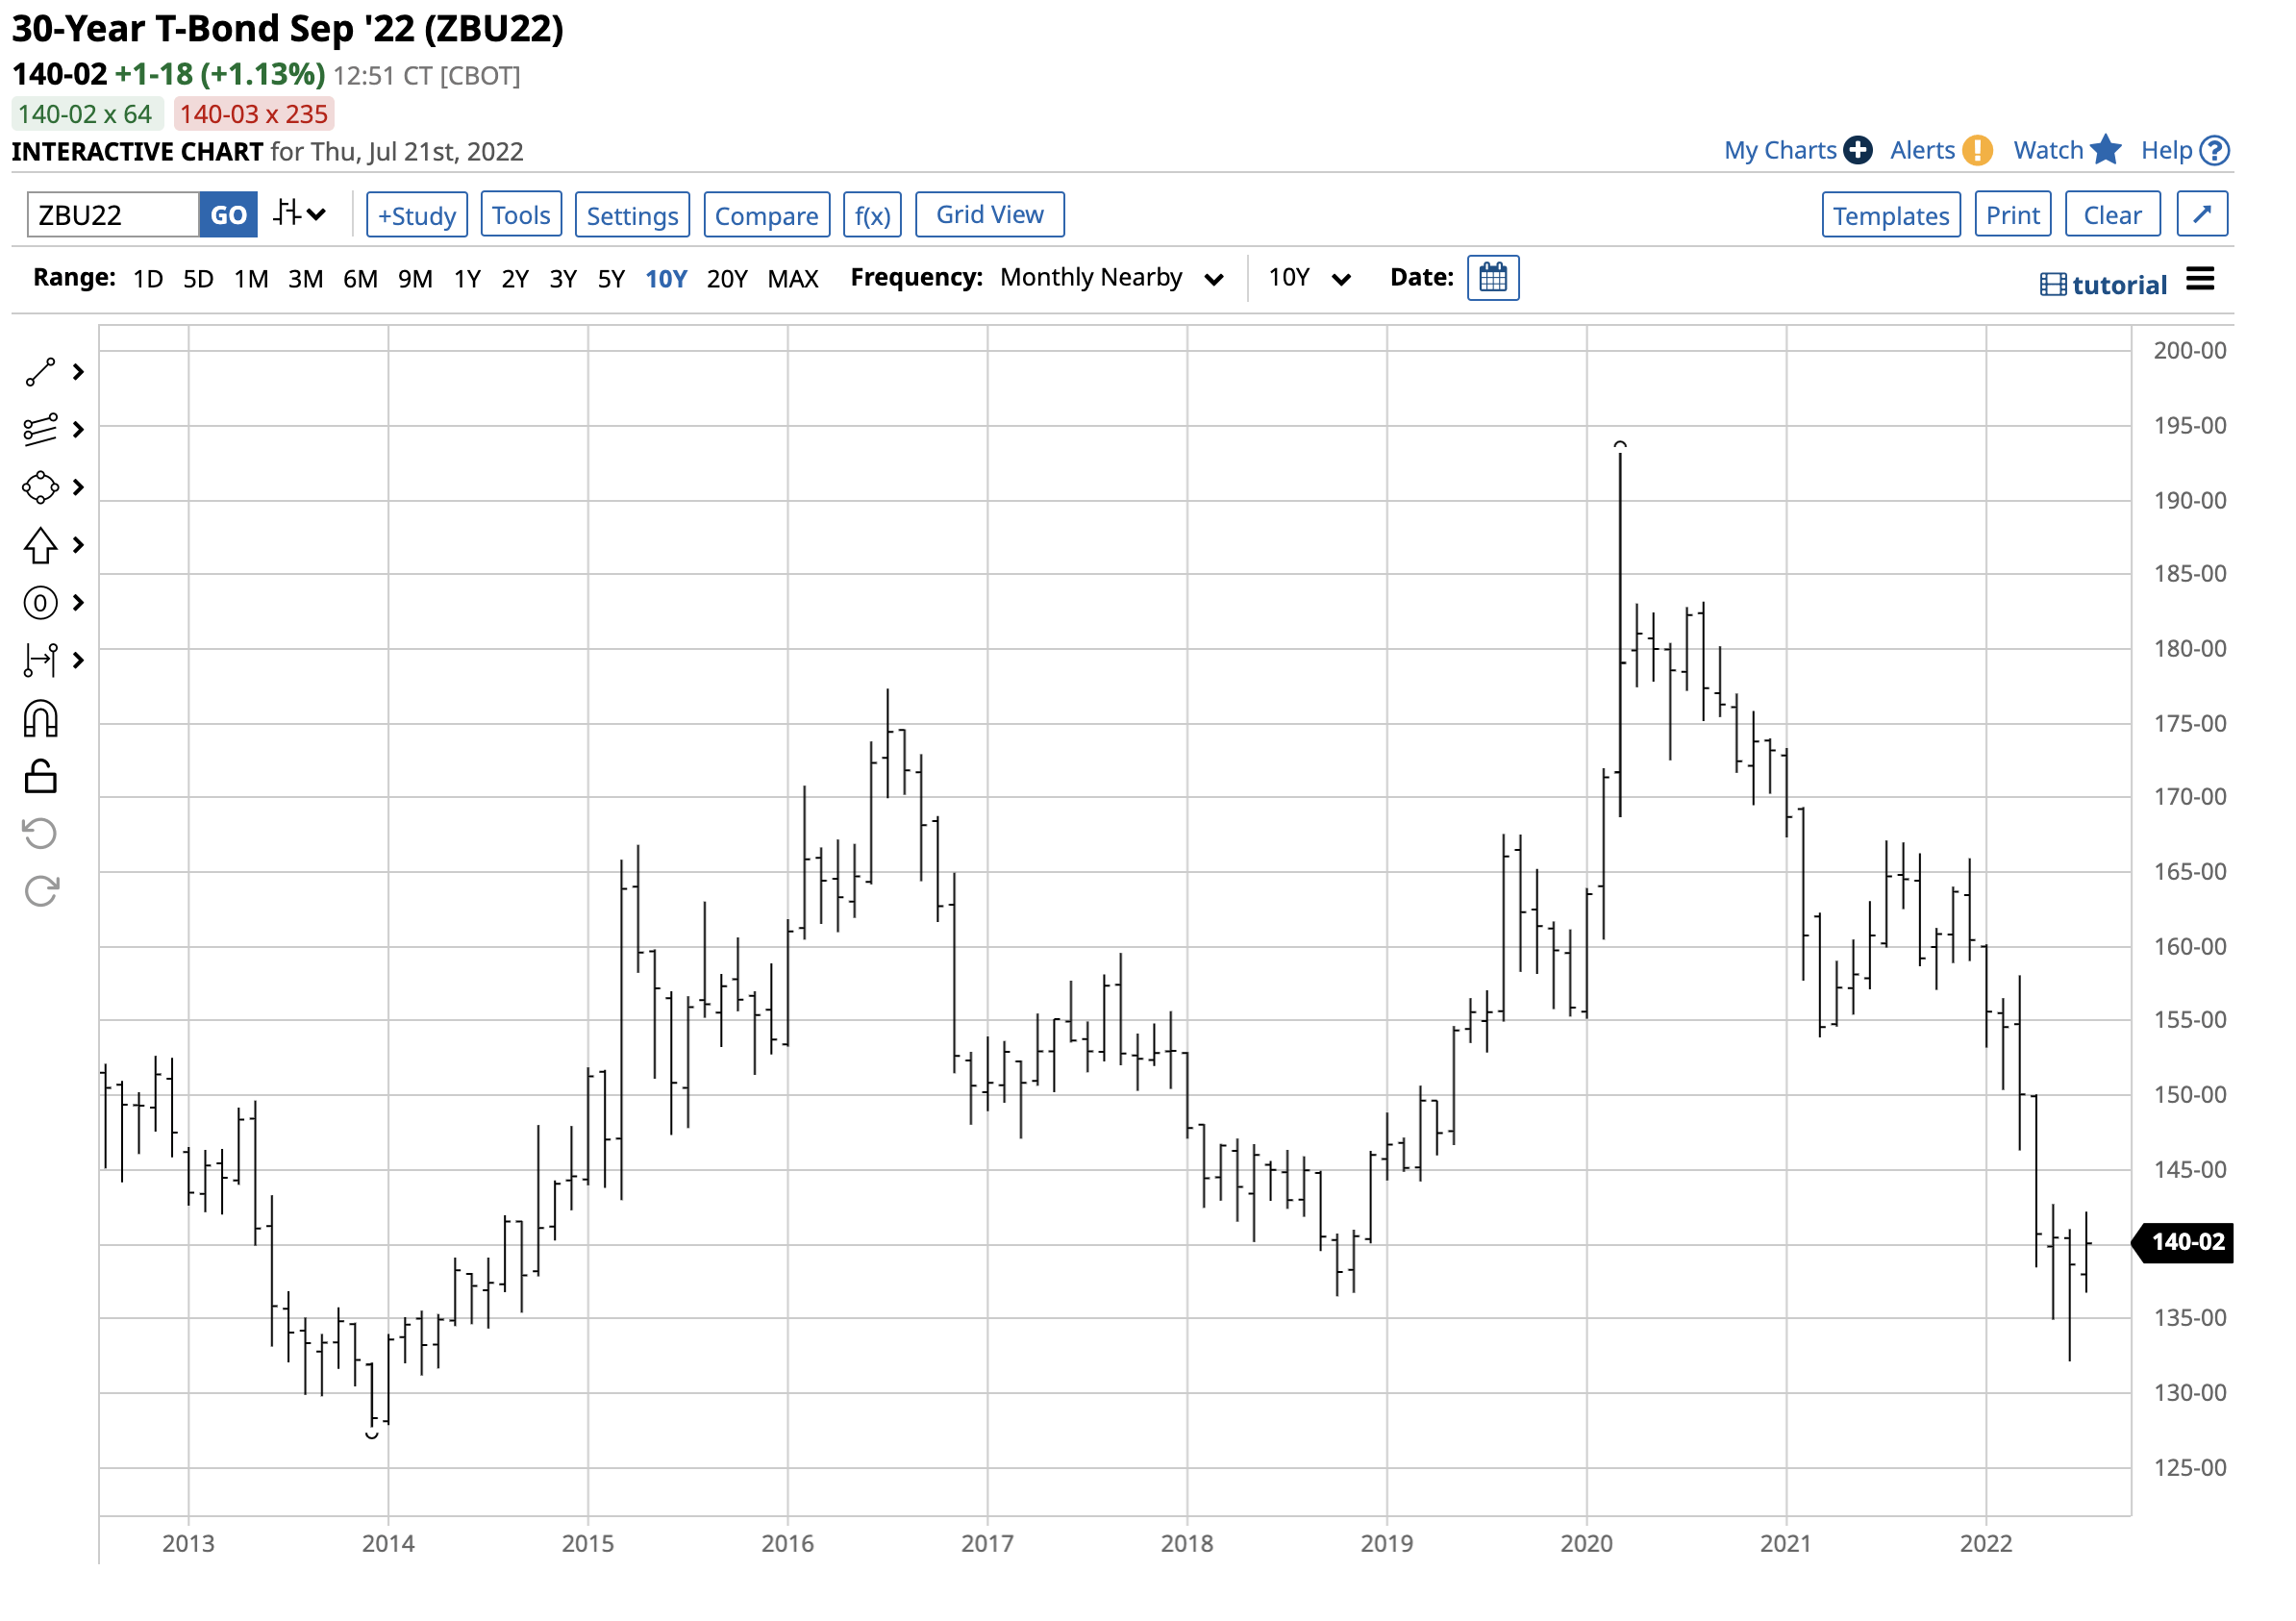
The 10-year chart shows the decline to 132-04 in June, the lowest level since April 2014. The long bond futures were trading at the 140 level on Thursday, July 21.
Bear markets experience sharp recoveries
The charts highlight the bearish path of least resistance in the bond market for more than two years. Meanwhile, bull and bear markets rarely move in straight lines, and corrections or recoveries are the norms.
Short-term chart of the US 30-Year Treasury Bond Futures (Barchart)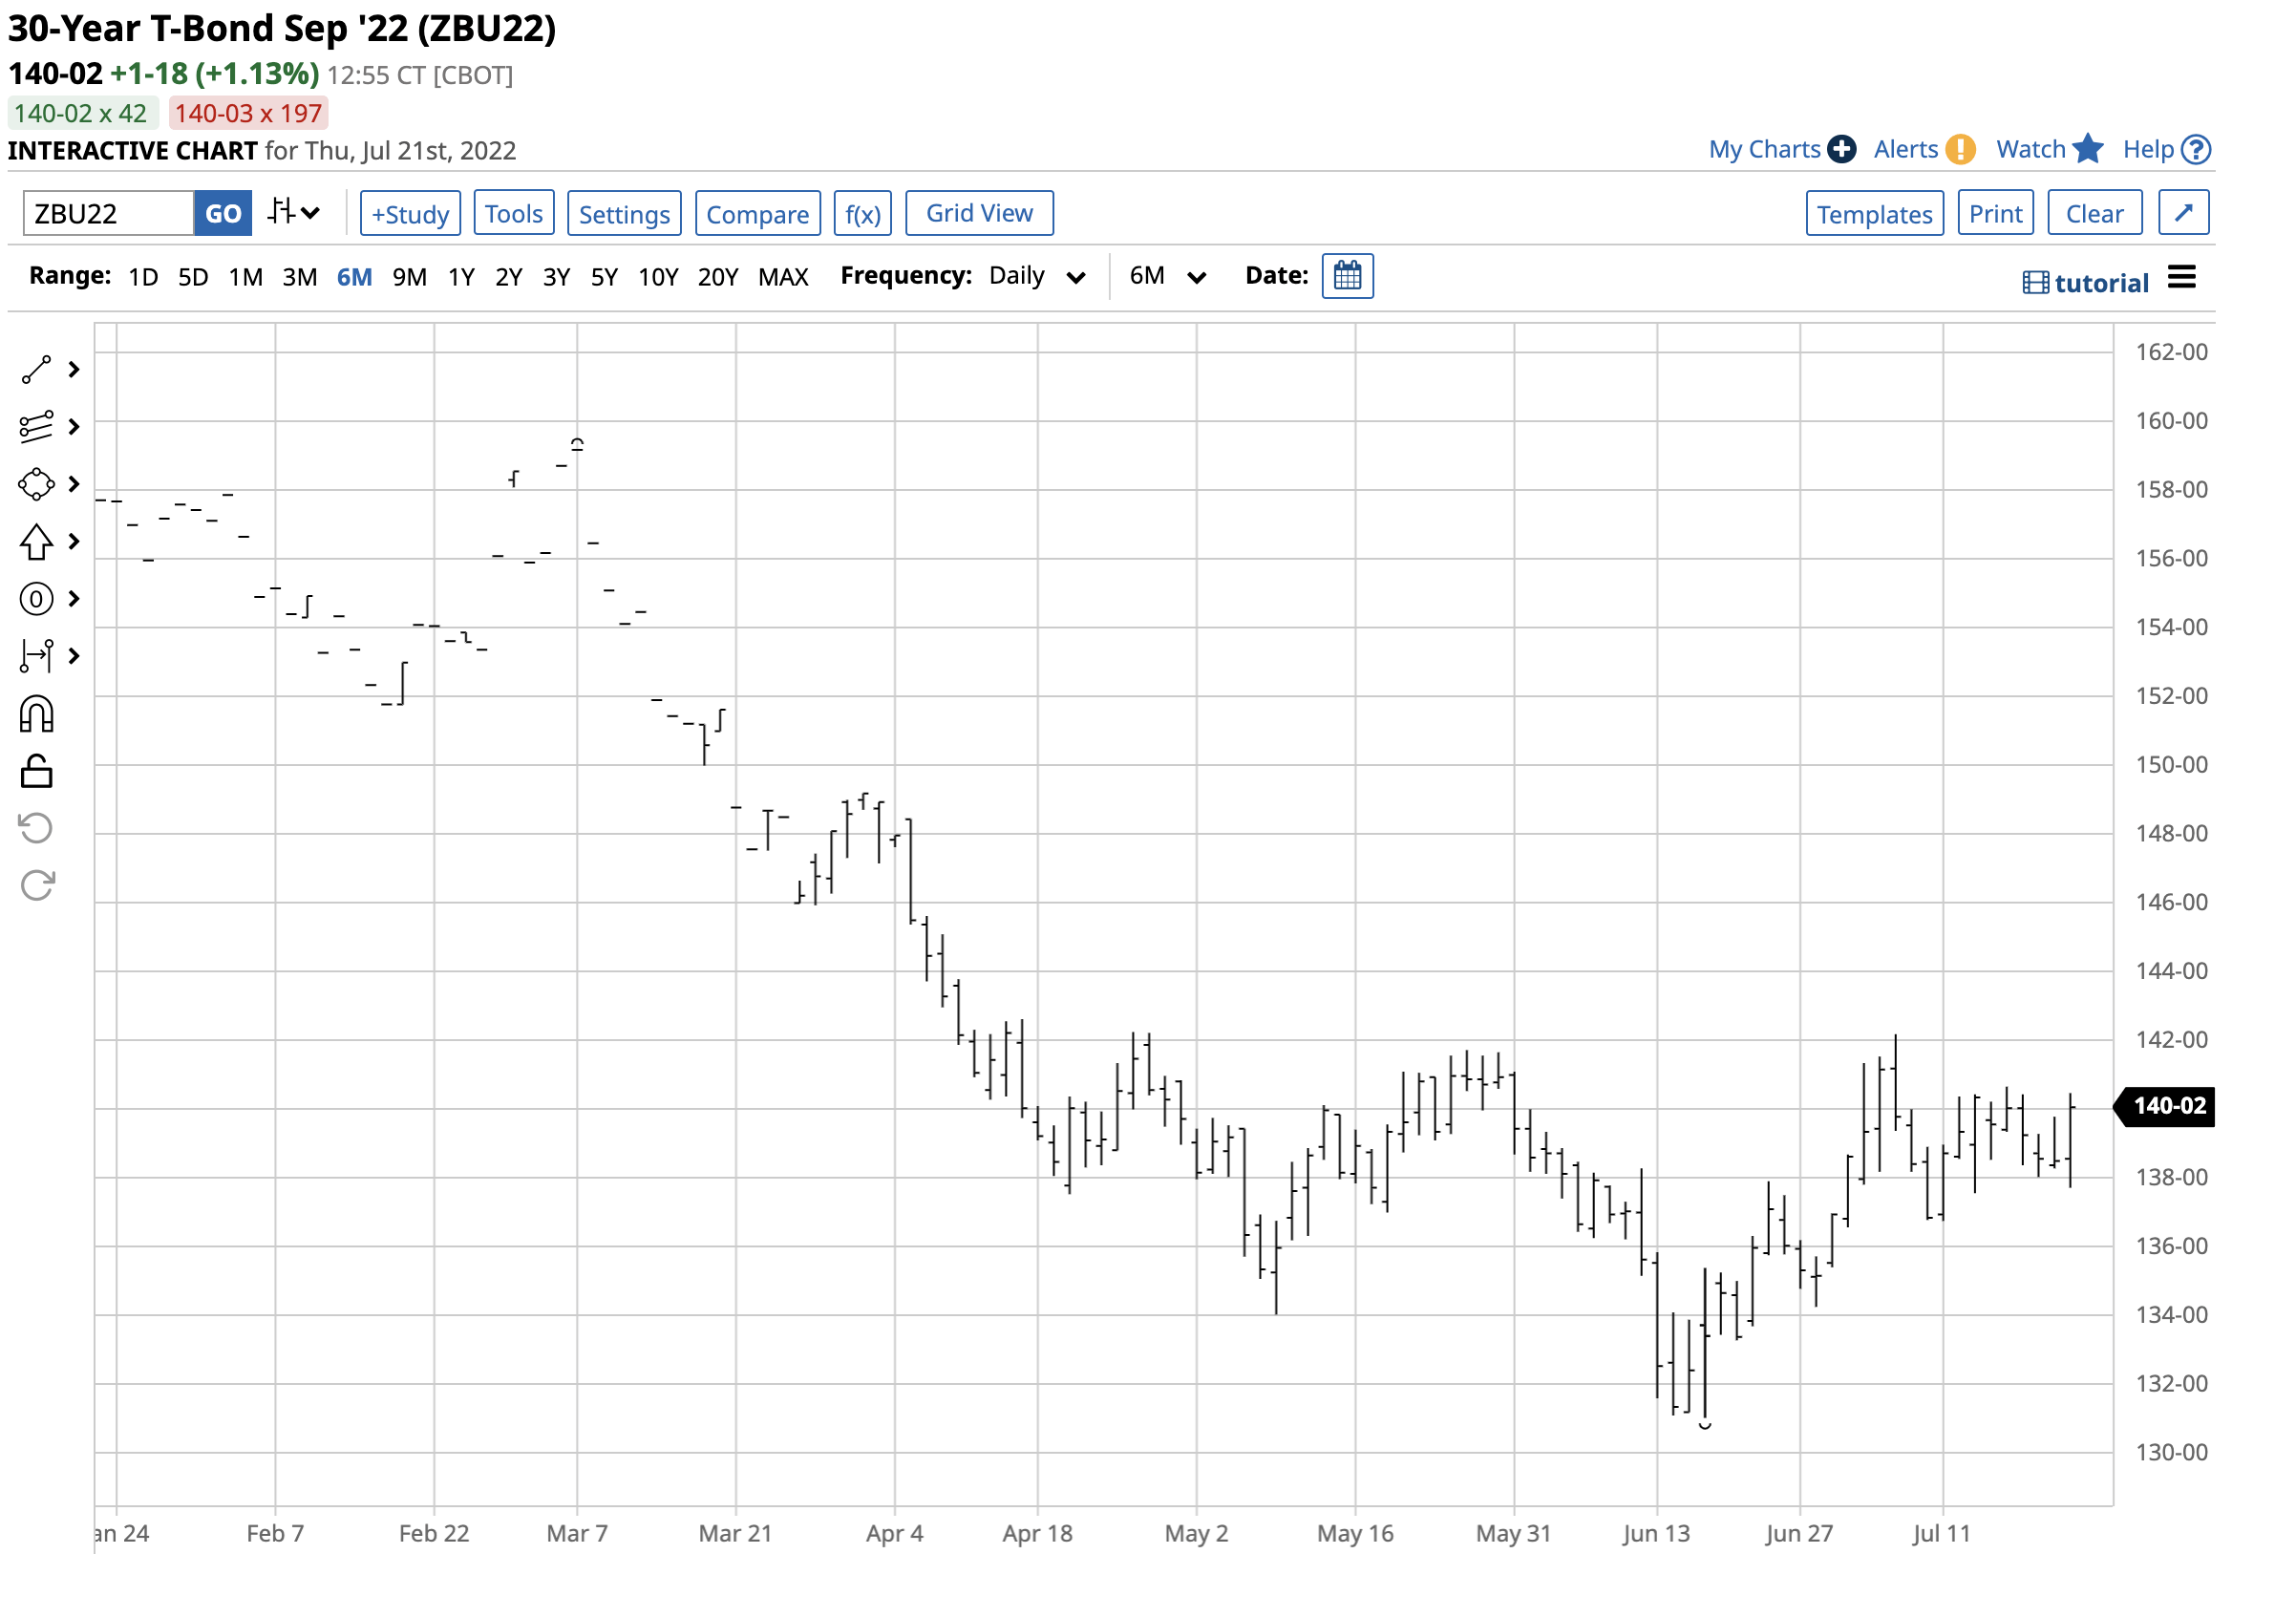
The short-term chart shows the recoveries from 134-01 on May 9 to 141-23 on May 25 and from 131-01 on June 16 to 142-06 on July 6 on the September 30-Year Treasury bond futures contract. Meanwhile, each recovery rally since the first half of 2020 has been a selling opportunity in the bond market as market forces continue to push interest rates to higher highs.
The three bearish compelling factors
Three issues point to a continuation of the bearish trend in the US government bond market:
- Next week, the US Federal Reserve will increase the short-term Fed Funds Rate by at least 75 basis points to 2.25% to 2.50%. Some market participants believe the Fed could push rates 1% higher at the FOMC meeting. Rising short-term rates often put upward pressure on interest rates further out along the yield curve.
- The latest June consumer and producer price index data showed inflation is at the highest level since the early 1980s. The US central bank has signaled that it will continue to use monetary policy to address the four-decade high in the economic condition, despite the risk of a recession. The CPI rise of 9.1% and PPI at 11.3% higher mean that rates remain in negative territory, fueling further inflationary pressures.
- The war in Ukraine is contributing to the highest food and energy prices in decades. While the Fed’s tools can address the economy’s demand side, supply-side issues created by events on the geopolitical landscape are beyond the central bank’s control. Even if inflation declines over the coming months, interest rates remain far below the inflation rate, meaning the bond market will continue to adjust to market conditions.
The compelling evidence points to a continuation of higher rates. Meanwhile, sudden downdrafts in the stock market or unexpected events that cause a flight to quality could cause periodic buying and recoveries in the bond market. During the past few years, those rallies have allowed sellers to reestablish short positions as the bearish trend has remained intact.
The TTT is a leveraged product
The fund summary for the ProShares UltraPro Short 20+ Year Treasury ETF product states:
Fund Summary for TTT ETF Product (Barchart)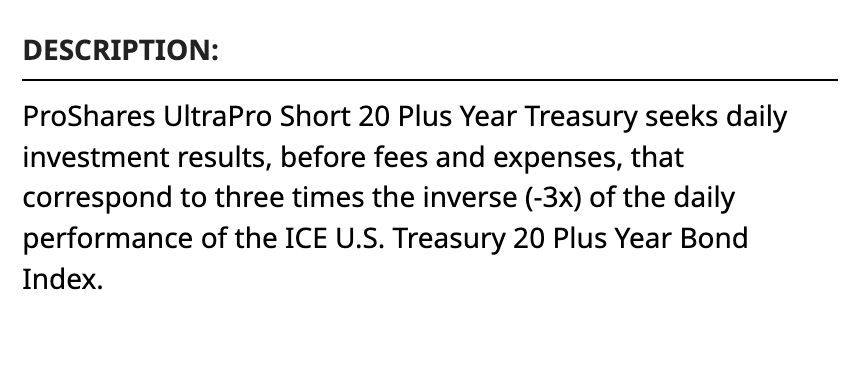
TTT is a liquid tool, but its leverage means it’s only appropriate for short-term trading purposes. At the $54.67 level on July 21, TTT had approximately $395 million in assets under management and traded an average of 136,712 shares each day. The ETF charges a 0.95% management fee. Leverage is a blessing and a curse as it magnifies short-term price moves but causes rapid time decay when the market does not move in the anticipated direction.
Buying TTT on dips
The most recent downdraft in the US 30-Year Treasury bond futures market took the September futures from 141-23 on May 25 to a low of 131-01 on June 16, or 7.54% lower.
Short-term Chart of the TTT ETF Product (Barchart)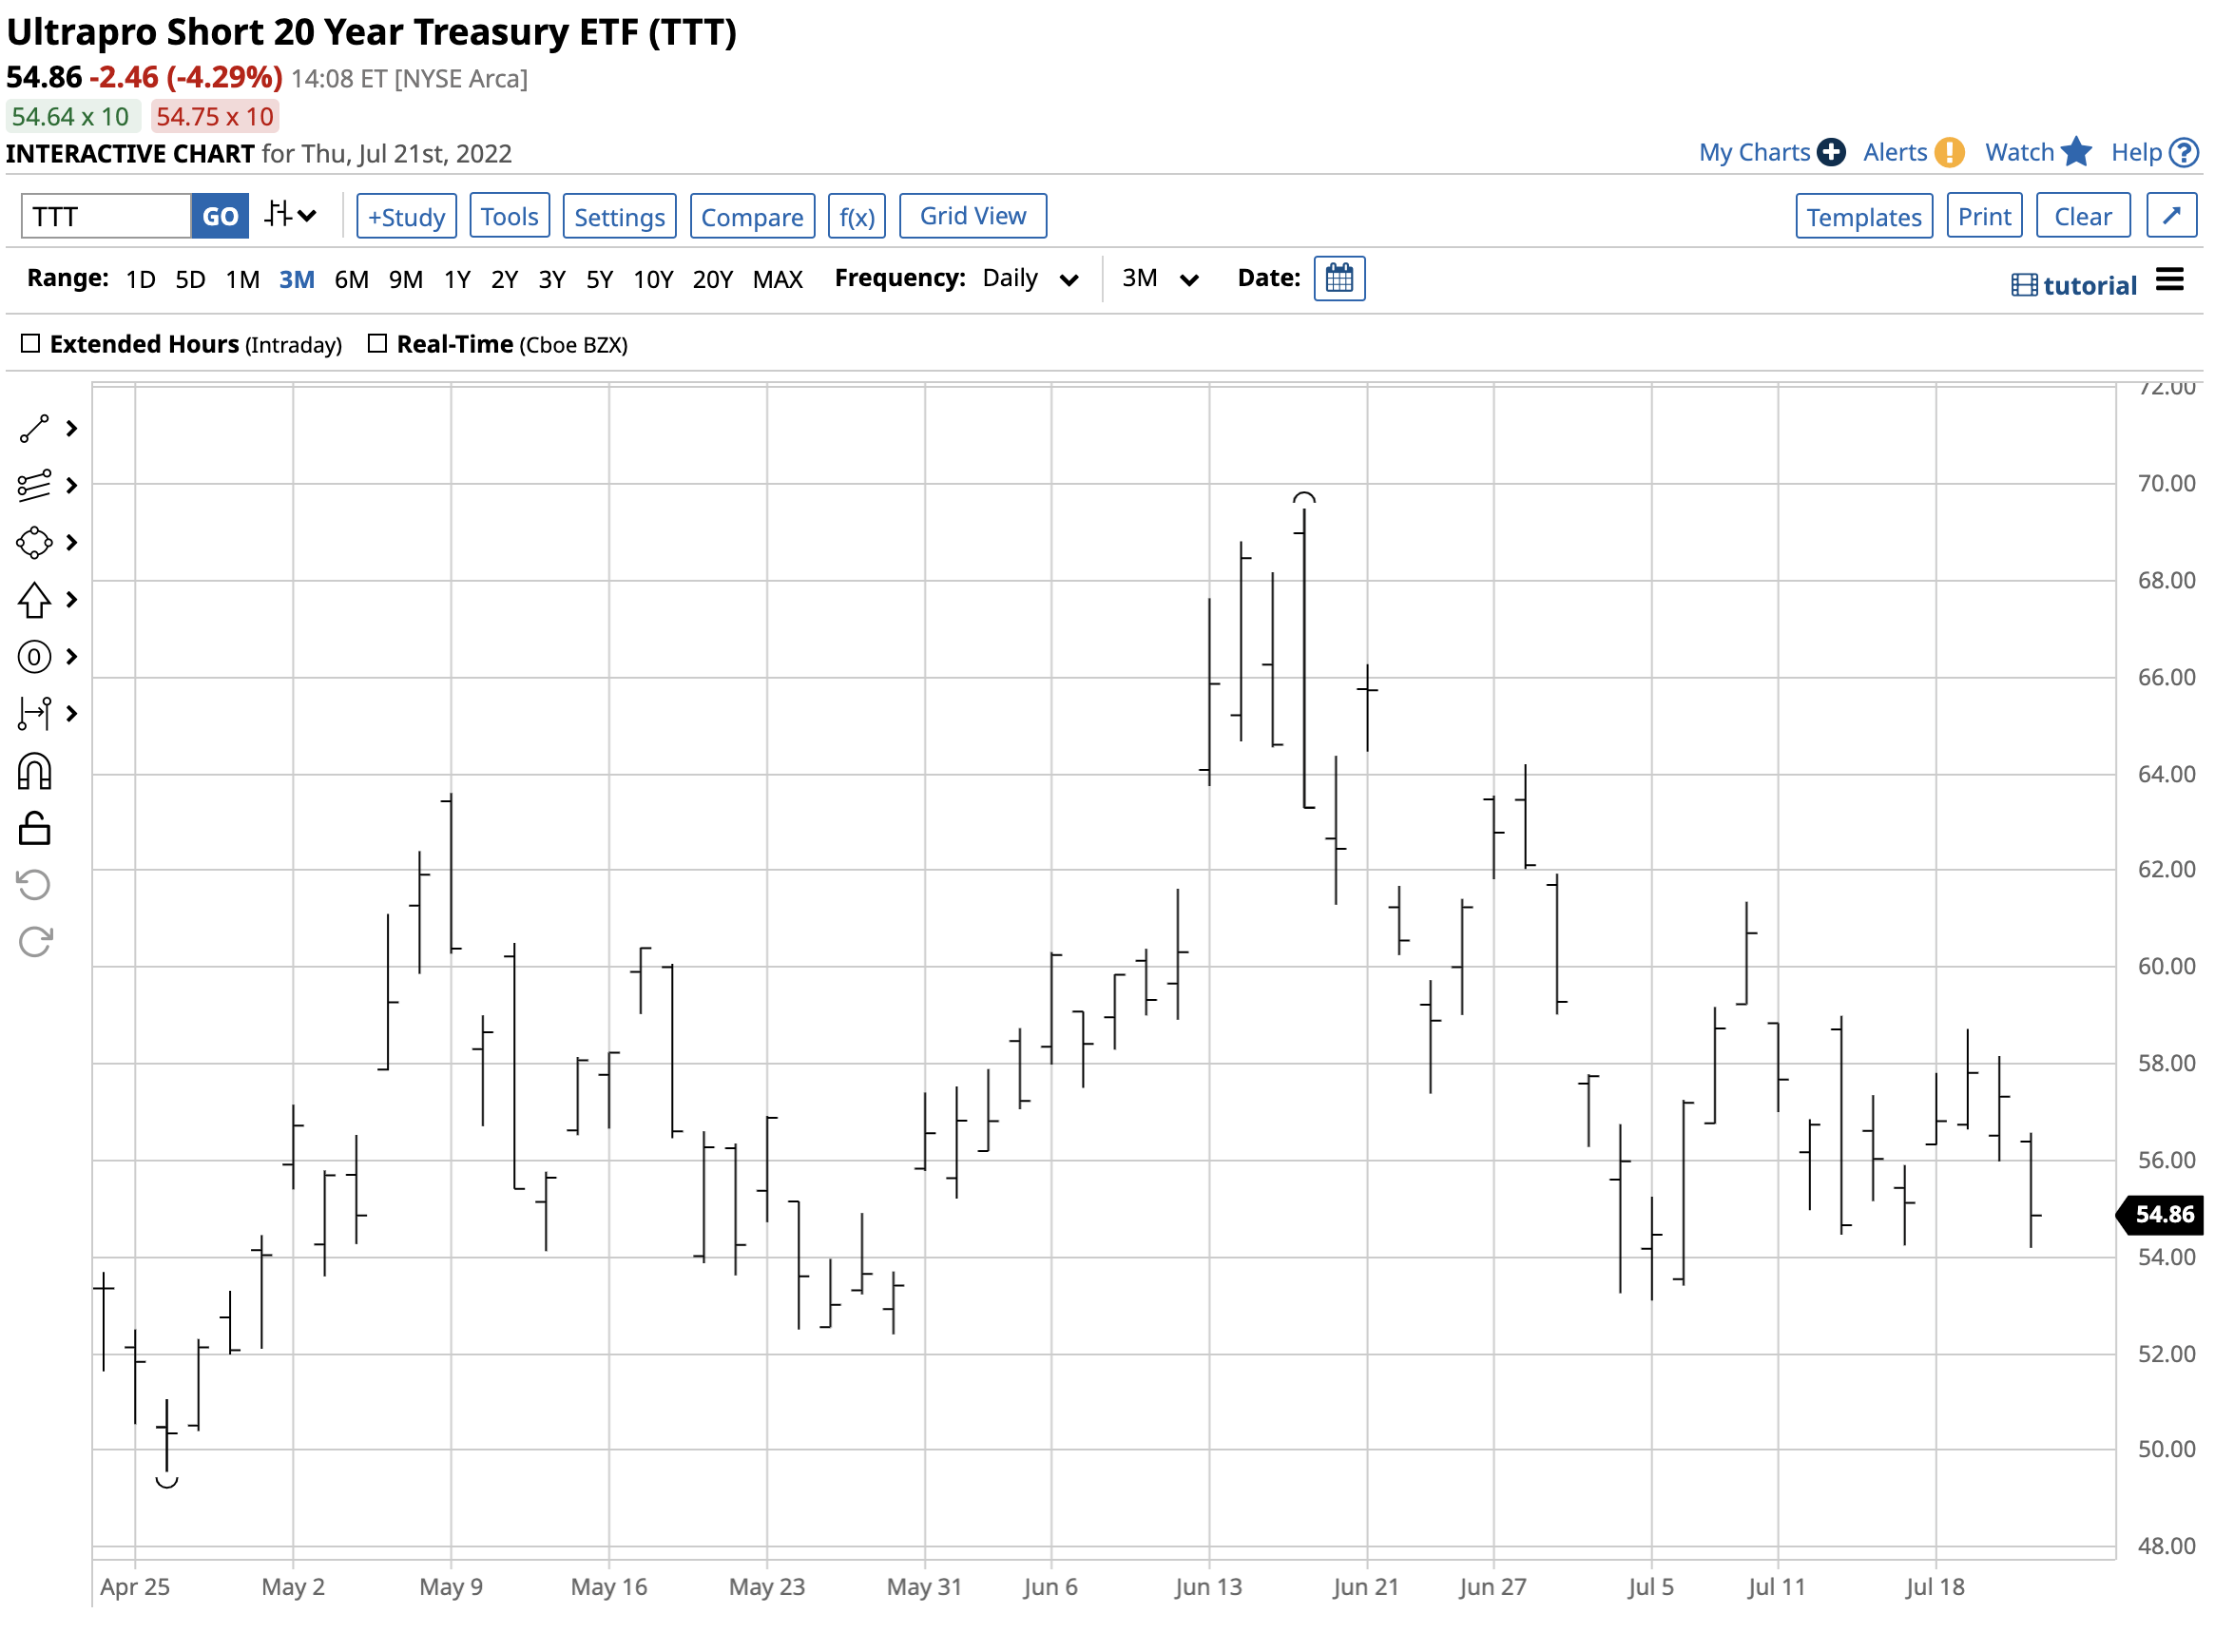
Over the same period, the TTT ETF product rose from $52.55 to $69.49 per share, or 32.24%. The return on the TTT was over triple the decline in the long bond futures market over the period.
Meanwhile, the TTT is not a product for long-term investors or traders who are bearish on the bond market’s prospects.
Long-term chart of the TTT ETF Product (Barchart)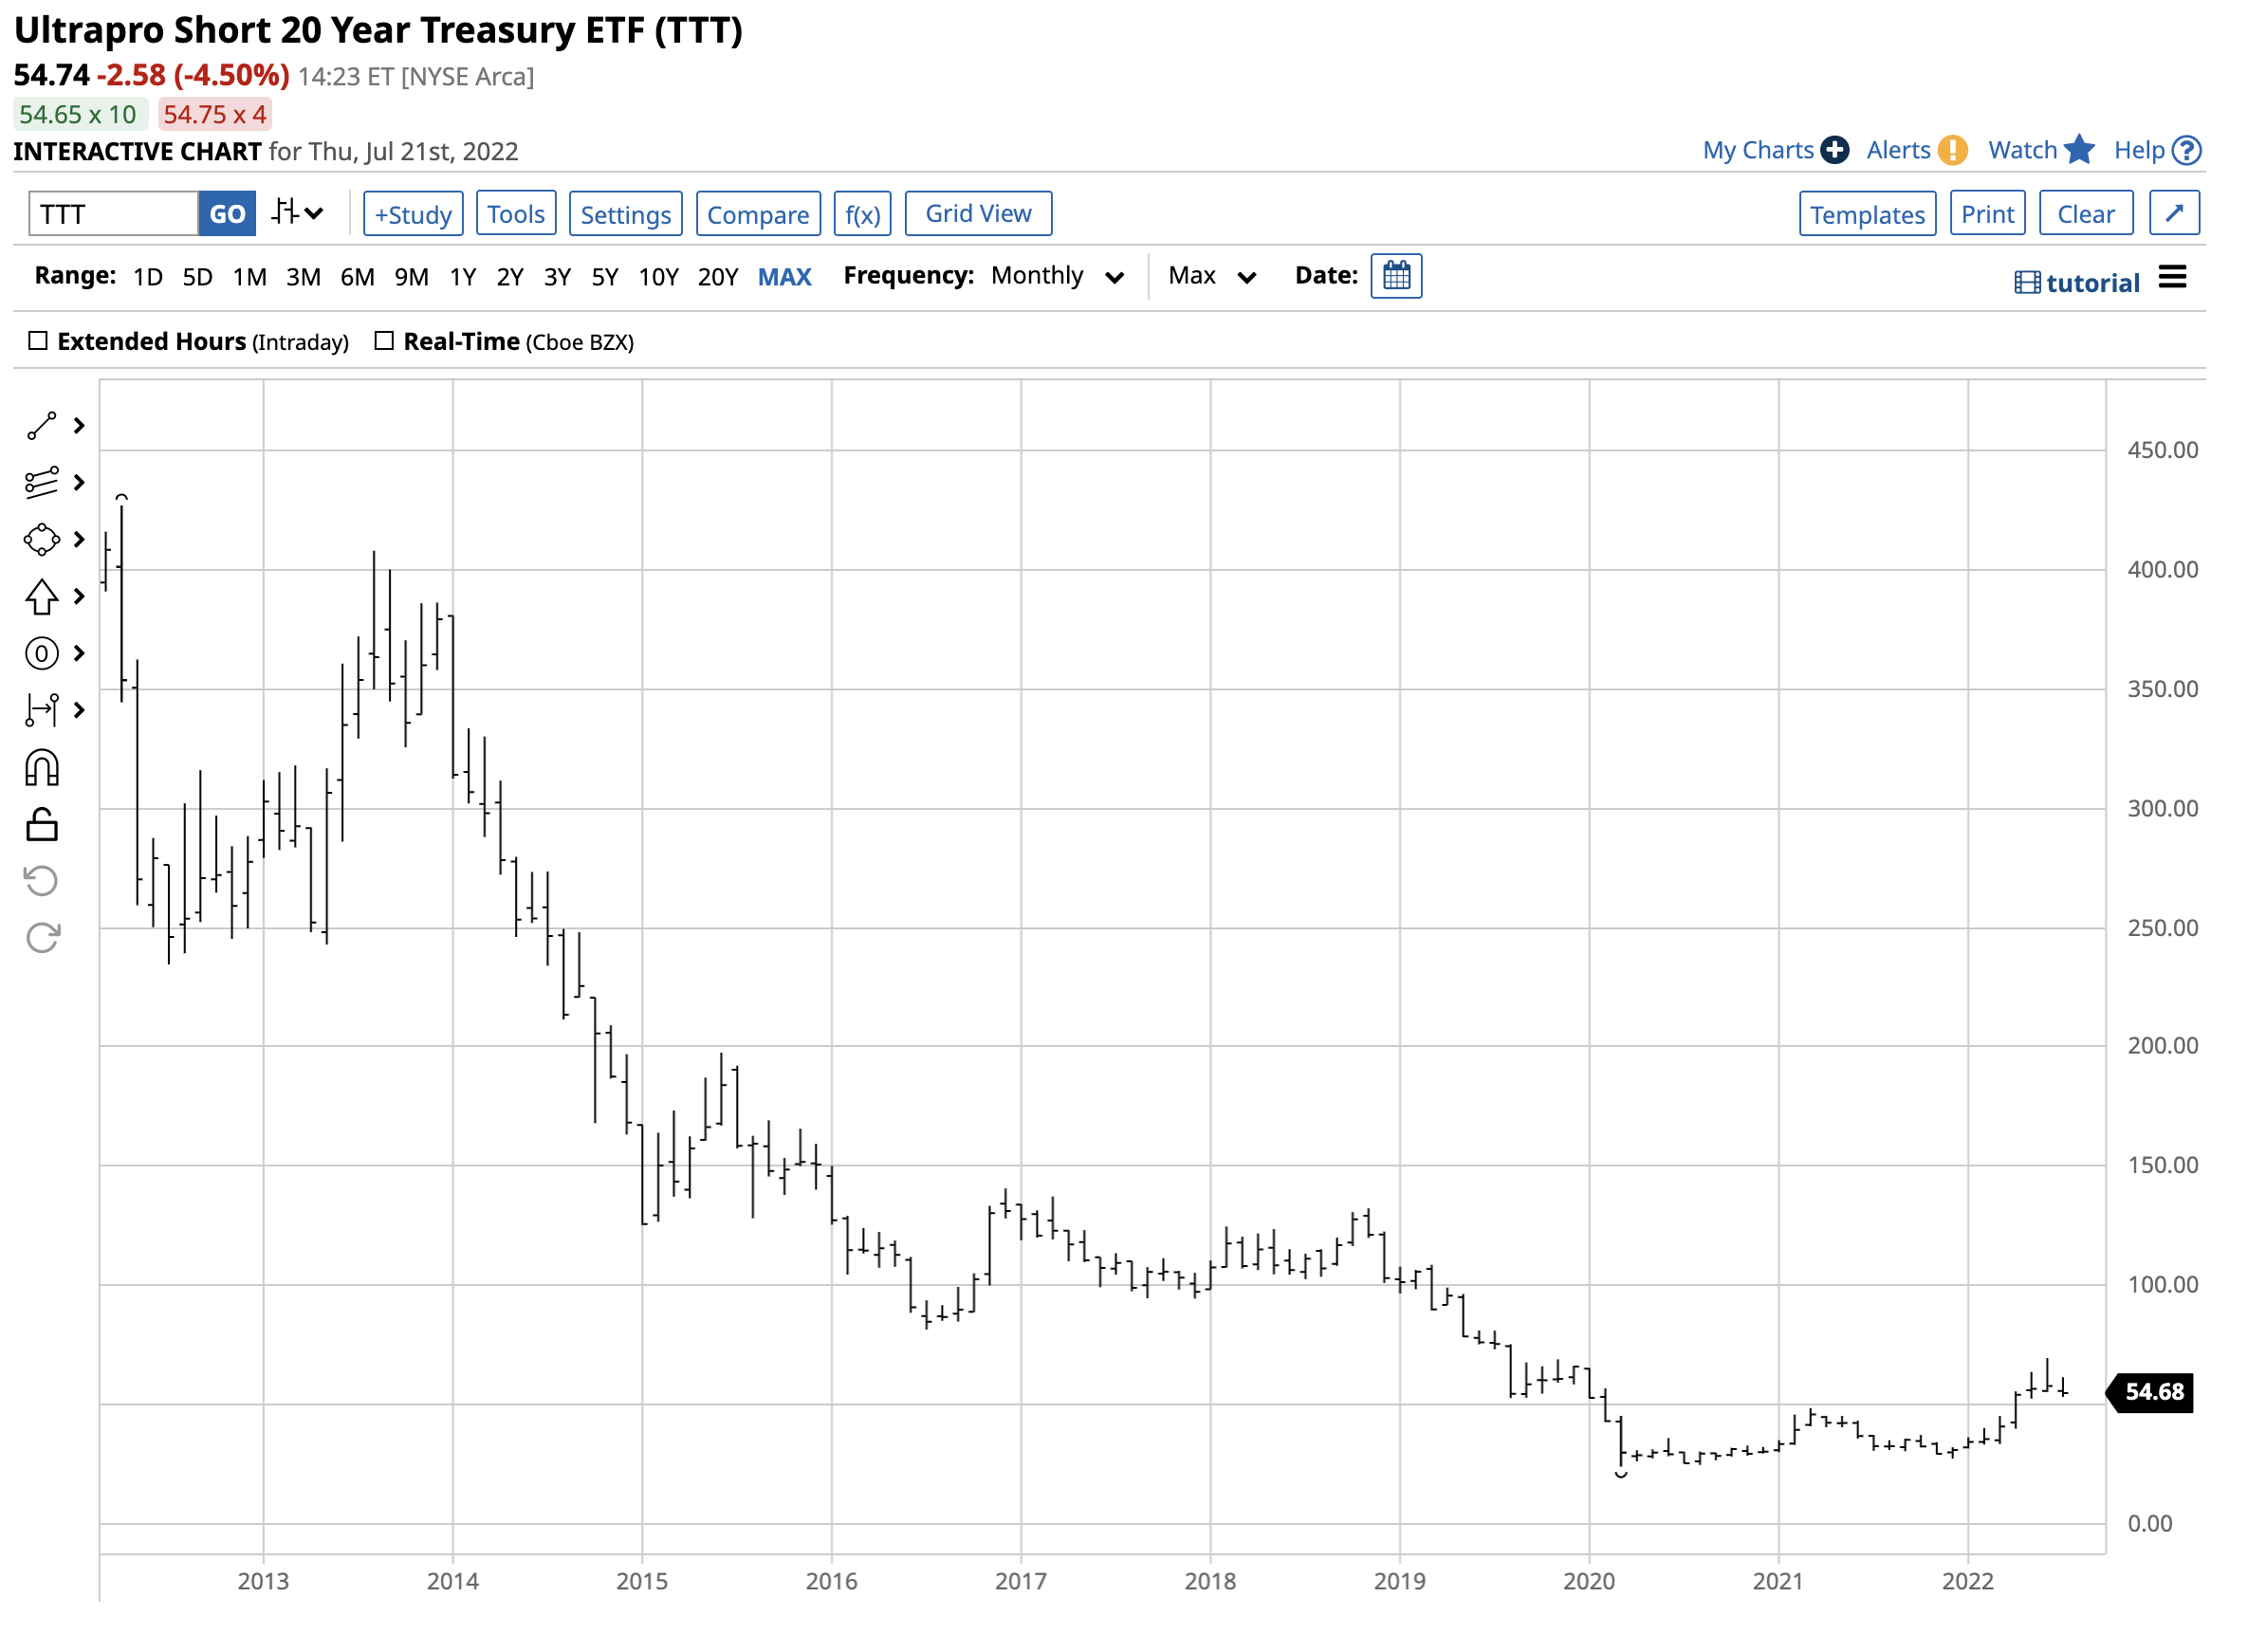
The chart shows the impact of time decay on the TTT product.
As the bearish trend continues, buying TTT on recovery rallies in the bond market could be the optimal approach for positioning for higher interest rates. The bond bear will not move in a straight line, providing opportunities for nimble traders with their fingers on the pulse of the interest rate markets. The TTT is a short-term tool that can enhance your trading results and hedge against rising rates. Meanwhile, technical resistance in the bond market stands at around the 142 level, with the bonds at just over 140 on July 21. Next week, the Fed will increase the Fed Funds Rate, and we could see lots of action in the US government bond market throughout the yield curve.
Be the first to comment