

JHVEPhoto
Thesis
In my earlier article on Taiwan Semiconductor Manufacturing Company Limited (NYSE:TSM), I recommended a hold position, anticipating a potential downturn due to the less-than-ideal state of consumer confidence amidst the economic cycle. Because of that I rated the stock as a hold despite my DCF model projecting a robust 43.8% upside.
In this follow-up article, I will reassess TSMC in light of the recent Q3 earnings release, employing two DCF models which propose fair values of $220.1 and $146.4 respectively. I am inclined to upgrade my rating on the stock to a “strong buy.” I believe that the developments in Q4 are inconsequential, as the stock boasts substantial long-term potential and a wide margin for error.
Seeking Alpha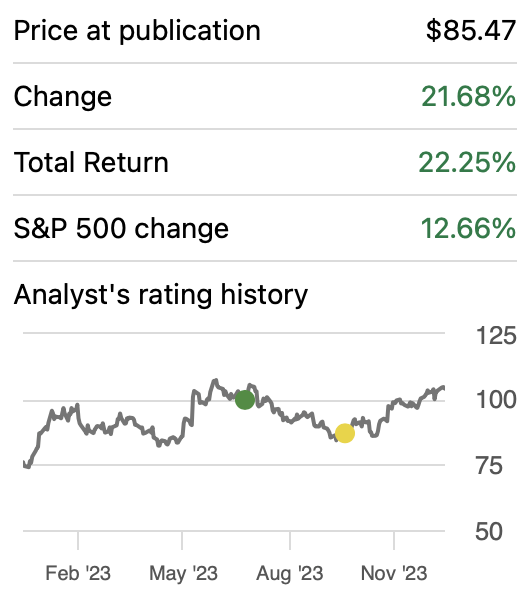
Overview
FQ3 2023
TSMC has reported robust financial results for Q3 2023, surpassing expectations. The company achieved earnings per diluted share of $1.29, exceeding estimates by $0.13. Despite a year-over-year decline of 14.6%, TSMC’s revenue reached an impressive $17.28 billion, surpassing projections by $580 million.
TSMC has revised its Q4 outlook, anticipating revenue in the range of $18.8 billion to $19.6 billion, with a consensus estimate of $18.33 billion. The company foresees sustained momentum in the fourth quarter, driven by the robust ramp-up of its 3-nanometer technology, albeit offset to some extent by customers’ inventory adjustments.
Capacity
The substantial surge in TSMC’s stock is primarily attributed to an augmented gross margin and an improved outlook for Q4 2023. The former may indicate an enhanced utilization rate, addressing challenges persisting since the beginning of the year. However, this increase has been relatively modest, shifting only marginally from 54.1% to 54.3%, reflecting a nominal 0.02% uptick.
TSMC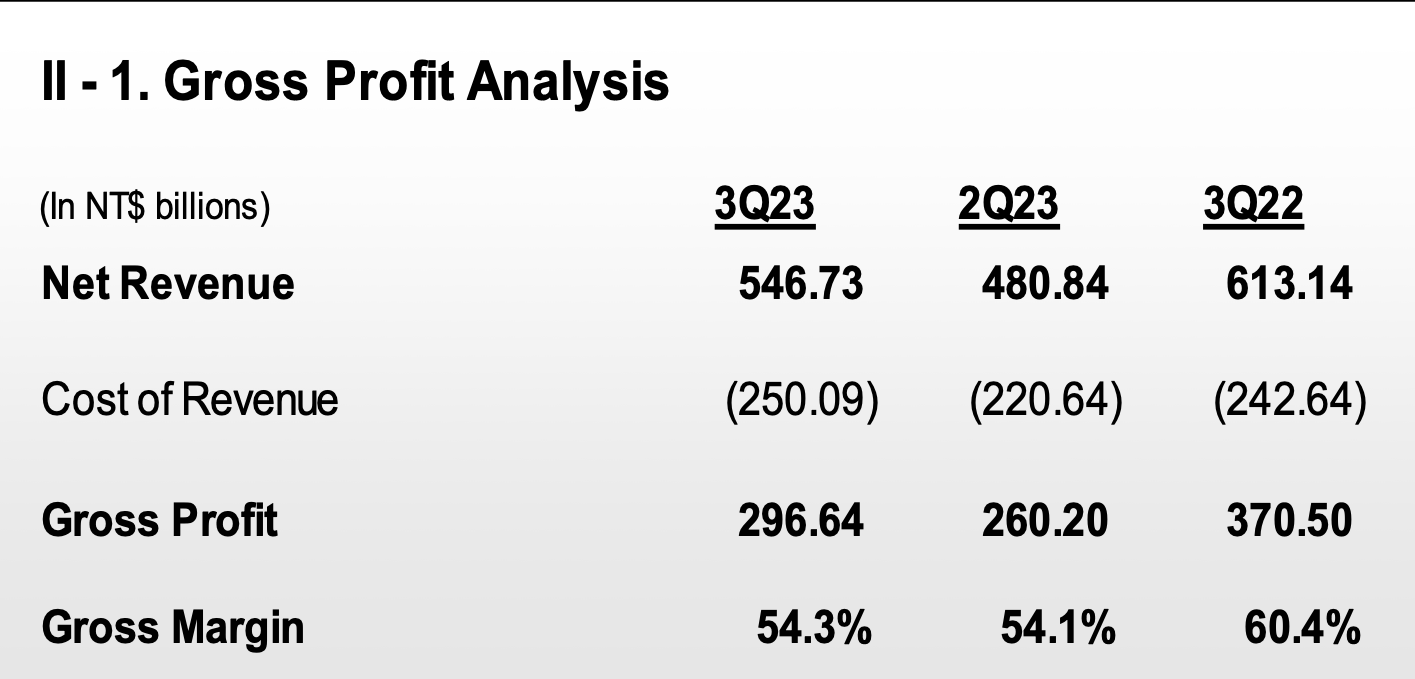
Market
Projections suggest that the semiconductor market is poised to grow at a Compound Annual Growth Rate [CAGR] of 7.42% from 2023 to 2027. As of 2023, the market volume stands at approximately $553 billion. If these projections materialize, it is estimated that the market will expand to $736 billion by 2027.
Semiconductors – Worldwide (Statista)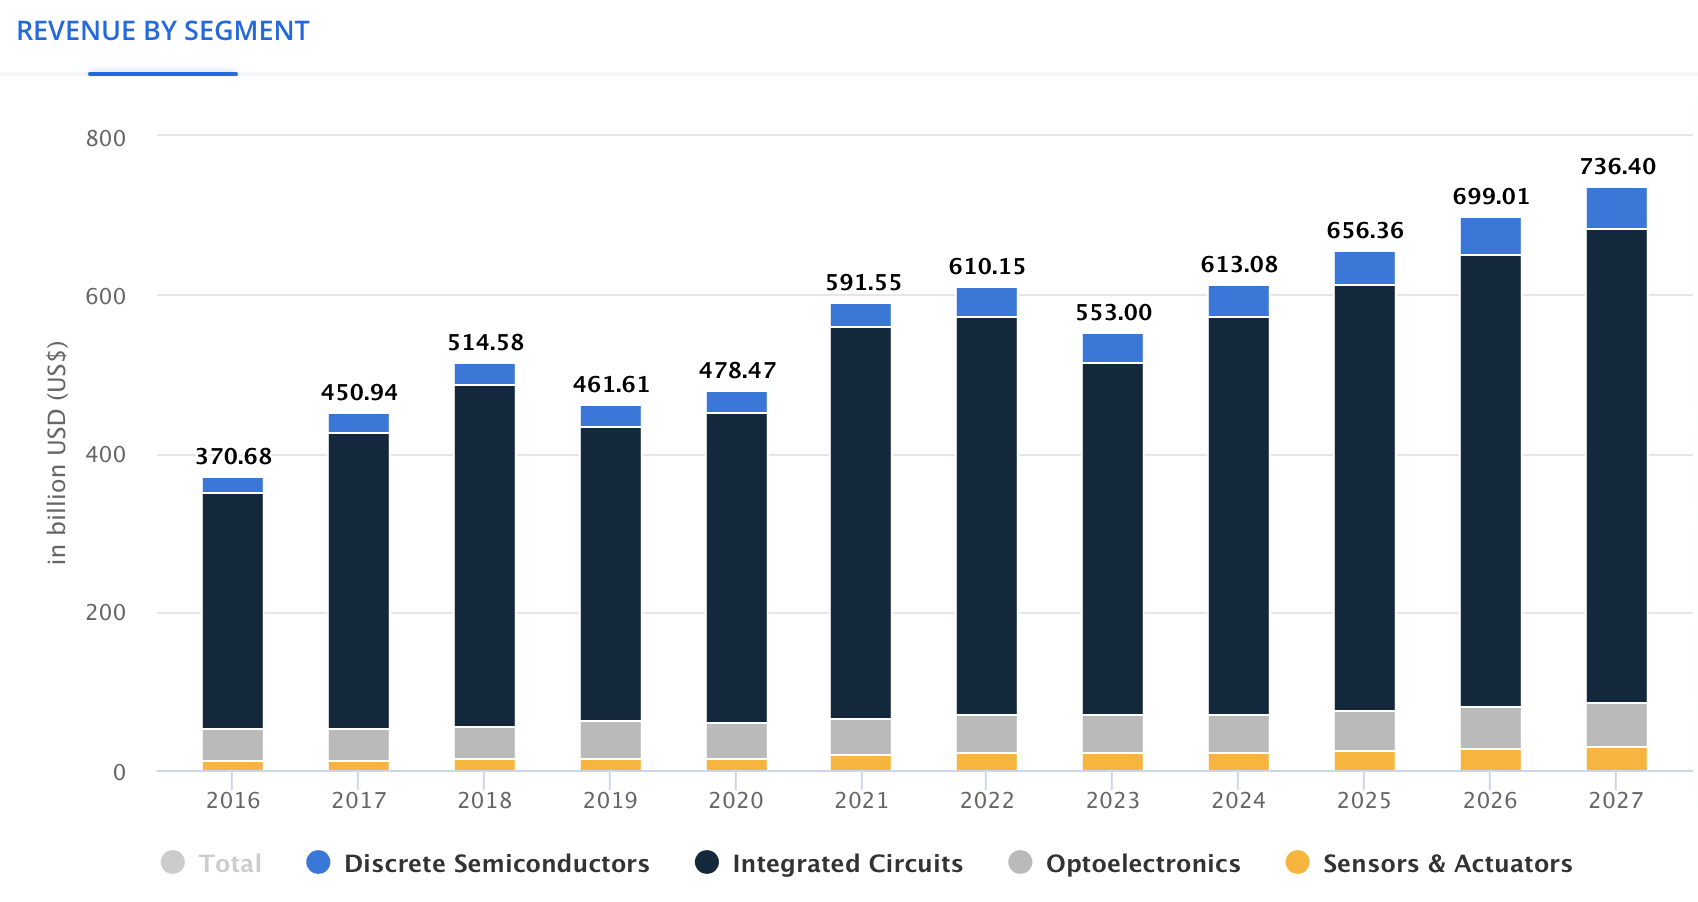
Financials
TSMC has maintained an annual revenue growth rate of 17.3% from 2017 to 2023. In my previous article, following Q2 2023, the trailing twelve months [TTM] revenue reached $71.5 billion. However, after Q3 2023, the TTM revenue decreased to $66.99 billion, marking a 6.73% reduction.
Operating income, growing at a rate of 22.5% in the mentioned period, was $34.2 billion before Q3. Presently, it stands at $30.56 billion, reflecting a 10.6% reduction.
The net income, the fastest-growing metric in the income statement at 23.2%, was $30.98 billion before Q3 and is now $27.75 billion, indicating an 11.63% reduction.
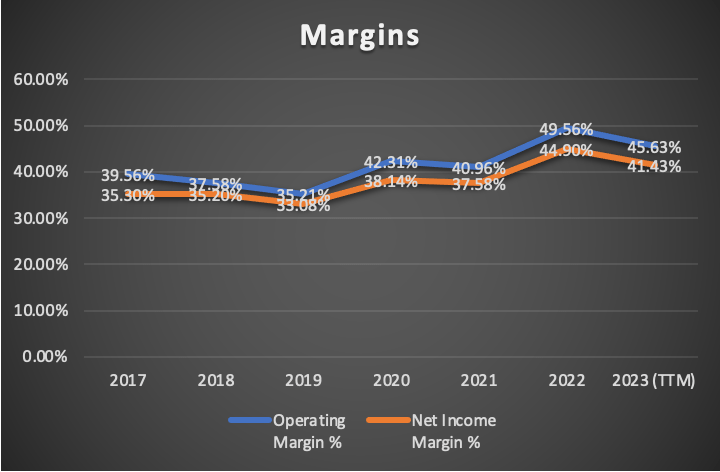
Margins also experienced a decline; the operating margin decreased from 47.96% before Q3 to 45.63% after Q3. Similarly, the net income margin decreased from 43.33% to 41.43%.
Author’s Calculation Author’s Calculation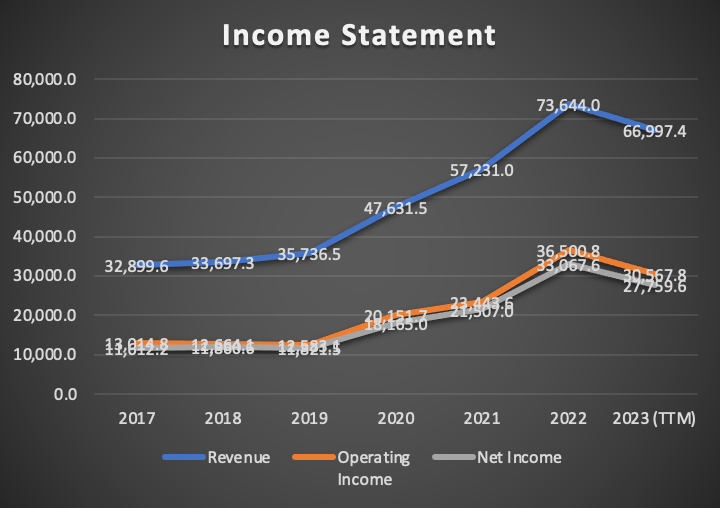
Despite being a capital-intensive company, TSMC’s balance sheet remains robust, with minimal changes from Q2 to Q3 2023. Long-term debt saw a slight decrease from $29.11 billion to $29.05 billion, while cash increased from $47.78 billion to $48.07 billion.
Author’s Calculation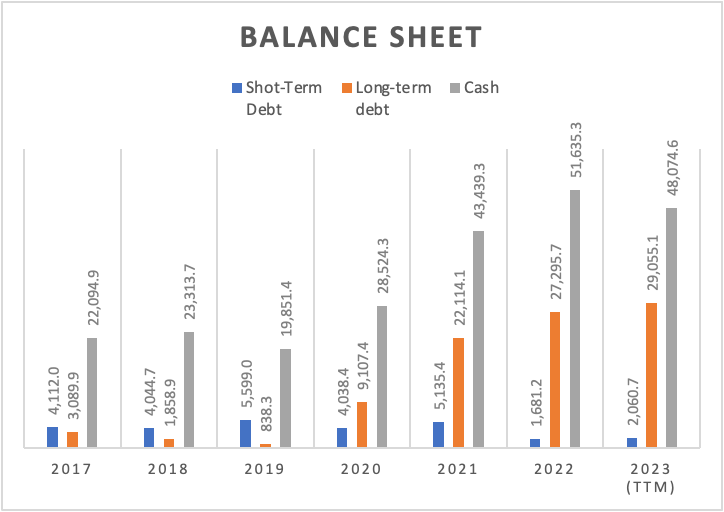
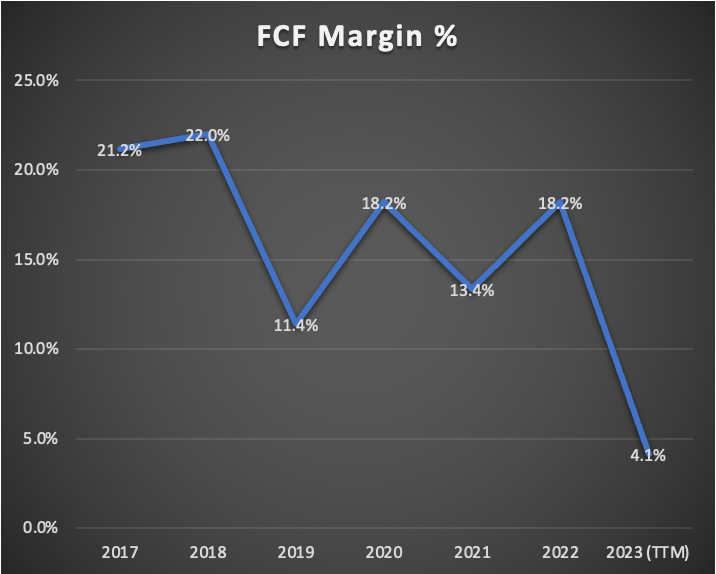
Free cash flow has steadily decreased, from the 2022 peak of $13.4 billion to $2.7 billion, reflecting a significant 79.8% decrease. Before Q3, FCF was $5.2 billion, and it now stands at $2.7 billion, marking a 48% decrease. This decline has resulted in a depressed FCF margin, currently standing at 4.1%.
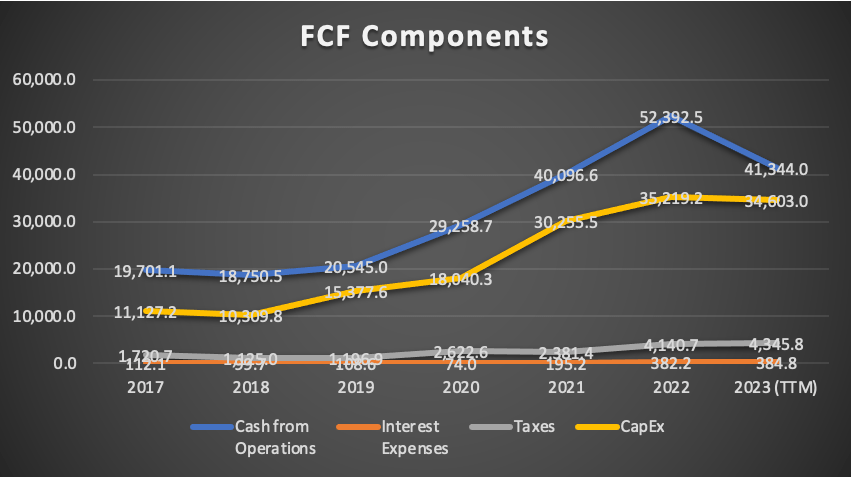
Examining the “FCF components” graph reveals that the reduction in free cash flow is attributable to the decrease in cash from operations, influenced by lower utilization rates caused by the reduction in chip demand. Meanwhile, CapEx has remained nearly unchanged at $34.6 billion.
Author’s Calculation Author’s Calculation Author’s Calculation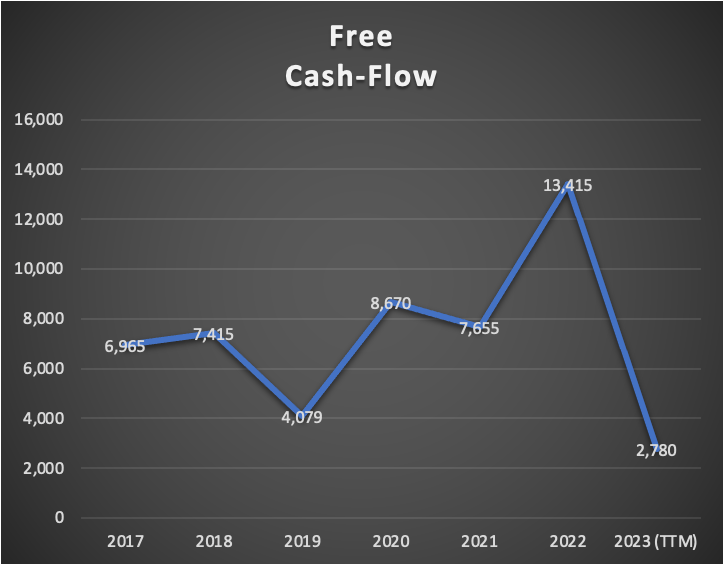
Valuation
In this valuation analysis, I will employ two Discounted Cash Flow [DCF] models to gauge TSMC’s intrinsic value. The first model integrates Analysts’ estimates for revenue and EPS in FY2023 and FY2024, alongside forward revenue growth and the 3 to 5-year long-term EPS growth rate.
The second DCF model is rooted in the anticipated market revenue projections of the worldwide semiconductor market.
The provided table encapsulates all current data pertinent to TSMC. Using this data, I will calculate the Weighted Average Cost of Capital [WACC] by factoring in Equity value, Debt value, and Cost of debt. Additionally, Depreciation and Amortization (D&A), Interest, and Capital Expenditures [CapEx] will be computed based on margins linked to revenue growth. This method ensures that as TSMC’s revenue expands, these expenses will also increase, providing a more pragmatic and coherent projection.
| TABLE OF ASSUMPTIONS | |
| (Current data) | |
| Assumptions Part 1 | |
| Equity Value | 103,773.30 |
| Debt Value | 31,115.80 |
| Cost of Debt | 1.24% |
| Tax Rate | 13.54% |
| 10y Treasury | 3.80% |
| Beta | 1.06 |
| Market Return | 10.50% |
| Cost of Equity | 10.90% |
| Assumptions Part 2 | |
| CapEx | 34,603.00 |
| Capex Margin | 51.65% |
| Net Income | 27,759.60 |
| Interest | 384.80 |
| Tax | 4,345.80 |
| D&A | 14,877.30 |
| Ebitda | 47,367.50 |
| D&A Margin | 22.21% |
| Interest Expense Margin | 0.57% |
| Revenue | 66,997.4 |
Analysts’ Estimates
In this preliminary model, I will evaluate TSMC based on current analyst estimates. Commencing with revenue, FY2022 projections indicate an expected figure of $69.09 billion, with analysts anticipating a subsequent increase to $83.94 billion for FY2024.
Seeking Alpha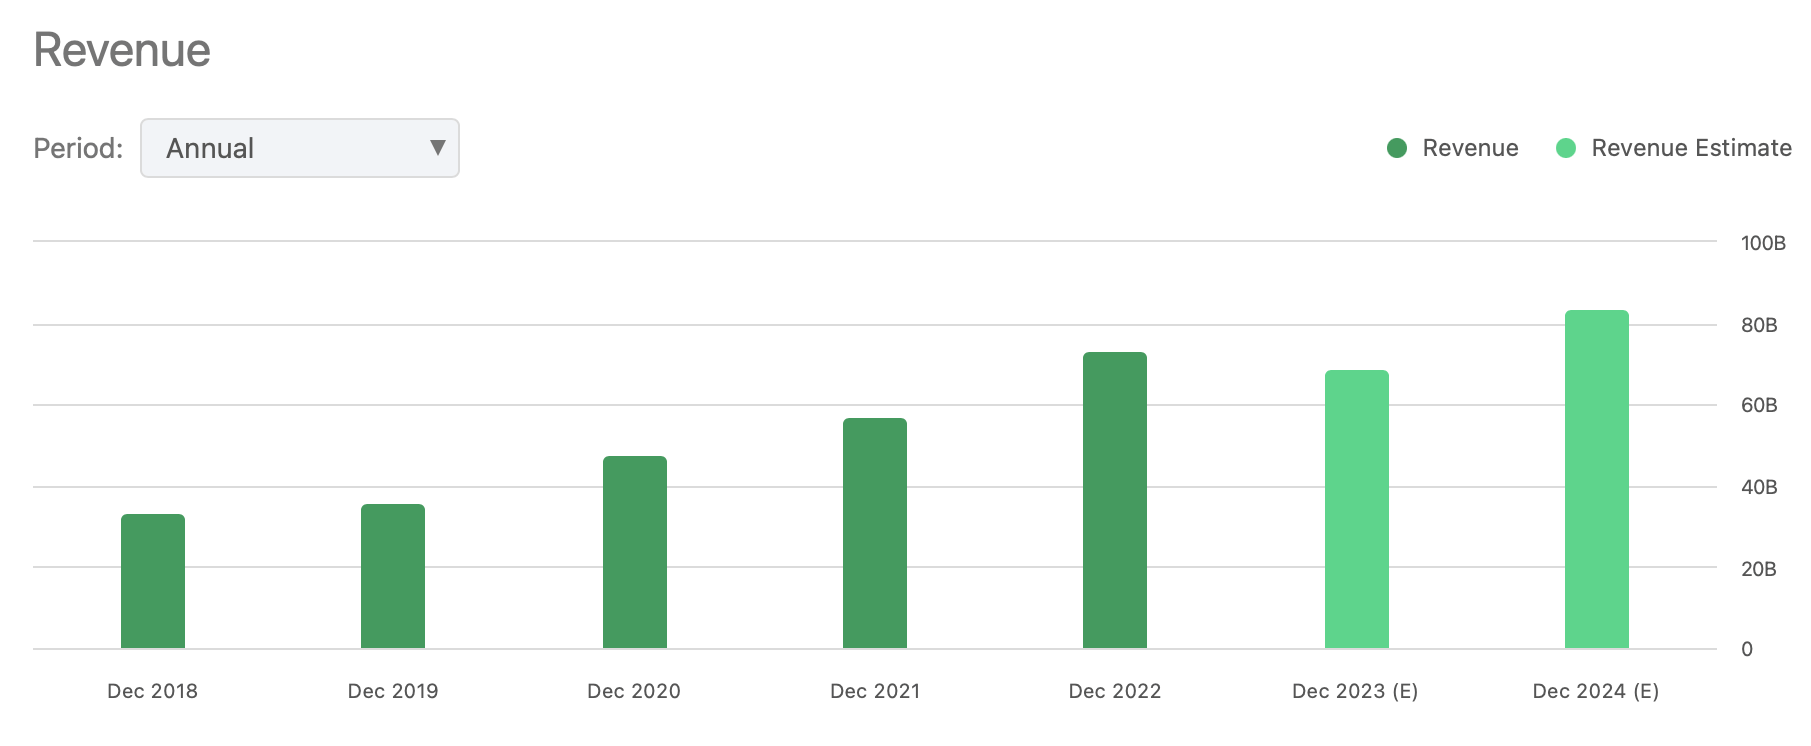
For EPS, forecasts are set at $5.12 for FY2023 and $6.1 for FY2024. When multiplied by the total number of shares outstanding, these estimates result in net incomes of $26.57 billion and $31.65 billion, respectively. This signals a significant upside of around 19.2% from FY2023 to FY2024.
Seeking Alpha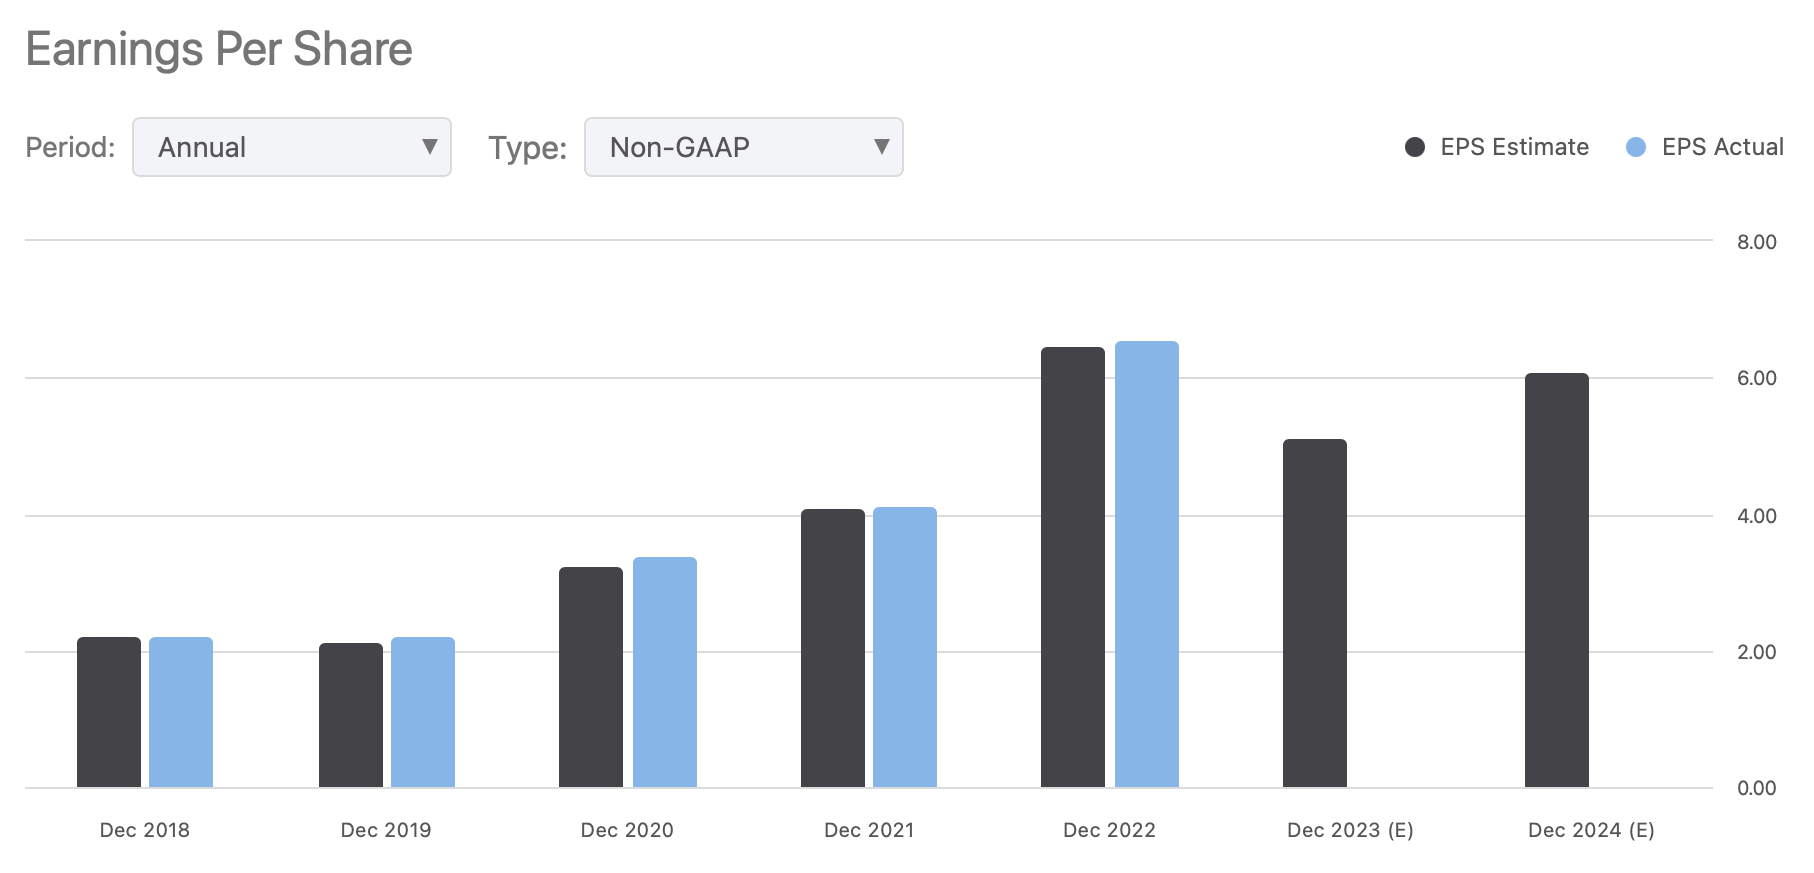
| Revenue | Net Income | Plus Taxes | Plus D&A | Plus Interest | |
| 2023 | $69,090.0 | $26,572.80 | $30,169.71 | $45,511.68 | $45,908.50 |
| 2024 | $83,940.0 | $31,659.00 | $35,944.38 | $51,286.35 | $51,683.17 |
| 2025 | $95,271.9 | $33,928.95 | $38,521.59 | $59,677.46 | $60,224.66 |
| 2026 | $108,133.6 | $36,361.66 | $41,283.58 | $65,295.50 | $65,916.57 |
| 2027 | $122,731.6 | $38,968.79 | $44,243.62 | $71,497.15 | $72,202.06 |
| 2028 | $139,300.4 | $41,762.85 | $47,415.88 | $78,348.64 | $79,148.71 |
| ^Final EBITA^ |
Author’s Calculations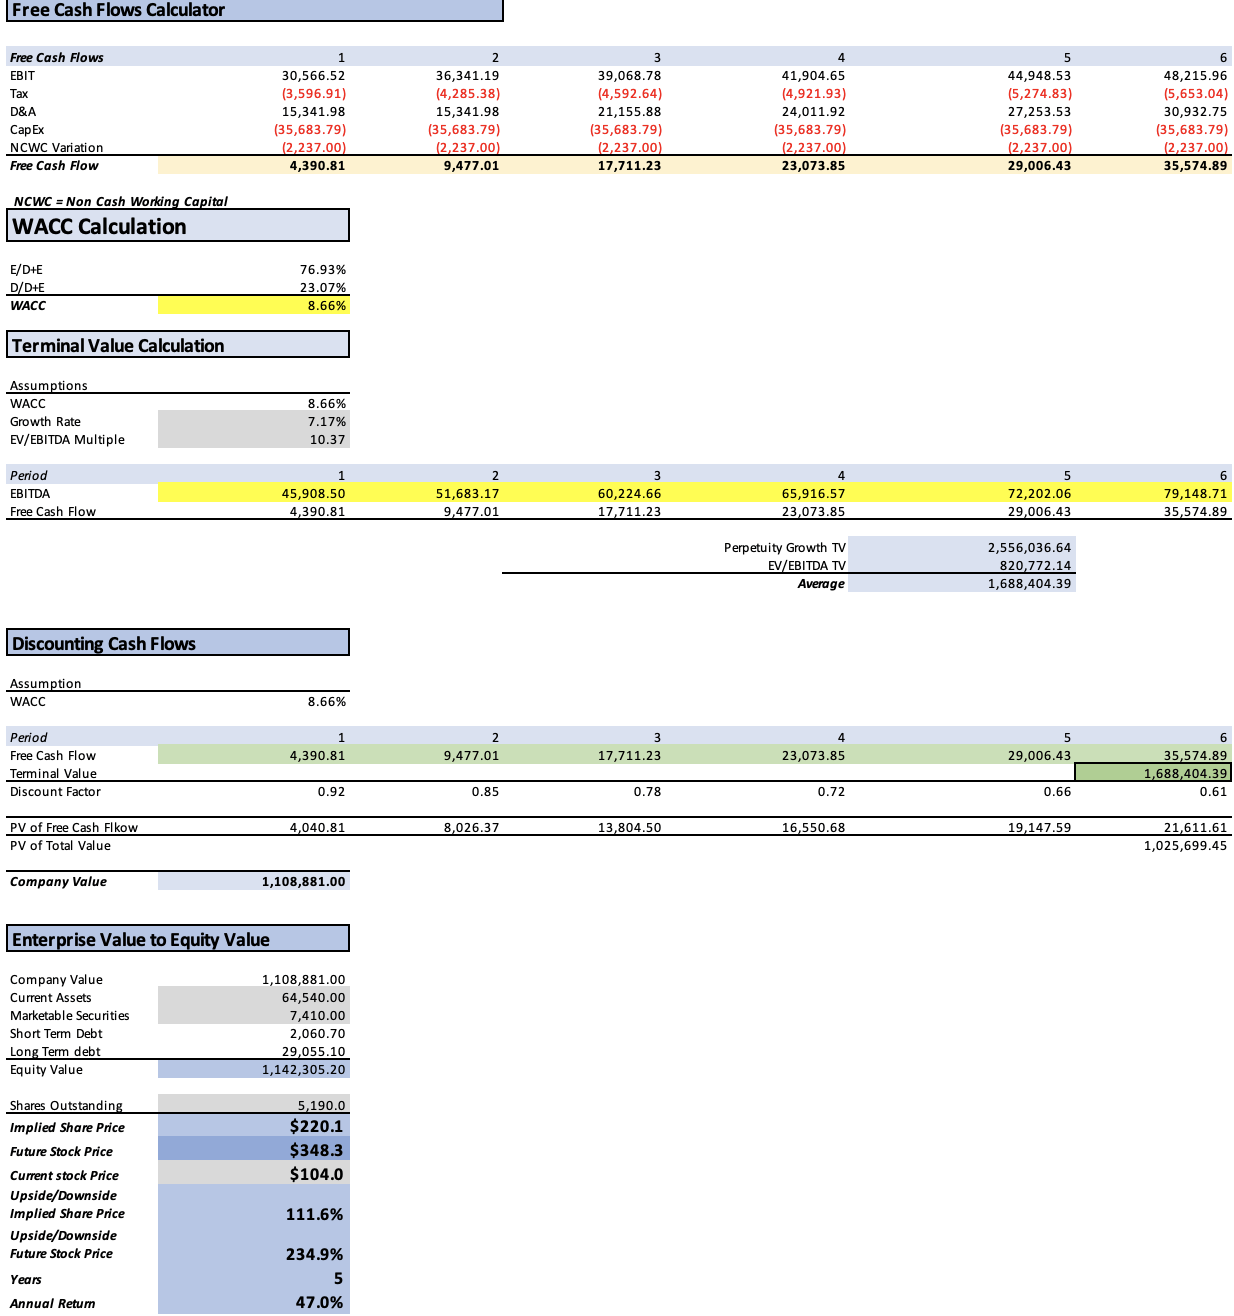
As evident, TSMC exhibits substantial upside potential if it attains analysts’ estimates. In this scenario, the stock could experience a notable 111.6% increase from its current stock price of $104. The projected future stock price, reflecting TSMC’s value in 2028, is $348.3, implying annual returns of 47% over a 5-year period.
My Estimates
Following the impressive results displayed in the previous model, the aim of this second model is to explore potential scenarios for TSMC’s stock under conservative assumptions.
In this second model, I project TSMC’s revenue growth to align with that of the worldwide semiconductor market, standing at 7.42%. Given that TSMC produces 90% of the world’s advanced semiconductors, it can be considered synonymous with “the market” in this context. Applying this growth rate to the company seems reasonable in my estimation.
For net income, I will be tying it to revenue with the average net income margin registered in 2017-2023 which is of 37.95%.
| Revenue | Net Income | Plus Taxes | Plus D&A | Plus Interest | |
| 2023 | $69,090.0 | $25,908.75 | $29,415.77 | $44,757.75 | $45,154.57 |
| 2024 | $74,216.5 | $27,831.18 | $31,598.42 | $46,940.40 | $47,337.22 |
| 2025 | $79,723.3 | $29,896.25 | $33,943.02 | $51,646.22 | $52,104.11 |
| 2026 | $85,638.8 | $32,114.55 | $36,461.59 | $55,478.37 | $55,970.23 |
| 2027 | $91,993.2 | $34,497.45 | $39,167.04 | $59,594.86 | $60,123.22 |
| 2028 | $98,819.1 | $37,057.17 | $42,073.24 | $64,016.80 | $64,584.37 |
| ^Final EBITA^ |
Author’s Calculations
As illustrated in this model, TSMC’s fair price is projected to be $146.4. This reflects a notable increase in the forecasted fair price compared to the previous model, where it was $124.90, and the model prior to that one, which had a fair price of $123.43.
The future price according to this model is $228.30, indicating a substantial 119.5% upside from the current stock price of $104. This translates into annual returns of 23.9%, a figure notably lower than the prior model labeled as “analysts’ estimates.”
Risks to Thesis
Several risks are associated with this bullish thesis. The first significant risk is geopolitical, as TSMC could indirectly face challenges from US chip export bans. This could result in major clients like Nvidia Corporation (NVDA) reducing contracts, particularly if they are unable to sell certain chips in the Chinese market due to new regulations.
Another noteworthy risk is TSMC’s dominance in the market, making it vulnerable to increasing competition. If competitors manage to produce at a similar cost as TSMC, the company may face challenges. However, it’s worth noting that I consider Intel Corporation (INTC) not a major risk, as TSMC was initially established to mitigate the risk of intellectual property theft associated with Integrated Device Manufacturers who simultaneously designing and producing chips.
The final risk to consider is the possibility of the US entering a recession. While in my S&P 500 (SP500) prediction for 2024 deems it unprovable and anticipates a flat market, the thin line between economic stability and recession raises concerns. In the event of a recession, consumer electronics sales could experience a significant slump, impacting TSMC’s performance.
Conclusion
In conclusion, the in-depth examination of TSMC through multiple financial models yields compelling insights into the company’s future prospects. The initial model, grounded in current analyst estimates, paints an optimistic picture, projecting a significant upside potential and substantial annual returns. With a fair price of $220.1 and a future price of $348.3, these results affirm a robust outlook for TSMC.
Contrastingly, the second model, designed to explore conservative scenarios, introduces a nuanced perspective by aligning TSMC’s revenue growth with the worldwide semiconductor market. Despite the inherent risks, such as geopolitical challenges and potential competition, this model projects a fair price of $146.4 and a future price of $228.3, signaling a more conservative but still a notable upside from the current stock price of $104.
Bolstering this positive outlook is the unequivocal “Strong Buy” rating, emphasizing confidence in TSMC’s resilience and growth potential.
Be the first to comment