

J. Michael Jones/iStock Editorial via Getty Images
The Fed’s stress test results last week were generally positive and as expected. The annual measure of how well major financial firms could weather various extreme market scenarios did not send any shockwaves through the markets. Instead, its passage allowed many banks to announce new shareholder accretive activity plans. Bigger dividends and stock buybacks were announced in the hours after last Friday’s regulatory exercise.
Bank Dividend Hikes Post-Stress Test Results
Bloomberg TV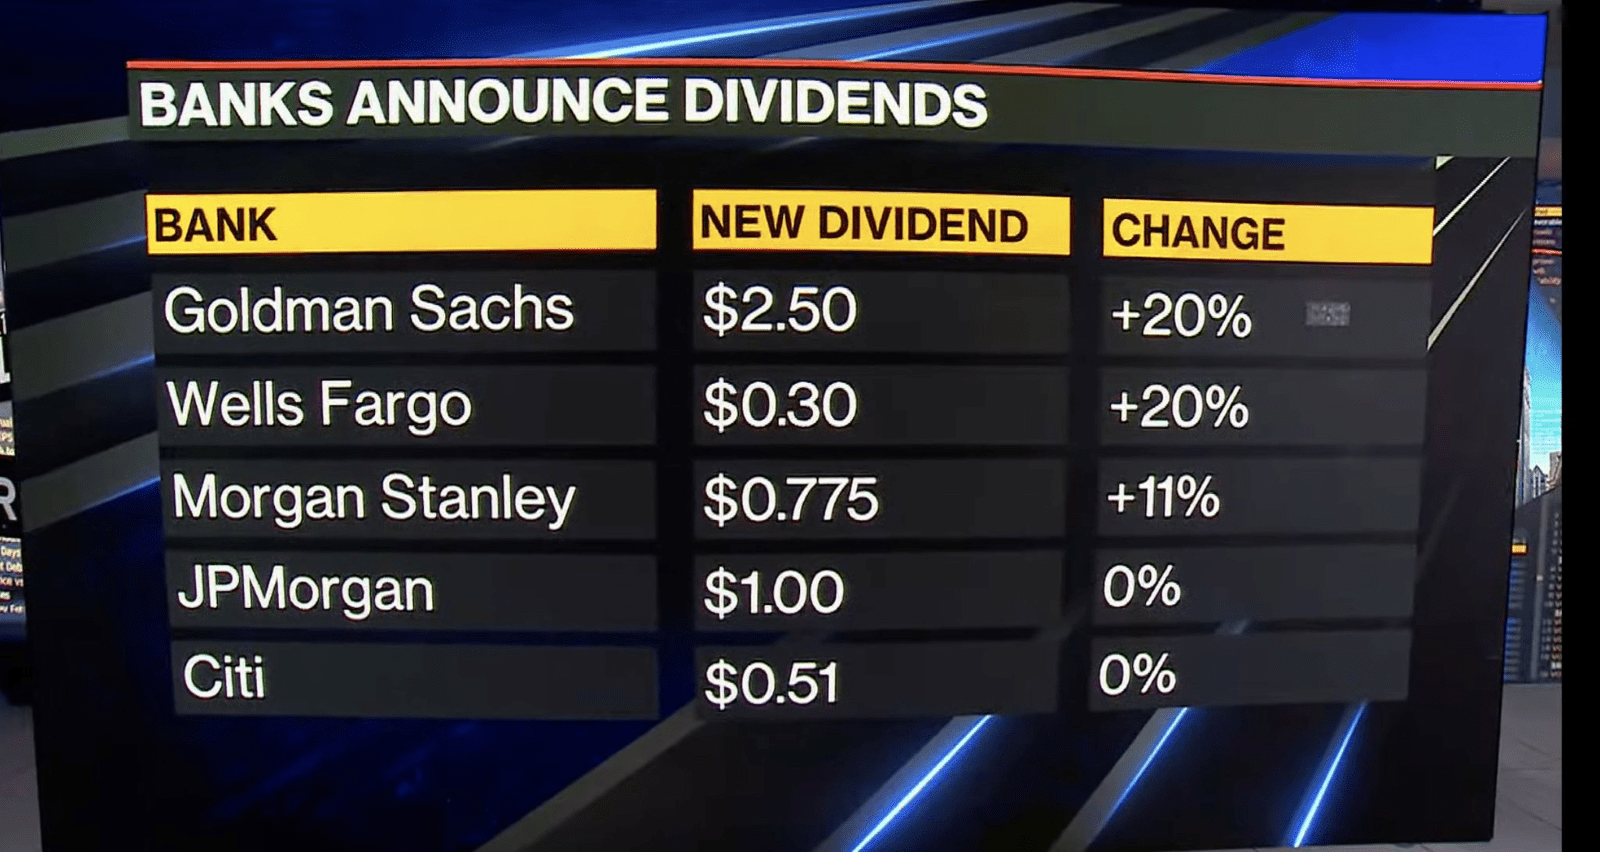
Still, JP Morgan Chase and Citigroup face stricter capital requirements – enough so that those two big money-center banks had to leave their dividend unchanged. One regional bank, Truist Financial (NYSE:TFC), hiked its dividend a whopping 8.3% to 52 cents beginning in the third quarter. CEO Bill Rogers said, “Truist’s strong stress test results, combined with this past year’s solid financial results and a successful integration, means that we are well-positioned to execute on our strategy,” according to CNBC.
Serving much of the Southeast U.S., the bank features positive demographic exposure across the “Smile” states and the sunbelt. According to Bank of America Global Research, Truist is a Charlotte, North Carolina based financial services company with more than $470 billion in assets. With a history dating back to the Civil War, and now the 6th largest bank in the US by deposits, TFC offers a wide variety of different financial products ranging from consumer and commercial banking to securities brokerage and asset management.
Truist is a popular regional bank trading play – seen as more sensitive to changes in interest rates than bigger national banks. The SPDR S&P Regional Banking ETF (KRE) is a popular broad way to play that narrative, and TFC is in that portfolio.
Regional Banking ETF Holdings
SSGA Funds
Turning to TFC’s fundamentals, analysts at BofA expect strong earnings growth in 2023 given its historically strong credit cycle performance and flexibility to manage its balance sheet effectively after completing its BBT/SunTrust merger in 2019. Truist also acquired Kensington Vanguard which BofA believes will drive synergies. Moreover, more Fed rate hikes should help this depository institution. Its next earnings report, according to Wall Street Horizon, is confirmed to happen on the morning of Tuesday, July 19 with a conference call to follow.
BofA sees EPS topping $6 per share in the next two-plus years after a dip in 2022. With a P/E forecast to be under 10x at current prices and a rising yield, the fundamental backdrop looks good. But what do the charts say?
Truist Earnings, Valuation, Dividend Forecasts
BofA Global Research
The Technical Take
Over the last five years, TFC shares are unchanged. It’s a messy chart considering the broad market’s strong returns in that time. This underperformer is below its pre-pandemic high but has recently found a few buyers. Let’s zoom in on the one-year chart.
TFC Five-Year Chart: Below Pre-Pandemic Peak, Support at $44
Stockcharts.com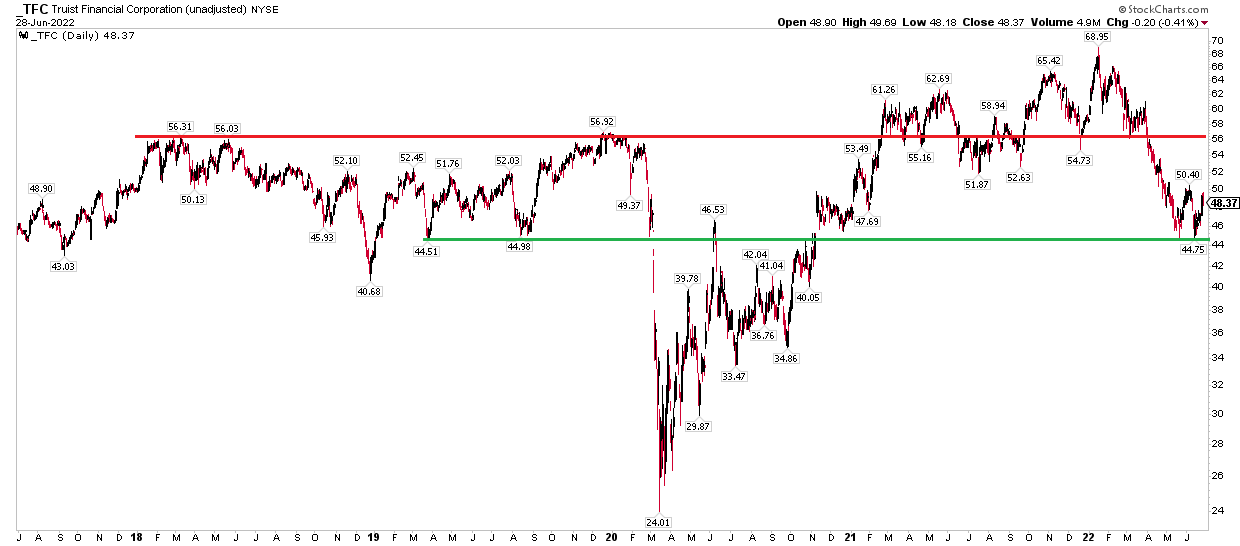
The stock made a bullish double bottom formation just below $45 in May and June. It is a key spot traders should watch. What’s encouraging is that it took place on improving RSI momentum – that’s a bullish divergence in technical analysis parlance. A move above $51 resistance would help confirm that bottom.
Still, the stock broke its rate of trend during an extremely bearish stretch in late March and early April. So there is significant overhead supply in the mid-$50s up to the mid-$60s. The technical picture is mixed.
TFC One-Year Chart: Bullish Double Bottom with Positive Divergence
Stockcharts.com
The Bottom Line
TFC’s fundamental outlook is favorable with positive demographic trends in the Mid-Atlantic and Southeast while higher interest rates should help this depository financial firm. The charts are mixed – a near-term bullish double bottom on positive divergence is good, but overhead supply/resistance might be problematic. Swing traders should consider going long here with a stop below the June low while long-term fundamental investors can own the stock for its earnings and dividend growth and good valuation.
Be the first to comment