

RobertKacpura
I think Tri-Continental Corporation (NYSE:TY) is a hidden gem of a closed-end fund. It generates high total returns and pays a 4% distribution. In good years, investors are rewarded with special distributions that could be as high as $3.64 / share like in 2021.
Fund Overview
The Tri-Continental Corporation is a closed-end fund (“CEF”) that aims to provide long-term capital appreciation with current income. It primarily invests in equities, but has the flexibility to invest across a company’s capital structure. The Fund has $1.5 billion in assets.
Tri-Continental was established in 1929 and traces its roots to J. & W. Seligman & Co., a prominent investment firm at the time. The fund is currently managed by Columbia Management Investment Advisers, LLC (“Columbia Management”), a subsidiary of Ameriprise Financial (AMP) that acquired the assets of Seligman & Co in 2008.
Strategy
The TY fund has a flexible investment charter that allows it to invest in all types of securities including common stocks, bonds (including high yield bonds and convertible bonds), preferred stocks, and any other securities the investment manager deems best suited to achieve its investment objectives. The fund may invest up to 25% of assets in foreign securities, and may employ leverage to enhance returns.
Portfolio Holdings
As of September 30, 2022, the fund held 242 positions and the top 10 positions account for 20% of the fund’s assets. Figure 1 shows the top 10 holdings of the fund.
Figure 1 – TY fund top 10 holdings (columbiathreadneedleus.com)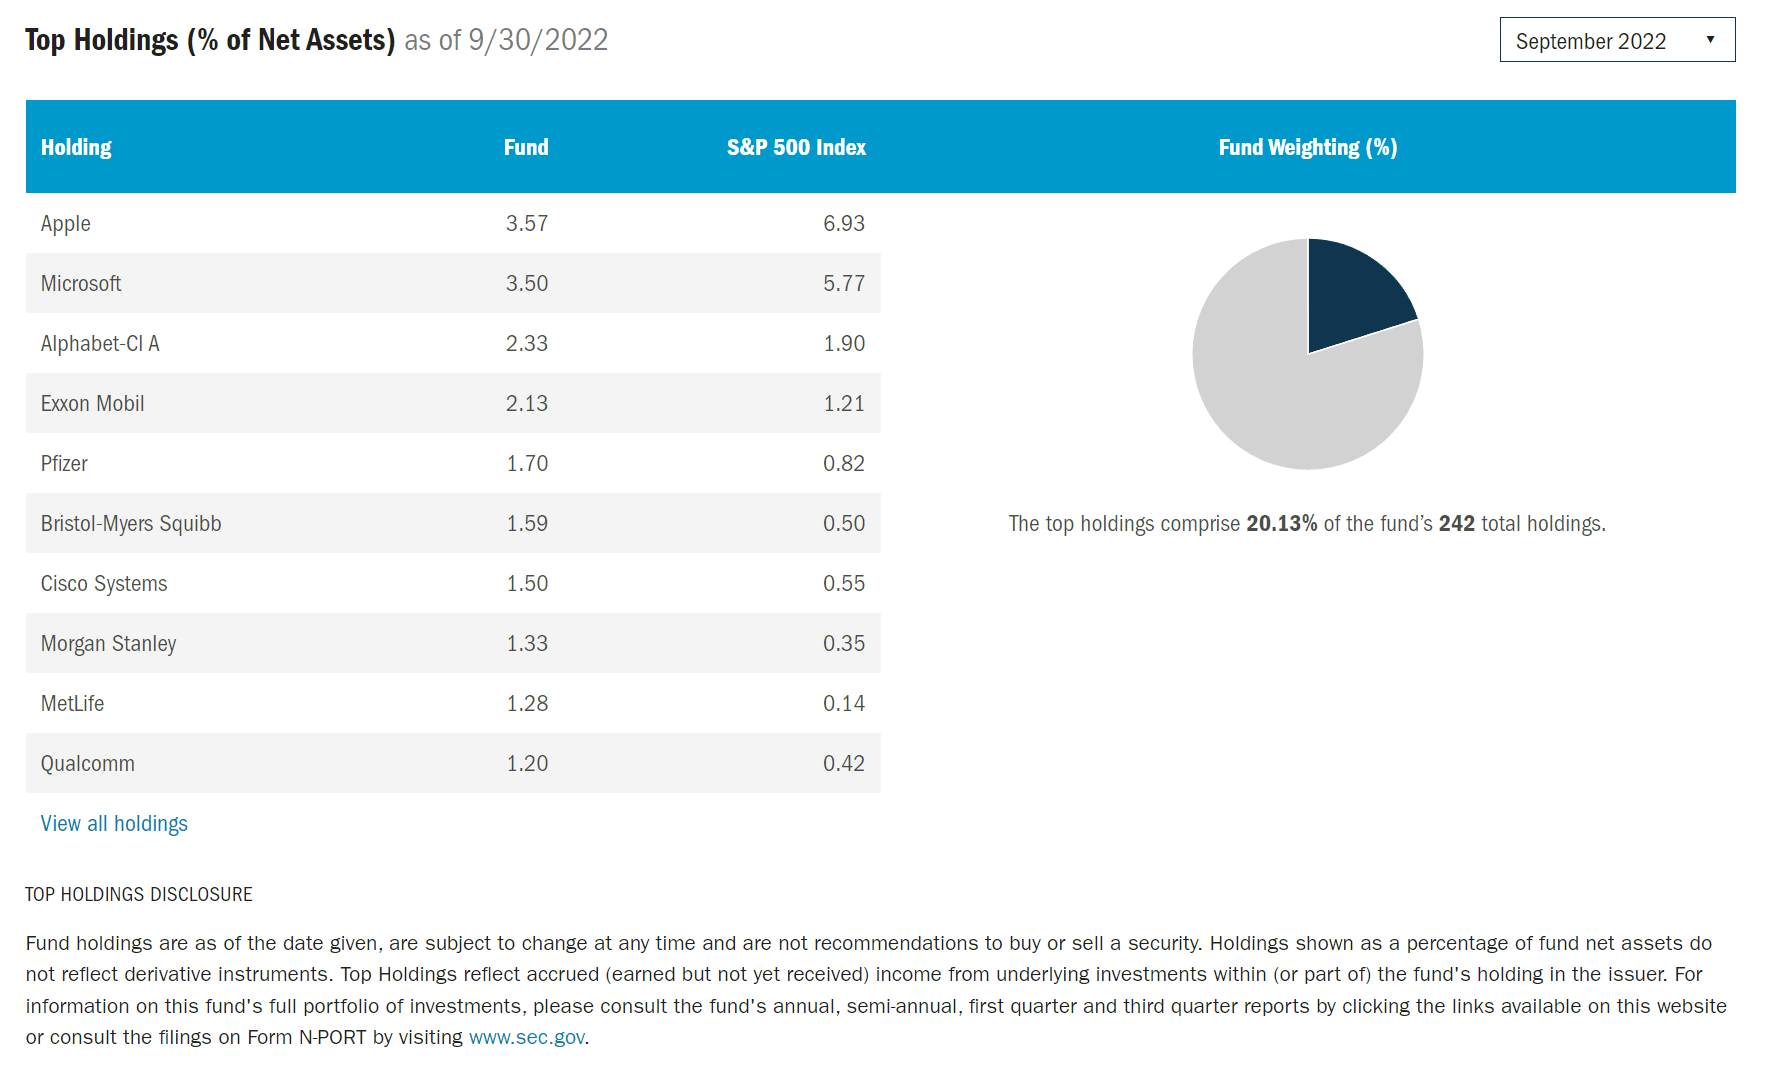
The fund’s asset class allocation is shown in Figure 2. As of September 30, 2022, the fund was 74% invested in equities, 19% in fixed income, and 7% in other assets.
Figure 2 – TY fund asset allocation (morningstar.com)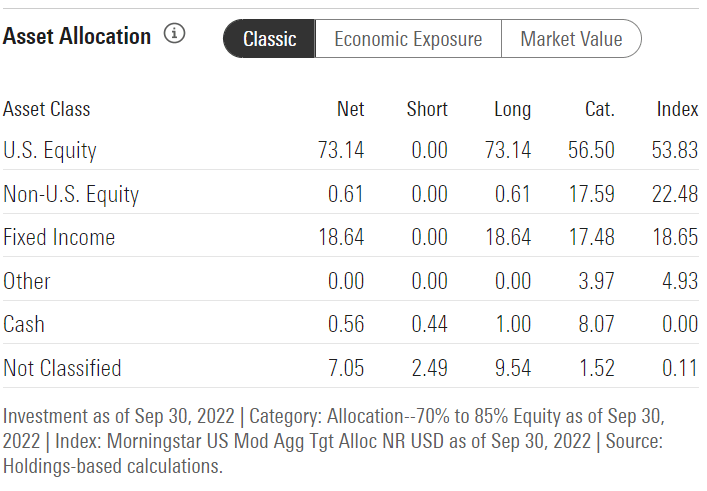
The fund’s sector allocation is shown in Figure 3. Relative to the S&P 500, the fund is overweight Utilities, Real Estate, Financials, and Energy. It is underweight Consumer Discretionary, Communications, Industrials, Technology, and Healthcare.
Figure 3 – TY fund sector allocation (morningstar.com)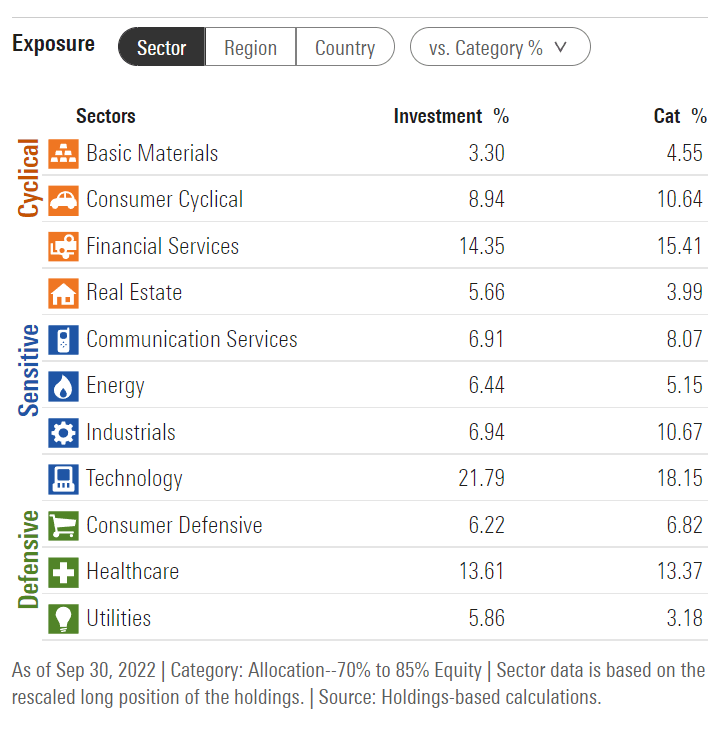
The Vanguard S&P 500 ETF’s (VOO) sector allocation is shown in Figure 4 for comparative purposes.
Figure 4 – VOO ETF sector allocation (vanguard.com)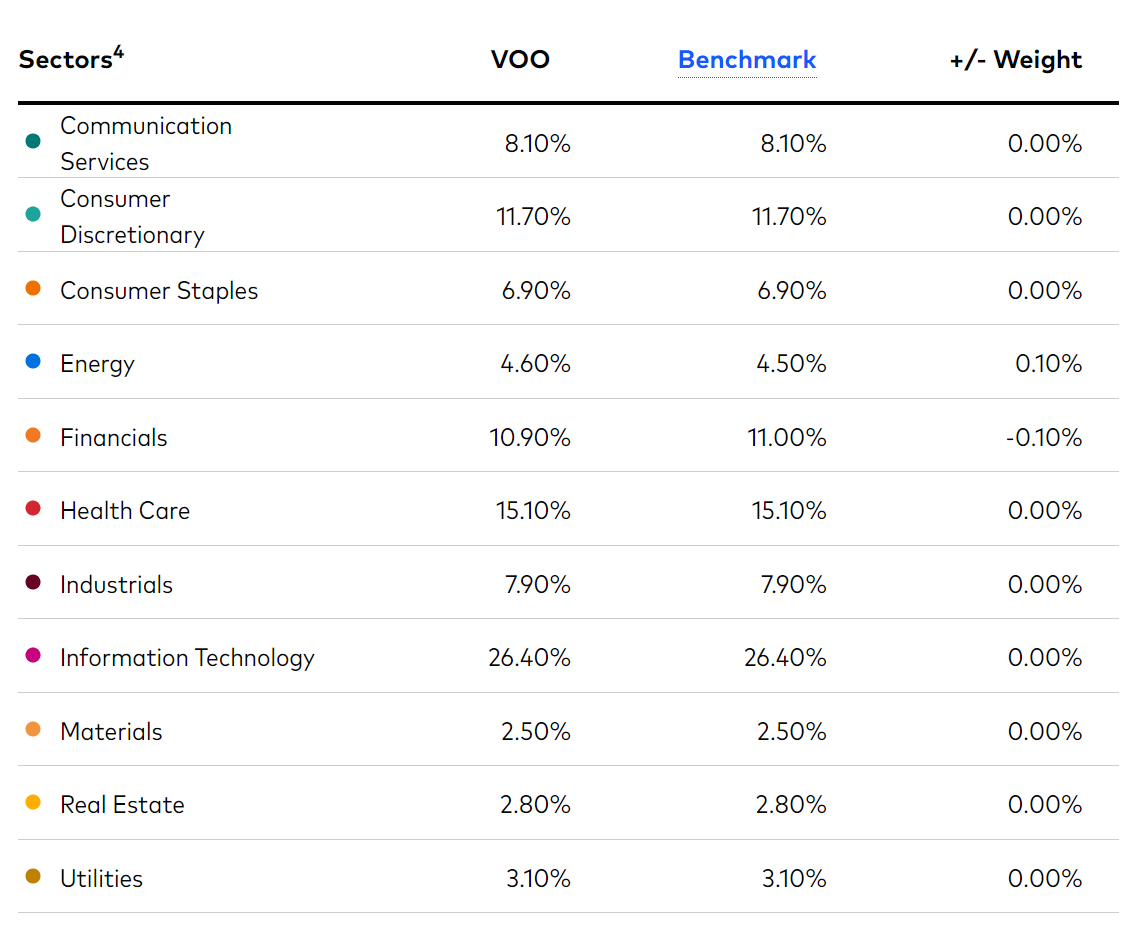
Returns
Tri-Continental Corporation has generated strong historical performance with 3/5/10 Yr Average annual returns of 7.7%/8.1%/10.6% to September 30, 2022. This compares well to balanced funds like the Vanguard Balanced Index Fund Admiral Shares (VBIAX) that has returned 3.5%/5.3%/7.3% over the same timeframes. However, compared to broad equity indices/funds, TY has slightly lagged. The VOO ETF has returned 8.2%/9.2%/11.7% for comparative purposes.
YTD, the TY fund has outperformed both VBIAX and VOO, with a -14.9% drawdown vs. -20.8 for VBIAX and -23.9% for VOO.
Figure 5 – TY fund returns (columbiathreadneedleus.com)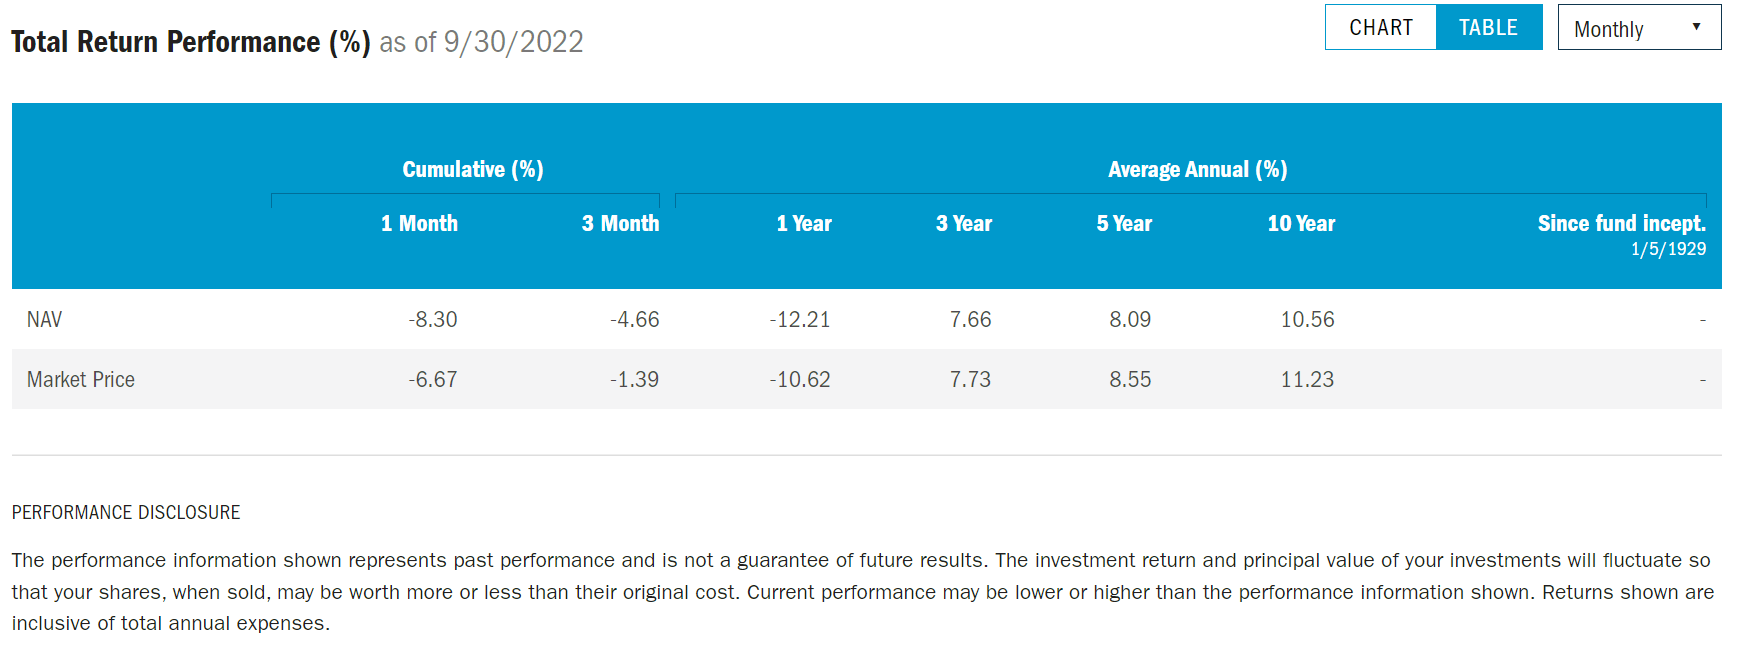
Distribution & Yield
The TY fund pays a quarterly distribution that is variable and dependent on the income from the underlying securities. It also pays periodic special distributions funded by capital gains. 2021 was an especially good year, as the fund paid a total of $4.6901/ share in distributions ($1.0549 in income and $3.6352 in capital gains).
So far in 2022, the TY fund has declared and paid $1.6248 in distributions per share ($0.8177 in quarterly distributions and $0.8071 in special distributions). The most recent quarterly distribution of $0.2695 / share was paid on September 20, 2022. Based on the quarterly distribution rate of ~$0.27 / share, the TY fund is yielding approximately 4.0%.
Figure 6 – TY fund 2022 distributions (Seeking Alpha)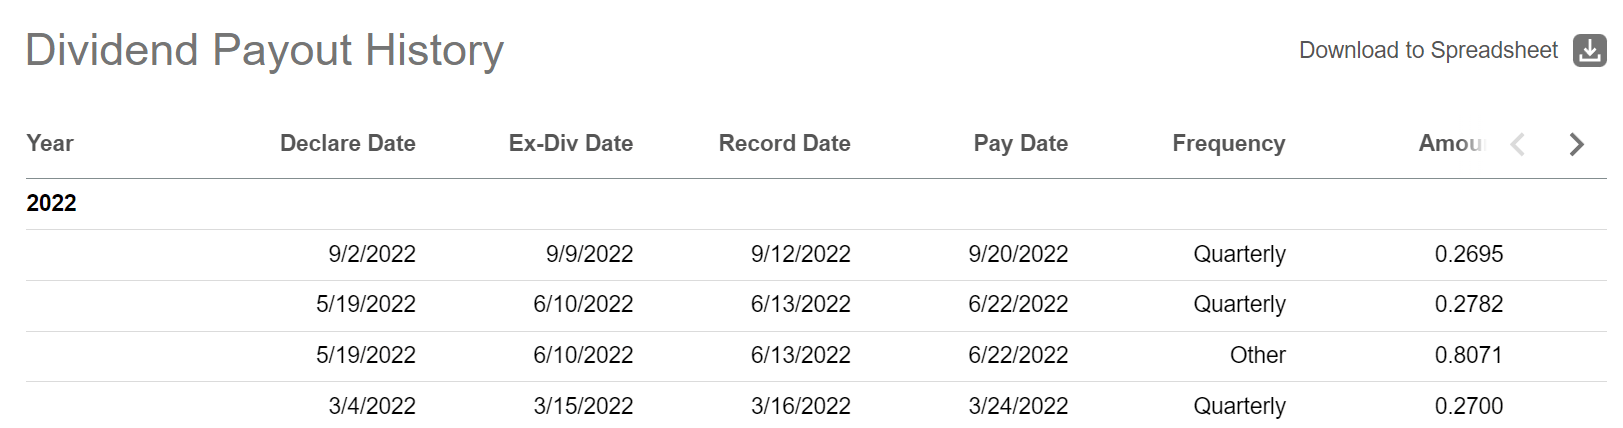
Model Of How Distributions Should Be Done
Unlike other high-yielding CEFs that I have recently reviewed (for example, the NMAI fund pays a $0.35 / share quarterly distribution on $12.43 in NAV), I believe Tri-Continental’s distribution model is prudent and sustainable. It pays a high, but reasonable quarterly distribution. It also rewards stockholders with special distributions if the fund has performed well. However, it doesn’t lock the fund into paying a NAV destroying rate during tough times.
Over the past 20 years, Tri-Continental’s share price has doubled from approximately $13 to $27 (Figure 7). At the same time, it has paid out a cumulative $23.16 in distributions (2002 to YTD 2022). So investors earned approximately 3.5% p.a. in price appreciation plus an annual distribution yielding between 1.3% ($0.17 / share in 2003) to 36.1% ($4.69 / share in 2021) on the initial $13 investment.
Figure 7 – TY price history (stockcharts.com)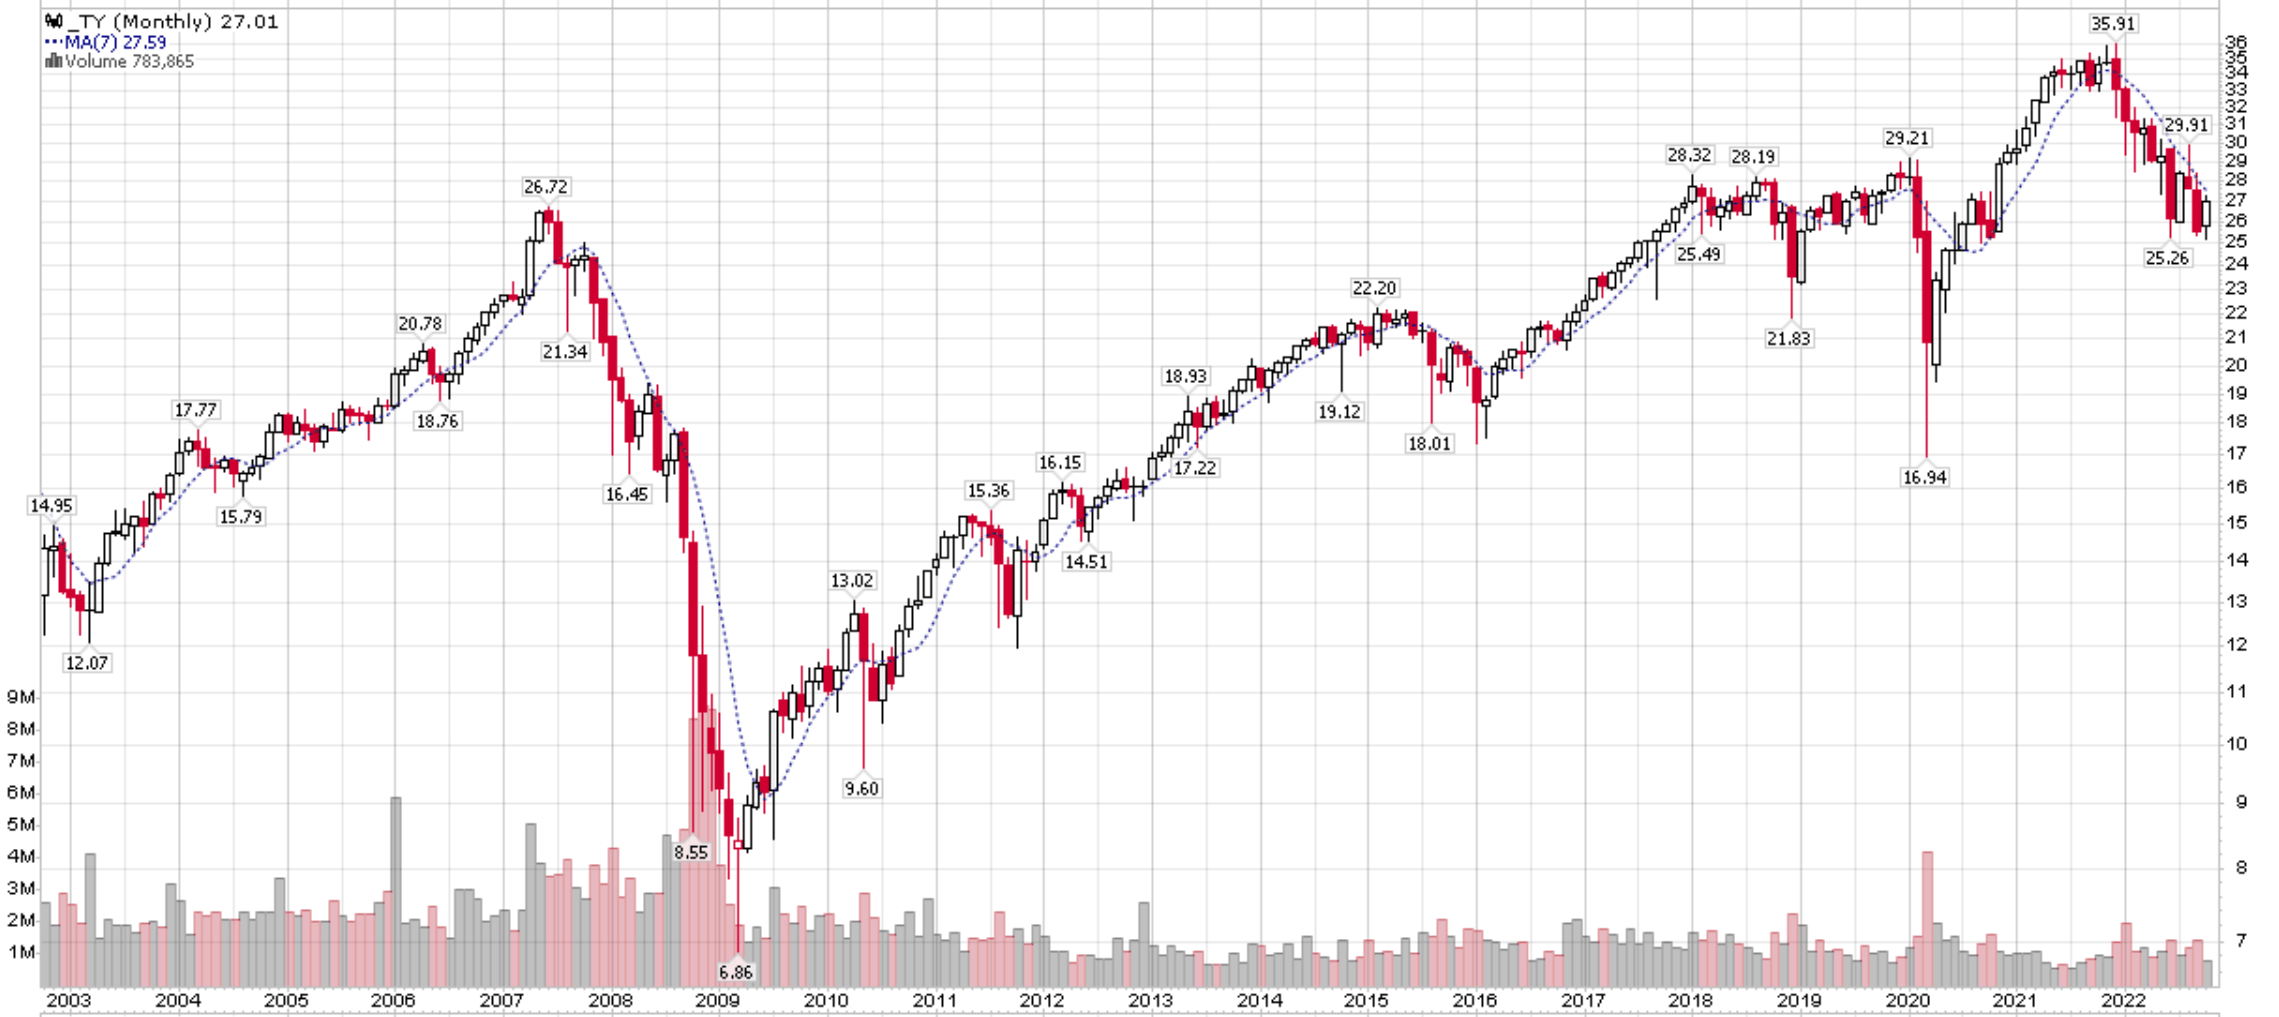
Fees
Tri-Continental charges a reasonable 0.61% annual expense ratio.
Persistent Discount To NAV
The TY fund trades at a persistent 10-15% discount to NAV. Currently, the discount is 9.9%. This is surprising, as I would have thought a balanced fund that returns 10%+ in total returns should be well received by investors. Unfortunately, investors seem to prefer funds that promise to pay unsustainably high distribution rates even if that distribution comes at the expense of NAV declines.
Figure 8 – TY discount to NAV (cefconnect.com)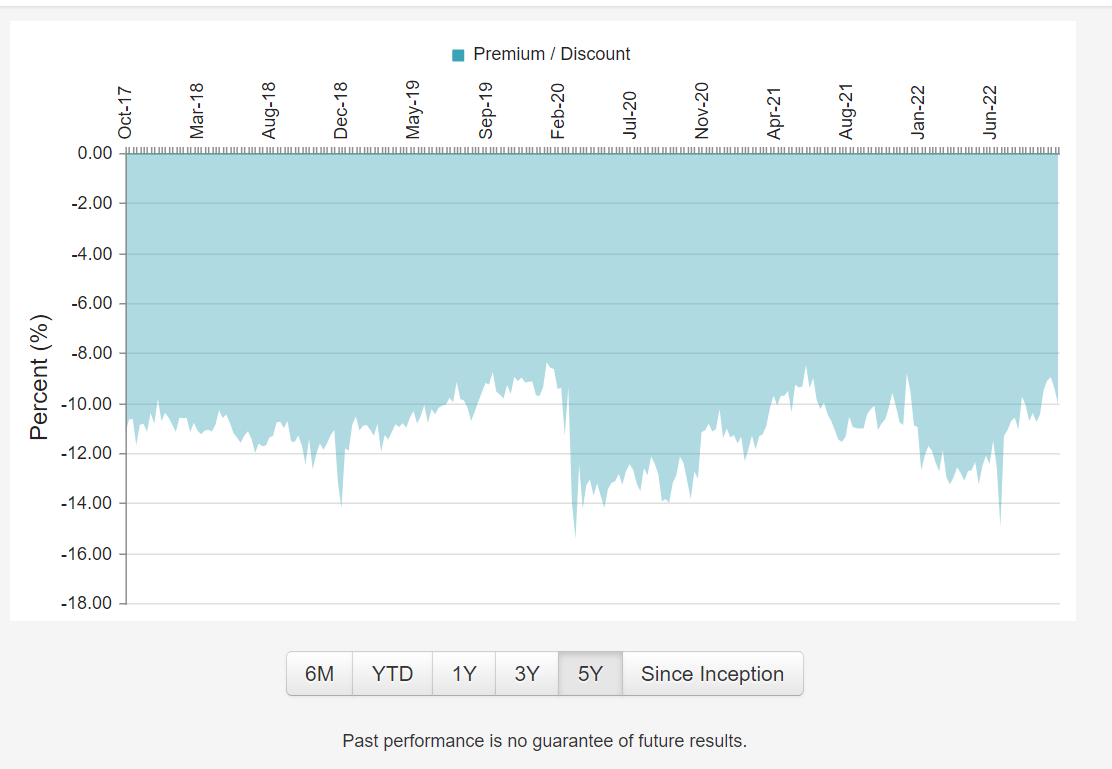
Conclusion
In summary, I think Tri-Continental is a hidden gem of a closed-end fund. It generates high total returns and pays a 4% quarterly distribution. In good years, investors are rewarded with special distributions as high as $3.64 / share in 2021. It also trades at a 10-15% discount to NAV, although the NAV discount has been persistent so investors shouldn’t expect it to close.
Be the first to comment