

Melpomenem
Introduction
The latest inversion of the Treasury yield curve has been a popular topic of conversation among market pundits and participants alike. In this blog, we explain what a curve inversion is, why it is important, and what (if any) bearing it has on bond prices going forward.
The 2s10s Yield Curve
The 2s10s yield curve is a measure of the difference in interest rates between the two-year and ten-year Treasury bonds, which, as Figure 1 shows, generally tend to trend together with 10s yielding a premium to 2s. However, on rare occasions, the front end of the curve can become inverted as a result of Federal Reserve (Fed) policy intervention via raising short-term rates. Historically, an inverted yield curve has been a reliable predictor of an impending economic recession.
Figure 1: Government Bond Yields12/31/1976 – 12/12/2022
Simplify Asset Management; Bloomberg.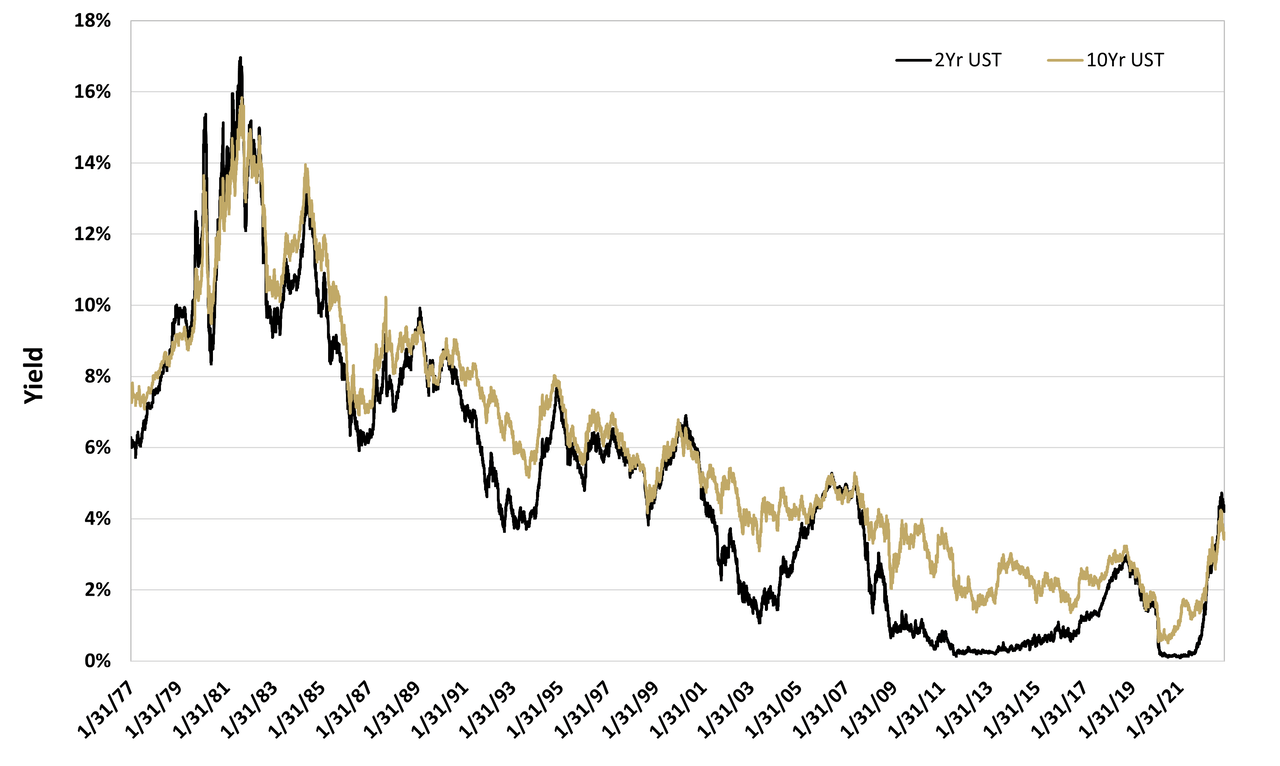
Do Yield Curve Inversions Provide an Opportunity for Bond Investors?
The 2s10s yield curve has inverted several times in the past, including before the recessions of the early 1980s, early 1990s, early 2000s, before the Great Financial Crisis, and briefly in 2019 preceding the COVID crisis. As shown in Figure 2 below, the yield curve inverted several months before the onset of the recession, providing a useful (and sometimes underappreciated) warning for investors and policymakers.
Figure 2: Spread Between 2yr & 10yr US Treasury Yields12/31/1976 – 12/12/2022
Simplify Asset Management; Bloomberg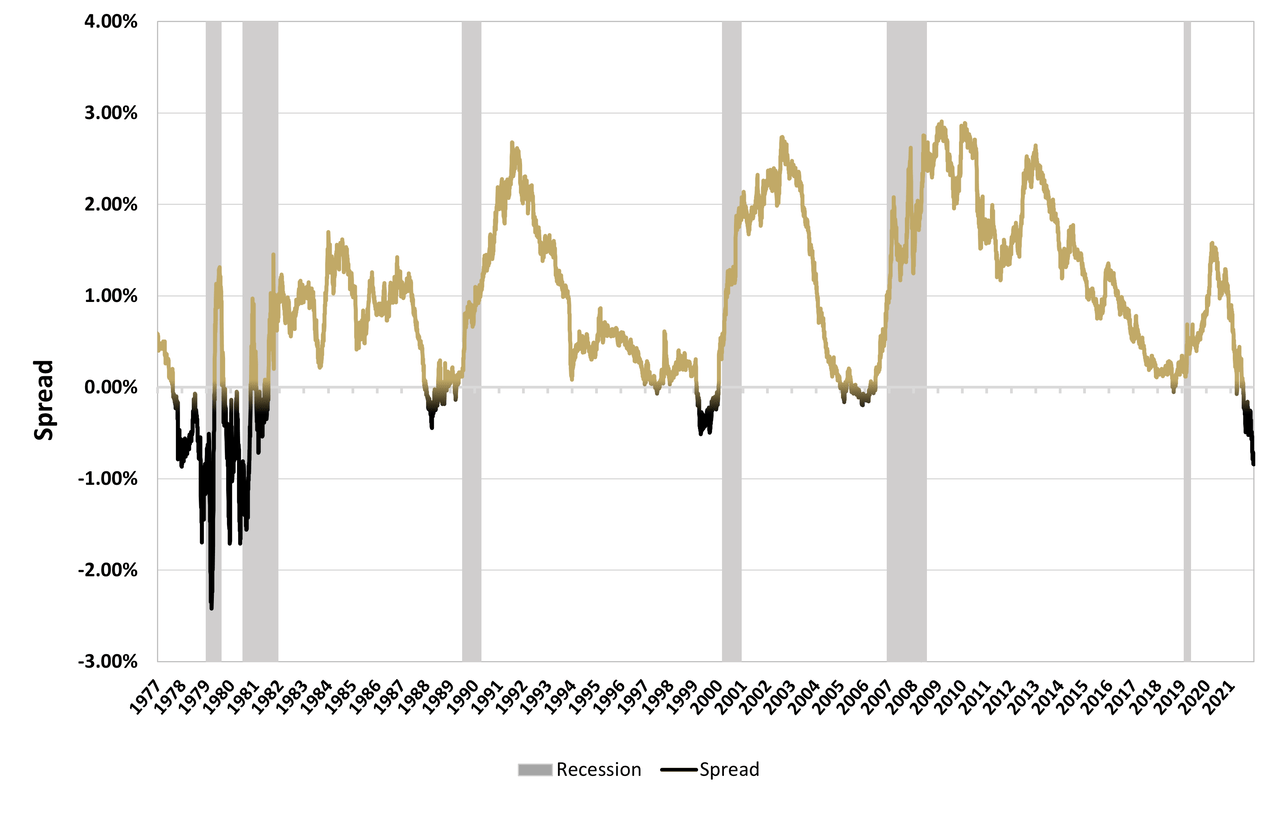
With the 2s10s curve having inverted once again in April of 2022, what might we expect for bonds going forward? First, we’ll assess the average rolling return for on-the-run 2 and 10-year US Treasuries in Figure 3 below.
Figure 3: Average Rolling Returns for On-the-Run US Treasuries12/31/1976 – 11/11/2022
12 and 24-month rolling total return calculations end on 12/10/2021 and 12/12/2019, respectively. (Simplify Asset Management; Bloomberg; Goldman Sachs)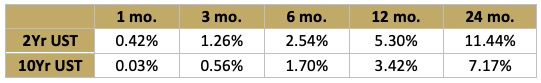
Next, we measure the average forward returns from the first day of a major yield curve inversion period to see if there was any advantage in purchasing bonds on these dates relative to any random starting point in the full sample. Figure 4 shows the results from the seven dominant inversion periods shown in Figure 2. Initial near-dated forward rolling returns were, on average, lower than the average forward returns during any market environment (highlighted in red).However, longer-dated holding periods following an inversion offered, on average, forward returns that outperformed the average forward returns for the full observation period (highlighted in green). It is worth acknowledging that preconditions for each inversion were vastly different and as such, so we have posted the respective returns for each event in Figure 4 to help elucidate the variability within the average across macro environments.
Figure 4: Rolling Returns for On-the-Run US Treasuries After Initial Curve Inversions12/31/1976 – 12/12/2022
12 and 24-month rolling total return calculations end on 12/10/2021 and 12/12/2019, respectively. (Simplify Asset Management; Bloomberg; Goldman Sachs)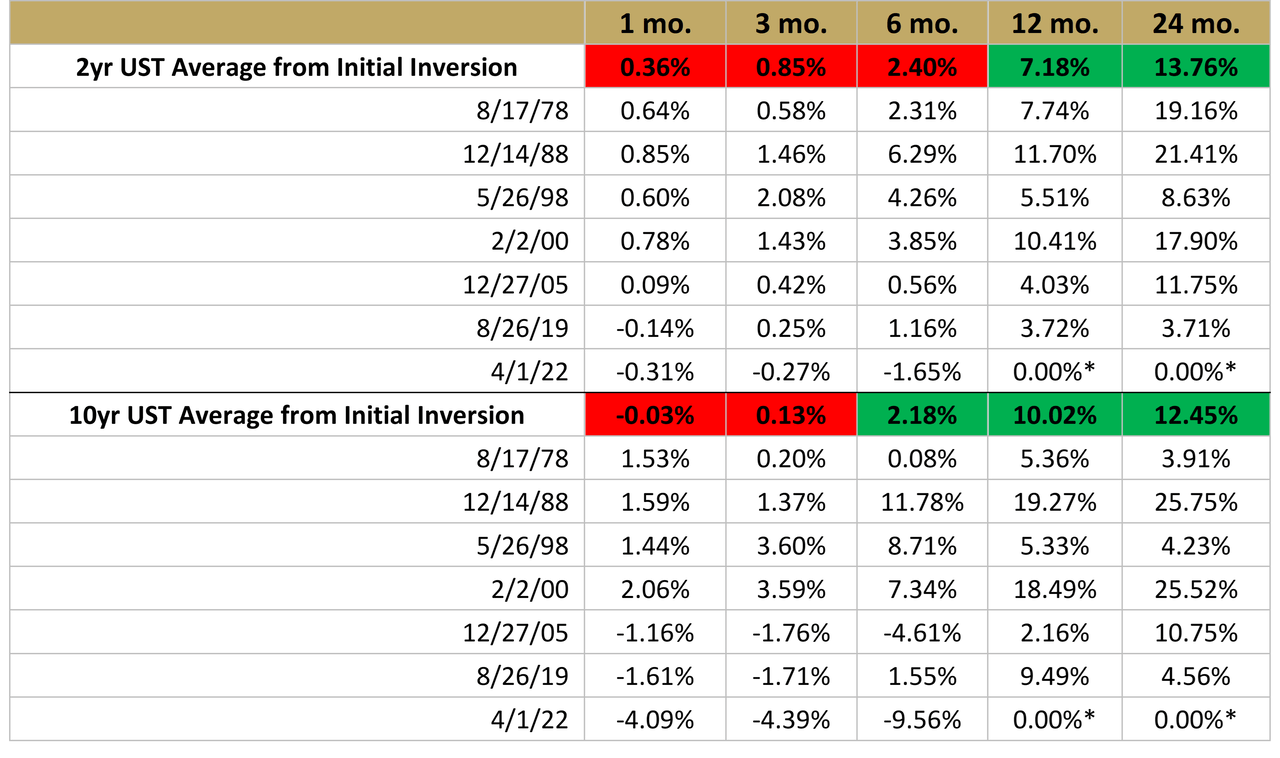
Patience for the Peak
What if you had entered the trade at the widest point of the inversion rather than the beginning? Figure 5 shows just how strong those forward returns were. In all forward return assessments, an investment in either the 2-year or 10-year Treasury resulted in above-average returns. Again, we present the full scope of data for context across time periods.
Figure 5: Rolling Returns for On-the-Run US Treasuries from Peak Curve Invertedness12/31/1976 – 12/12/2022
12 and 24-month rolling return calculations end on 12/10/2021 and 12/12/2019, respectively. (Simplify Asset Management; Bloomberg; Goldman Sachs)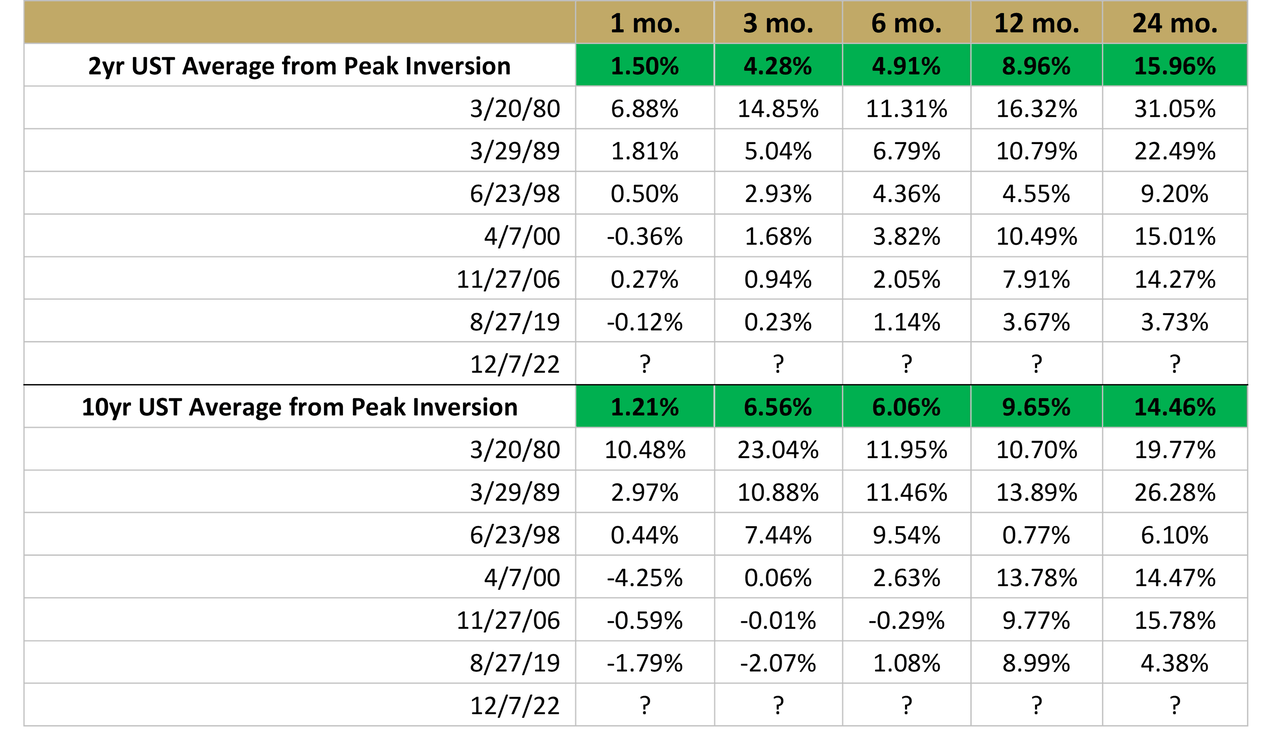
Most recently, the 2s10s yield curve inverted on April 1st of 2022 and widened to a spread of 84 basis points in early December before narrowing modestly by the time of this publication. The average time between the beginning of a curve inversion and its maximum width since 1977 is approximately seven and a half months. We are now eight months inverted and counting.
Parting Words
We have discussed why the yield curve inversion is important to investors while showing that such an event, despite not offering an immediate boon for bond investors, does support both intermediate and long-term forward return outperformance. Further, we have also demonstrated that bond price returns following the peak of a yield curve inversion tend to produce above-average forward-looking returns across all time horizons.
Simplify Asset Management Inc. is a Registered Investment Adviser. Advisory services are only offered to clients or prospective clients where Simplify Asset Management Inc. and its representatives are properly licensed or exempt from licensure. SEC registration does not constitute an endorsement of the firm by the Commission, nor does it indicate that the advisor has attained a particular level of skill or ability. Be sure to first consult with a qualified financial adviser and/or tax professional before implementing any strategy. This website and information are not intended to provide investment, tax, or legal advice.
This website is solely for informational purposes and does not intend to make an offer or solicitation for the sale or purchase of any specific securities, investments, or investment strategies. These materials are made available on an “as is” basis, without representation or warranty. The information contained in these materials has been obtained from sources that Simplify Asset Management Inc. believes to be reliable, but accuracy and completeness are not guaranteed. This information is only current as of the date indicated, and may be superseded by subsequent market events or for other reasons. Neither the author nor Simplify Asset Management Inc. undertakes to advise you of any changes in the views expressed herein.
Past performance is no guarantee of future returns. Investing involves risk and possible loss of principal capital.
Unless otherwise noted, any performance returns presented in these materials reflect hypothetical performance. Hypothetical strategies and indices presented are unmanaged, do not reflect any fees, expenses, transaction costs, commissions or taxes, and one cannot invest directly in any of these. The results presented should not be viewed as indicative of the adviser’ skill and do not reflect the performance results that were achieved by any particular client. During this period, the adviser was not providing advice using this model and clients’ results may have been materially different. Hypothetical model results have many inherent limitations, some of which, but not all, are described herein. One of the limitations of hypothetical performance results is that they are generally prepared with the benefit of hindsight. In addition, hypothetical trading does not involve financial risk, and no hypothetical trading record can completely account for the impact of financial risk in actual trading.
Editor’s Note: The summary bullets for this article were chosen by Seeking Alpha editors.
Be the first to comment