

Igor Borisenko/iStock via Getty Images
Investment Thesis
Tractor Supply Company (NASDAQ:TSCO) opened its first store in 1938 and is the largest rural lifestyle retailer in the United States. The company is aggressively growing its store footprint and as of December 25, 2021, the Company operated 2,003 Tractor Supply stores and 178 Petsense. Additionally, the company has been making considerable investments in enhancing its online selling and marketing capabilities.
TSCO is proving adept at using its considerable muscle and industry knowledge to offer customers the assortment of products they want at competitive prices, keeping them happy, managing to extract better margins and generating solid cash that is being channeled to fund growth and increase shareholders distributions.
The Formula for Success: TSCO Gets the Recipe Right
Building an Exceptional Footprint: Deft Exploitation of the Traditional and the Digital to Deliver Value.
TSCO is engaged in relentless expansion and improvement of its vast geographical and digital footprint. In 2011, after 72 years in business, Tractor Supply Company celebrated the opening of its 1,000th store. Over the past ten years, it grew considerably with Tractor Supply stores reaching 2,003 and 178 Petsense retail stores in 49 states at the end of fiscal 2021. In 2021, it opened 80 new Tractor Supply stores in 27 states and seven new Petsense stores in four states. In 2020, it opened 80 new Tractor Supply stores in 31 states and nine new Petsense stores in three states. This resulted in a selling square footage increase of approximately 4% in each fiscal 2021 and fiscal 2020. Its nine distribution facilities, located in various states represent a total distribution center capacity of 6.1 million square feet.
Through its online selling websites and mobile applications, it offers an extended assortment of products beyond those offered in-store and drives traffic into stores through buy online and pickup in-store, and ship to store programs. Its digital capabilities provide the convenience to allow customers to engage anytime, anywhere. Its mobile app downloads exceeded 2 million as of the end of the year 2021.
Identifying and focusing on a market niche
Focusing on its specialized market niche of customers living the rural lifestyle, Tractor Supply Company offers an extensive mix (approximately 16,000 to 22,000 products per store as well as over 170,000 products online) of basic products necessary for the maintenance and care of the home, farm, ranches, pets, and animals; serving farmers, livestock and pet owners, ranchers, gardeners, and suburban and rural homeowners, as well as contractors and tradesmen and all those who enjoy living the rural lifestyle.
Great Customer Service
Through its more than 46,000 motivated, well-trained team members; and the use of technology, and service enhancements, it offers increased customer-centric experiences with offers to buy in-store, buy online, pickup in-store, curbside pickup, or expanded target markets outside of current retail store locations. To date, it has enrolled nearly 24 million members in its Neighbor’s Club loyalty program. Tractor Supply actively seeks to remain in the communities’ good books through its backing for local animal shelters, area 4-H clubs, FFA chapters, and more.
Mastery of Logistics
Careful selection of the locations of distribution facilities, use of enterprise resource planning system and transportation management system, and warehouse and labor management tools help minimize logistics costs, track merchandise, effect prompt and efficient distribution of merchandise to stores and deliver products ordered through the websites and mobile application to customers’ homes or offices, and track merchandise from initial order through to the sale.
Marketing
TSCO’s strategy is to expand and deepen its customer base by providing personal, localized, and memorable customer engagements and digital shopping experiences; consistently offer products at competitive prices complemented by strategically planned promotions throughout the year through various traditional, digital and social media initiatives.
Seriously Investing – A Cash War Chest Put to Good Use
TSCO investment in new stores, store remodels and the outside side lot improvements, information technology, and other strategic initiatives used $627.3 million and $292.2 million in fiscal 2021 and 2020, respectively. Investment in inventories increased to $ 2,191 million in 2021 from $1,783 million in 2020. TSCO is currently investing about $100 million in the construction of a new distribution center in Ohio.
Investing activities and related capital expenditures for the years 2021 and 2020 were as follows (in millions):
|
Fiscal Year |
|||
|
2021 |
2020 |
Variance |
|
|
Existing stores |
$326.90 |
$73.70 |
$253.20 |
|
Information technology |
124.80 |
133.00 |
(8.20) |
|
Distribution center capacity and improvements |
93.30 |
23.40 |
69.90 |
|
New and relocated stores and stores not yet opened |
73.00 |
58.80 |
14.20 |
|
Corporate and other |
10.40 |
5.10 |
5.30 |
|
Total capital expenditures |
$628.40 |
$294.00 |
$334.40 |
Source: Tractor Supply Company Annual Reports 2021 & 2020
Comparative expenditure on investing activities was $217.5 million in 2019, $278.5 million in 2018, $250.4 million in 2017, and $226.0 million in 2016.
With Its Remarkable Successes, TSCO is Proving That It Is a Master of The Game
TSCO is reaping from years of prudent investing, significantly improving key metrics.
Sales growth
Unprecedented customer demand has increased net sales significantly across all major product categories, channels, and geographic regions. Over the past five years, sales grew at a compounded annual rate of approximately 13.4%.
|
2021 |
2020 |
2019 |
2018 |
|||||
|
Value |
Change |
Value |
Change |
Value |
Change |
Value |
Change |
|
|
Net Sales $billion |
$12.73 |
19.9% |
$10.62 |
27.18% |
$8.35 |
5.6% |
$7.91 |
9.0% |
Source: Tractor Supply Company Annual Reports 2021, 2020, 2019 & 2018
The Covid-19 pandemic contributed to shifting consumer behavior trends as customers focused on the care of their homes, land, and animals, which resulted in growing demand for everyday merchandise.
Increasing profitability
Alongside growing sales, profit margins have been improving indicative of greater business efficiencies.
|
Year 2021 |
Year 2020 |
Year 2019 |
Year 2018 |
|||||
|
Value |
Change |
Value |
Change |
Value |
Change |
Value |
||
|
Gross profit |
$4.48 |
19.0% |
$3.76 |
31% |
2.87 |
6.3% |
2.7 |
|
|
Gross margin |
35.2% |
35.4% |
34.4 % |
34.2 % |
||||
|
Operating income |
$1.31 |
31.1% |
$996.9 |
34.1% |
743.2 |
6.0% |
701.73 |
|
|
Operating income as % of sales |
10.3% |
9.4% |
8.9 % |
9.4 % |
||||
|
Net Income |
$997.1 |
33.1% |
$749 |
33.3% |
$562.35 |
5.6% |
$532.36 |
|
|
Net income as % of sales |
7.83% |
7.05% |
6.7 % |
5.8 % |
||||
Source: Tractor Supply Company Annual Reports 2021, 2020, 2019 & 2018
Improving Sales Channel’s Performance
All sales channels have been registering improved performance. In 2021, more customers shopped at TSCO than ever before, spent more money per trip, and increased their trips to the stores. The company reached record sales per square foot.
|
Year 2021 |
Year 2020 |
Year 2019 |
Year 2018 |
|
|
Comparable store sales increase |
16.9% |
23.1% |
2.7% |
5.1% |
|
New store sales (% of total sales) |
2.5 % |
3.3 % |
2.8% |
3.8% |
|
Average transaction value |
$56.62 (up by 9.8 %) |
$51.90 (up by 12.2 %) |
$ 46.89 (up by 2.4 %) |
$ 45.85 (up by 2.8 %) |
|
Comparable store average transaction count increase |
7.1 % |
10.9 % |
0.3 % |
2.2 % |
Source: Tractor Supply Company Annual Reports 2021, 2020, 2019 & 2018
Mobile point of sale technologies and digital capabilities has increased traffic and conversion with online sales registering strong double-digit growth. Over the last two years (2021 & 2020), its omni-channel sales increased by 80%, complementing its store footprint. In 2021, digital business reached nearly $1 billion in sales and mobile app downloads hit more than 2 million.
Improving Working Capital Efficiency
TSCO is recording improvements in inventory turnover, demonstrating more efficient utilization of working capital.
|
2021 |
2020 |
2019 |
2018 |
|
|
Working capital |
$1,185.6 |
$1,514.89 |
$540.29 |
$856.29 |
|
Inventory turns (annualized) |
4.18 |
3.92 |
3.23 |
3.19 |
Source: Tractor Supply Company Annual Reports 2021, 2020, 2019 & 2018
A Powerful Cash Chest
This cash-rich Company maintains a strong liquidity position. Operating activities provided $1.14 billion and $1.39 billion in cash in 2021 and 2020, respectively. The $255.8 million decrease in net cash provided by operating activities in fiscal 2021, compared to fiscal 2020, is primarily driven by expenditure on inventory which increased by $407.9 million in 2021 compared to a $180.5 million increase in 2020.
TSCO ended fiscal 2021 with $878 million in cash, after returning $1.04 billion to stockholders through stock repurchases and quarterly cash dividends and no amounts drawn on its revolving credit facility. In 2020, it ended the year with $1.34 billion in cash and outstanding debt of $984.3 million, after returning $517.6 million to stockholders through stock repurchases and cash dividends. Cash flow from operations was $812 million in 2019 and $694 million in 2018. No amounts were drawn on its credit facility in 2021 and debt remained at about the same level as in 2020.
Improving Shareholder Value: Reaping from Years of Prudent Investing
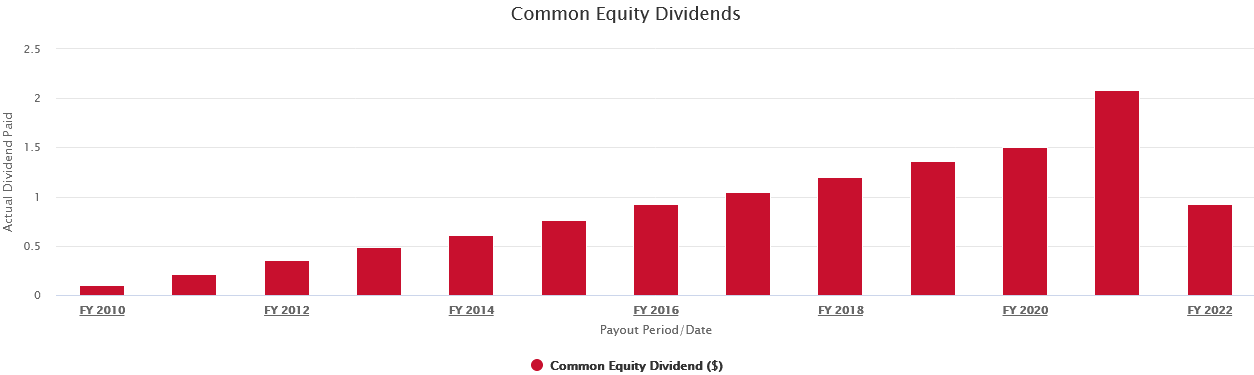
With the combination of profitable growth and strong cash generation, Tractor Supply has been enhancing its return to shareholders through the largest dividend increase in its history and expanded shares repurchase authorization. In fiscal 2021, the Company paid quarterly cash dividends totaling $239.0 million for the year, up from $174.7 million in 2020.
These payments reflect an increase in the quarterly dividend per share to $0.52 in fiscal 2021 from $0.40 in 2020. The company repurchased approximately 4.4 million and 3.4 million shares of common stock under the share repurchase program at a total cost of $798.9 million and $343.0 million in fiscal 2021 and 2020, respectively.
TSCO
Source: Dividend History
In January 2022, TSCO authorized additional share repurchases of $2.0 billion and approved a 77% increase in the quarterly dividend, marking the thirteenth consecutive dividend increase. As of December 25, 2021, the Company had repurchased 74.2 million shares of common stock for approximately $4.16 billion since the inception of its share repurchase program in 2007. The company intends to continue to pay a quarterly cash dividend.
|
2021 |
2020 |
2019 |
|
|
Net income per share |
$ 997.1 million |
$748.9 million |
$562.3 million |
|
Shares outstanding |
115.8 million |
117.4 million |
120.7 million |
|
Earnings per share |
$8.61 (up by 35.0%) |
$6.38 (up by 37.0%) |
$ 4.66(up by 8.1%) |
|
Total spend on Dividend |
$239.0 million |
$174.6 million |
$162.7 million |
|
Repurchased shares number |
4.4 million |
3.4 million |
5.4 million |
|
Average price of repurchased shares |
$183.07 |
$99.72 |
$99.05 |
|
Repurchased shares value |
$798.9 million |
$342.9 million |
$533.3 million |
|
Stock repurchases and quarterly cash dividends. |
$1.04 billion |
$517.5 million |
$696 million |
|
Dividends declared per common share outstanding |
$ 2.08 |
$ 1.50 |
$ 1.36 |
Source: Tractor Supply Company Annual Reports 2021 & 2020
The pricing of shares repurchased in 2021 indicate a progressive increase in share value.
|
First Quarter |
Second Quarter |
Third Quarter |
Fourth Quarter |
Total |
|
|
Total Number of Shares Purchased |
1,681,348 |
1,126,487 |
748,943 |
903,022 |
4,459,800 |
|
Average Price Paid Per Share |
$ 157.89 |
$ 181.83 |
$ 190.01 |
$ 222.76 |
$ 182.47 |
Source: Tractor Supply Company Annual Reports 2021
The company has significantly increased the amount of quarterly dividend paid out per share from $0.06 in March 2012, and $0.27 in March 2018, to $0.92 in March 2022.
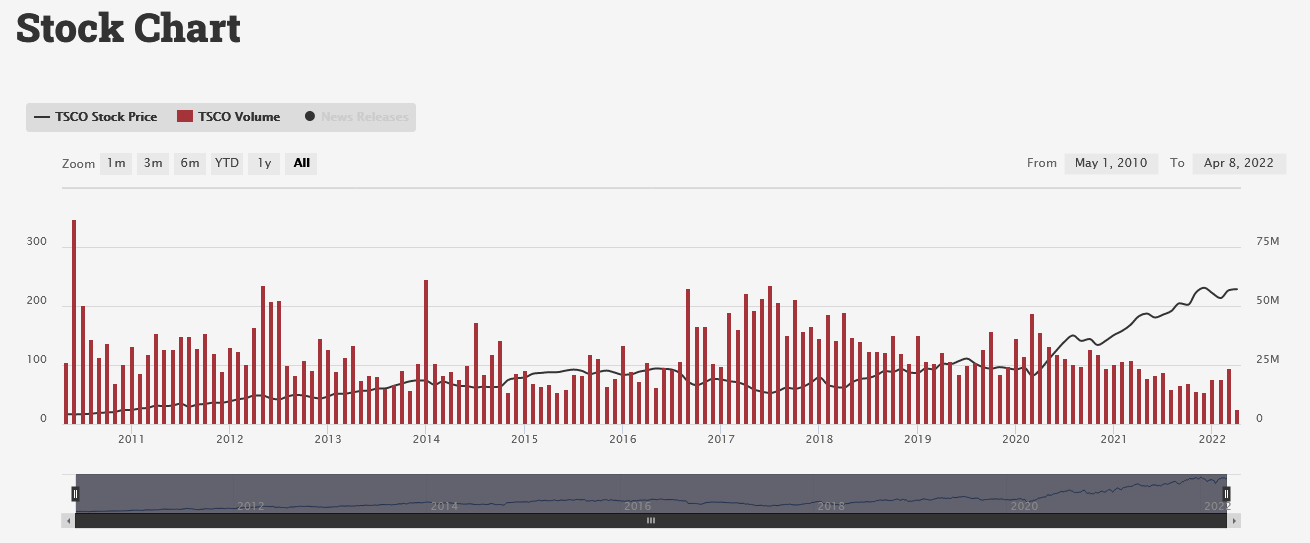
The market price for TSCO stock has been fairly volatile – experiencing significant price and volume fluctuations, although maintaining a general upward trend. Nevertheless, the combined effect of increased net income, dividend, and share buybacks has seen a rally in the performance of TSCO stock, more so in the last two years.
TSCO
The following graph which compares the cumulative total stockholder return from December 31, 2016, to December 25, 2021, with the cumulative total returns of the S&P 500 Index and the S&P Retail Index over the same period shows TSCO stock has been gaining on the S&P. The comparison assumes that $100 was invested in 2016, in TSCO stock, and in each of the foregoing indices and in each case assumes reinvestment of dividends.

TSCO
Source: Investor Relations
A Gritty Eye on Growth Opportunities Going Forward
TSCO believes that it has developed a proven method for selecting store sites and that there is a huge market and ample opportunity for new store growth in many existing and new markets. TSCO projects capital expenditures for 2022 to be in the range of $625 million to $675 million. The company plans to continue its ongoing expansion, with approximately 75 to 80 new Tractor Supply and 10 new Petsense stores planned for opening in 2022, a selling square footage increase of approximately 4%.
In 2022, TSCO will remodel more than 150 stores, transform the side lots in approximately 100 locations, open its ninth distribution center and begin construction of a new distribution center in Arkansas. In addition, it plans to continue ongoing improvements in technology and infrastructure at existing stores, enhancing digital and omni-channel capabilities to better serve customers.
In 2021, the company entered into an agreement to acquire Orscheln Farm and Home, LLC, a farm and ranch retailer with 167 retail stores in 11 states, in a $320 million cash transaction. TSCO is forecasting continued strong performance for 2022:
|
2022 (Company forecasts) |
|
|
Net Sales |
$13.7 billion (a 7.9% improvement on 2021) |
|
Net Income |
$1.06 billion (6.3% improvement on 2021) |
|
Comparable store sales increase |
3.5% |
|
Earnings per diluted share |
$9.35 (8.6% improvement on 2021) |
Source: Tractor Supply Company FORM 8-K, January 27, 2022
The company has set annual financial growth rate targets for fiscal 2022 to fiscal 2026.
|
Long-Term Targets |
|
|
Net Sales |
+6% – +7% |
|
Comparable Store Sales |
+4% – +5% |
|
Operating Margin Rate |
10.1% – 10.6% |
|
Earnings per Diluted Share |
+8% – +11% |
Source: Tractor Supply Company FORM 8-K, January 27, 2022
Conclusion: TSCO Set to Generate Positive Market Vibes in the Coming Years
The company has not been sitting on its laurels; it’s been perfecting its stratagems including choice of an assortment of merchandise, sourcing, pricing, store site selection and outlay, inventory management, logistics, and customer service. Ongoing opening of new stores, investment in technology, and good vendor relations are pointers to a stronger future.
By focusing on its specialized market niche of customers living the rural lifestyle, the company believes it has differentiated itself from general merchandise, home center retailers, pet retailers, specialty and discount retailers, independently owned retail farm and ranch stores, numerous privately-held regional farm store chains and farm cooperatives, as well as internet-based retailers, and other specialty retailers. By embracing technology, TSCO is further insulating itself from possible business disruption.
The company has successfully become adept at leveraging on its physical store assets, combined with its digital capabilities to offer customers convenience, dependability, variety, and low prices. The company reached record sales per square foot, double-digit percentage e-commerce sales growth; and an increase in average transaction value, earnings per share, and cash flow from operations in 2021.
This has been reflected in improved stock performance, better aligning the stock price to its intrinsic value. With the continuing fall in COVID-19 pandemic response costs: $63.3 million in 2021 as compared to $117.1 million in 2020, even more cash will be available for investment and for distribution to shareholders.
The existing healthy cash balances and expected cash flow from future operations should be adequate to fund operational and capital expenditure needs, as well as support TSCO’s dividend payout and share repurchase plans. Projected share repurchases for the year 2022 are estimated to be in a range of approximately $700 million to $800 million. The ongoing enhanced share repurchases and cash dividends to reward its shareholders are a demonstration of the company’s confidence in its financial health which is likely to jolt share prices further up.
Unless significant adverse changes in overall economic conditions that impact consumer spending, or changes in trade policies, tariffs, and other regulations occur, in the longer term, TSCO stock value should maintain its upwards trajectory.
With its solid, resilient business model, ongoing capital investment, good margins, and healthy cash generation, TSCO is set to soar to new heights in the coming years and its shares appear quite attractive to hold for the long term.
Be the first to comment