

JuSun
This article is part of a series that provides an ongoing analysis of the changes made to Wedgewood Partners’ 13F stock portfolio on a quarterly basis. It is based on David Rolfe’s regulatory 13F Form filed on 8/15/2022. The 13F portfolio value decreased ~18% from $709M to $579M this quarter. The holdings are concentrated with recent 13F reports showing around 30 positions. There are 22 securities that are significantly large (more than ~0.5% of the portfolio each) and they are the focus of this article. The largest five stakes are Apple Inc., Alphabet, Visa, Microsoft, and Meta Platforms. They add up to ~35% of the portfolio. Please visit our Tracking David Rolfe’s Wedgewood Partners Portfolio series to get an idea of their investment philosophy and our last update for the fund’s moves during Q1 2022.
Wedgewood has generated significant alpha since their 1992 inception: 11.55% annualized returns over the 30-year period compared to 9.83% annualized for the S&P 500 Index. David Rolfe also sub-advises Riverpark/Wedgewood Fund (MUTF:RWGIX) (MUTF:RWGFX) as portfolio manager, a mutual fund incepted in 2010.
New Stakes:
Pool Corp (POOL): POOL is a 1.84% of the portfolio position purchased this quarter at prices between ~$333 and ~$432 and the stock currently trades below that range at ~$312.
Stake Increases:
Taiwan Semiconductor (TSM): The 4.94% TSM stake saw a ~80% stake increase in Q3 2021 at prices between ~$108 and ~$125. That was followed with a two-thirds increase over the last two quarters at prices between ~$99 and ~$141. The stock currently trades well below their purchase price ranges at ~$73. There was a marginal increase this quarter.
Note: Their Q3 2021 letter had the following regarding their Taiwan Semi thesis: market is pricing in a down-turn in the semi-cycle. But they see strong demand and supply constraints in the leading nodes which should enable price increases.
PayPal Holdings (PYPL): PYPL is a ~4% of the portfolio position purchased in Q3 2015 at prices between $33 and $39 immediately following its spinoff from eBay. Since then, the position was reduced by over 95% at prices between ~$32 and ~$305. Last quarter saw an about turn: ~80% stake increase at prices between ~$94 and ~$195 and that was followed with a ~23% increase this quarter at prices between ~$70 and ~$122. The stock currently trades at $84.26.
First Republic Bank (FRC): FRC is a 3.82% of the portfolio position purchased in Q3 2020 at prices between ~$101 and ~$119. The next five quarters saw minor trimming while in the last two quarters there was a ~35% stake increase at prices between ~$134 and ~$208. The stock currently trades at $135.
Note: they believe FRC is an exceptional growth company, although they are in the stodgy banking sector.
Booking Holdings (BKNG): The ~3% BKNG stake was purchased in Q1 2021 at prices between ~$1886 and ~$2462. Next quarter saw a ~17% stake increase at prices between ~$2172 and ~$2505. That was followed with a ~40% stake increase in Q4 2021 at prices between ~$2067 and ~$2648. The stock is now at ~$1669. There was a ~10% stake increase over the last two quarters.
Old Dominion Freight Line (ODFL): ODFL is a 2.57% of the portfolio position established in Q1 2021 at prices between ~$191 and ~$241. There was a one-third selling in Q4 2021 at prices between ~$283 and ~$364. This quarter saw a ~37% stake increase at prices between ~$232 and ~$320. The stock currently trades at ~$248.
Stake Decreases:
Apple Inc. (AAPL): AAPL is currently the largest position in the portfolio at 8.67%. The original stake was purchased in the 2005-2006 timeframe at prices between ~$1.25 and ~$3.50. The position was since sold down but the 2012-2013 timeframe saw a 4x stake increase at prices between ~$15 and ~$25. The next five years through 2018 had seen the stake reduced by ~85% at prices between $18 and $57 thru consistent selling almost every quarter. 2019-20 timeframe had also seen another 85% selling at prices between ~$38 and ~$137. The three quarters through Q3 2021 saw a further ~20% reduction at prices between ~$116 and ~$157. The stock is now at ~$151. Last three quarters have seen only minor adjustments.
Alphabet Inc. (GOOGL) (GOOG): The 7.72% GOOGL stake is the second-largest position in the portfolio. It was a small stake first purchased in 2007 at prices between ~$12 and ~$18. The next two years saw only minor adjustments. There was a ~6x stake increase in the 2010-2013 timeframe at prices between ~$12 and ~$28. That was followed with a ~85% reduction over the 2015-2018 period at prices between ~$25 and ~$56. 2019-20 timeframe had also seen a ~58% selling at prices between ~$53 and ~$91. Last five quarters saw another roughly one-third selling at prices between ~$86 and ~$150. The stock is now at ~$99. This quarter saw marginal trimming.
Visa Inc. (V): Visa is a 6.68% of the portfolio position built during the 2008-2010 timeframe at prices between ~$15 and ~$24. Visa had an IPO in 2008 and the first purchases were made soon after. 2013-2014 saw a stake doubling at prices between $39 and $68. The position saw a ~30% selling in 2015 at prices between $64 and $80 and that was followed with a ~70% selling during the 2017-2018 timeframe at prices between $82 and $150. The next two years had seen another ~78% reduction at prices between ~$134 and ~$218. Q1 2021 saw a further ~28% selling at prices between ~$193 and ~$226. There was a ~50% stake increase in Q4 2021 at prices between ~$190 and ~$234. The stock is currently at ~$181. This quarter saw a ~10% trimming.
Microsoft Corp (MSFT): MSFT is a 6.26% of the portfolio position established in Q1 2020 at prices between $135 and $189. The stake was almost doubled in Q3 2020 at prices between ~$200 and ~$232. The stock is now at ~$237. There was marginal trimming this quarter.
Meta Platforms (META) previously Facebook: META is a ~6% of the portfolio position purchased in Q1 2018 at prices between $158 and $190. The next three quarters saw minor selling while in 2019 there was a ~50% reduction at prices between $138 and $209. The six quarters through Q2 2021 had seen another ~70% selling at prices between ~$146 and ~$356. Q4 2021 saw an about turn: ~50% stake increase over the last two quarters at prices between ~$187 and ~$348. The stock currently trades well below their purchase price ranges at ~$136. This quarter saw marginal trimming.
Motorola Solutions (MSI): MSI is a ~6% of the portfolio stake purchased in Q2 2019 at prices between $141 and $167. Q1 2020 saw a ~20% selling at prices between ~$125 and ~$186 while in the following quarter there was a similar increase at prices between ~$126 and ~$158. Last year saw a ~30% selling at prices between ~$168 and ~$272. The stock currently trades at ~$226. There was a ~8% stake increase last quarter while this quarter saw marginal trimming.
Tractor Supply (TSCO): TSCO is a ~6% of the portfolio position first purchased in Q4 2016 at prices between $62 and $77. Next year saw a one-third stake increase at prices between $51 and $79 while in 2018 there was a ~45% selling at prices between $58 and $97. 2019-20 timeframe saw another ~85% reduction at prices between ~$76 and ~$155. The three quarters through Q3 2021 also saw a ~20% selling at prices between ~$140 and ~$212. The stock currently trades at ~$186. There was a ~13% trimming this quarter.
Edwards Lifesciences (EW): EW is a 5.60% of the portfolio stake. It was established in Q1 2017 at prices between ~$30 and ~$33. Next year saw the position reduced by ~40% at prices between $38 and $58. 2019-20 timeframe saw another ~70% selling at prices between ~$50 and ~$82. The three quarters through Q3 2021 also saw a ~25% selling at prices between ~$79 and ~$123. That was followed with a similar reduction next quarter at prices between ~$106 and ~$131. The stock currently trades at $83.59. There was minor trimming in the last two quarters.
UnitedHealth (UNH): UNH is a 5.54% of the portfolio position established in Q3 2021 at prices between ~$391 and ~$430 and the stock currently trades well above that range at ~$508. There was a ~20% stake increase last quarter at prices between ~$456 and ~$521. This quarter saw a minor ~1% trimming.
Note: Their Q3 2021 letter had the following regarding their UnitedHealth thesis: UNH controls ~20% of Medicare Advantage which is a huge tailwind given the market is growing at 10K boomers per day. Further, OptumHealth is aggressively consolidating the fragmented physician market and OptumRx has vast leverage as they have ~$100B in purchasing power.
CDW Corp (CDW): The ~5% of the portfolio position in CDW was established in Q3 2019 at prices between $107 and $124 and increased by ~20% next quarter at prices between $120 and $145. Q3 2020 saw a ~15% stake increase at prices between ~$109 and ~$120. The four quarters through Q3 2021 saw a combined ~25% selling at prices between ~$123 and ~$203. The stock currently trades at ~$158. This quarter saw marginal trimming.
Copart Inc. (CPRT): The 3.71% CPRT stake was established in Q4 2019 at prices between $77 and $91. Q1 2020 saw a one-third reduction at prices between ~$59 and ~$105 while next quarter there was a ~25% stake increase at prices between ~$62 and ~$92. Q3 2020 saw another one-third increase at prices between ~$82 and ~$106. The stock is now at ~$107. Last seven quarters have seen only minor adjustments.
Progressive Corp (PGR): PGR is a 3.69% of the portfolio position purchased in Q4 2020 at prices between ~$87 and ~$101. There was a ~82% stake increase in Q1 2021 at prices between ~$85 and ~$99. This quarter saw a ~22% reduction at prices between ~$107 and ~$121. The stock currently trades at ~$119.
Texas Pacific Land (TPL): TPL is a small 2.79% of the portfolio position purchased in Q4 2021 at prices between ~$1152 and ~$1422 and the stock currently trades at ~$1627. There was a ~14% stake increase last quarter while this quarter saw a ~3% trimming.
S&P Global Inc. (SPGI): The 2.35% SPGI stake was established in Q4 2019 at prices between $236 and $275. Q1 2020 saw a one-third reduction at prices between ~$192 and ~$311. That was followed with minor trimming in the next seven quarters. The stock currently trades at ~$315. Last two quarters have seen only minor adjustments.
Starbucks Inc. (SBUX): The SBUX stake was purchased in Q1 2019 at prices between $63 and $75. The ten quarters through Q3 2021 had seen a ~70% selling at prices between ~$58 and ~$126. This quarter saw the position reduced to a very small 0.63% of the portfolio stake at prices between ~$70 and ~$92. The stock is now at $84.81.
Kept Steady:
Berkshire Hathaway (BRK.A) (BRK.B): BRK.B position has been held continuously since 1998, except for a brief period in 2010 when they sold it following a spike in the share price. The 2011-2014 timeframe saw the stake rebuilt to a huge ~4M share position at prices between $66 and $152. The position has since been sold down. The 2015-2016 timeframe saw a ~75% reduction at prices between $125 and $165. Since then, the position was reduced to a very small 0.96% of the portfolio stake at prices between ~$160 and ~$300. The stock currently trades at ~$264.
The spreadsheet below highlights changes to David Rolfe’s US stock holdings in Q2 2022:
David Rolfe – Wedgewood Partners’ Q2 2022 13F Report Q/Q Comparison (John Vincent (author))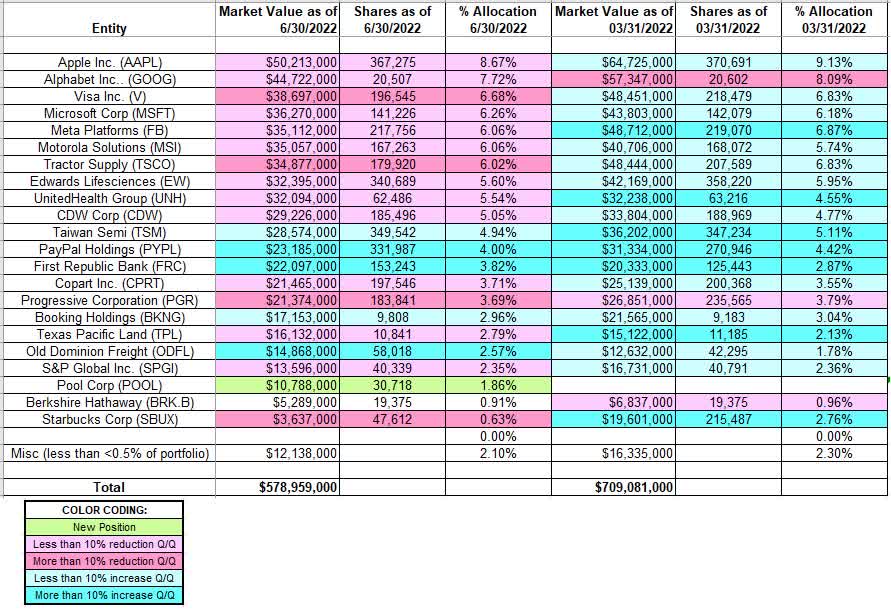
Source: John Vincent. Data constructed from Wedgewood Partners’ 13F filings for Q1 2022 and Q2 2022.
Be the first to comment