

Introduction
The share price of the French oil and gas giant Total SA (TOT) has not escaped the large selloff striking global energy markets, with their share price losing approximately one-third of its value thus far in 2020. This has pushed their dividend yield towards 8% and unlike many of their peers, they are currently sitting in a strong position to sustain their current dividend payments even if this latest oil price plunge turns into an extended crash similar to that of 2015-2016.
Dividend Coverage
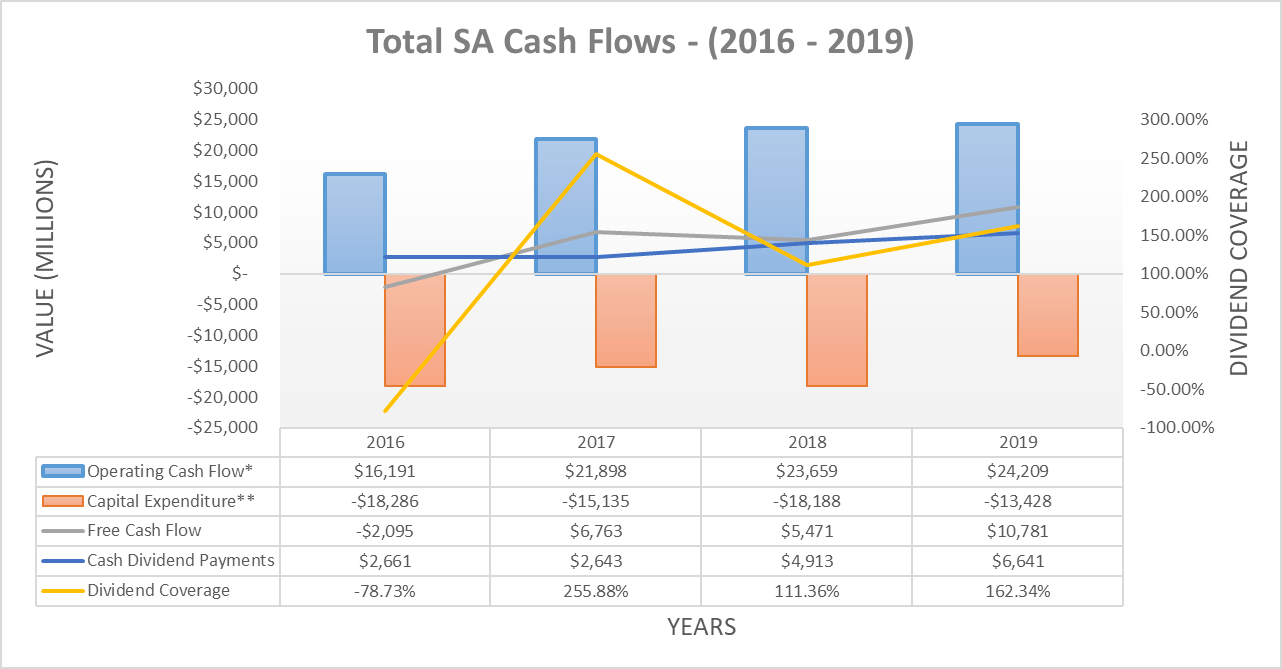
When assessing dividend coverage, I prefer to forgo using earnings per share and use free cash flow instead, since dividends are paid from cash and not from “earnings”. The graph included below summarizes their cash flows from the last four years:
Image Source: Author.
Thanks to a combination of surging operating cash flow and falling capital expenditure, their dividend coverage has improved significantly during the last three years to average a respectable 176.53%. Admittedly, part of this excess coverage has come from the usage of their scrip dividend plan; however, even as its usage was wound down and thus dividend payments surged, their dividend coverage for 2019 was still a strong 162.34%. This indicates that they have been able to consistently fund their dividend payments without the use of debt. When going forward this provides a material safety net during turbulent times such as these, provided their capital expenditure does not increase significantly.
Looking towards the future, based on slide 43 of their February 2020 Outlook presentation, they are forecasting their net capital investments for 2020 will be $18b versus $17.4b for 2019. The difference between net capital investments and capital expenditure is that the former includes the net expenditure on acquisitions. When assessing free cash flow, similar to many investors, I exclude inorganic expenditure on acquisitions. It seems reasonable to assume that their net acquisitions should be broadly the same during 2020 as they were for 2019 and thus their capital expenditure should also be broadly the same at $13.428b. This indicates that their aforementioned safety net afforded by their excess dividend coverage from 2019 was more than merely a one-off event and thus not simply due to abnormally low capital expenditure. Even though the future direction of oil and gas prices will ultimately determine their exact dividend coverage going forward, this will nonetheless still help during these turbulent times.
Financial Position
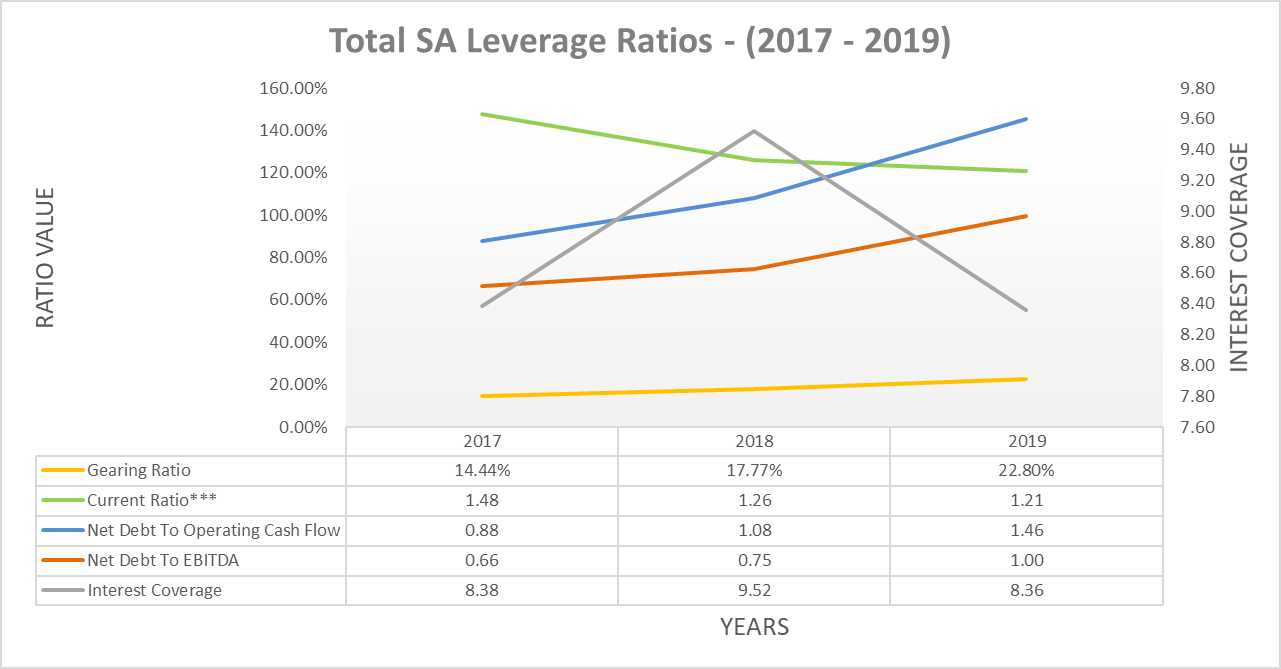
Even though their dividend coverage has been quite strong, their financial position will still be instrumental when providing protection to their dividend payments when riding out volatility. The two graphs included below summarize their financial position from the last three years:

![]()
Image Source: Author.
After reviewing these metrics, it easily becomes clear that overall their balance sheet is strong, despite their leverage creeping higher during the last couple of years due to acquisitions. Their gearing ratio of only 22.80% indicates that compared to their assets, their debt levels are quite manageable and thus have scope to safety increase further. To provide context, the equivalent gearing ratio for BP (BP) is currently 31%, as discussed in greater detail in my recent article. Whilst all of their metrics are favorable, their main strength is their ample liquidity, with a current ratio of 1.21 and over $27b of cash both being very positive signs. This all indicates that, if required, they should be capable of utilizing their strong balance sheet to cover any temporary gaps in dividend payments that could result from the impact of lower commodity prices on their free cash flow.
To provide an example scenario displaying their ability to not only survive another oil and gas price crash but to also sustain their dividend payments, I utilized their performance during the previous crash in 2016 as a reference point. Their operating cash flow during 2016 fell to $16.191b and thus when combined with their aforementioned capital expenditure guidance for 2020 of approximately $13.5b, this would still result in free cash flow of approximately $2.7b. Whilst this would still create a shortfall of approximately $3.9b to cover their dividend payments, assuming no further usage of their scrip program, their balance sheet has the strength to temporarily fund the gap with increased net debt.
Even after three consecutive years of funding this gap with debt, their net debt would have only increased to approximately $47b and thus based on my calculations, their gearing ratio would sit at approximately 30% to 31%. Whilst this is a material increase, it is still far from a crisis level and would have resulted after three consecutive rough years and assumes that management takes no decisions to reduce spending. This clearly indicates that they have ample strength to ride out another oil price crash whilst sustaining their dividend payments, which is instrumental in supporting their valuation and the medium- to long-term attractiveness of their shares.
When looking at their valuation, it seems likely investors acquiring their shares right now are setting themselves up well for any potential rebound in oil and gas prices in the future. Their dividend yield and price to book ratio are currently sitting at their most favorable levels at any point in almost three decades. Unfortunately, due to the volatility in their earnings from commodity prices, earnings based metrics are rendered rather inconclusive as trailing data is out of date and forward data is near impossible to accurately predict. Whilst it may take a number of quarters or even possibly over one year for oil and gas prices to recover materially, their shareholders can continue being paid to wait in the meantime with a near 9% dividend yield. When collecting such a high dividend yield even capital gains only in the low single digits creates desirable double-digit total returns.
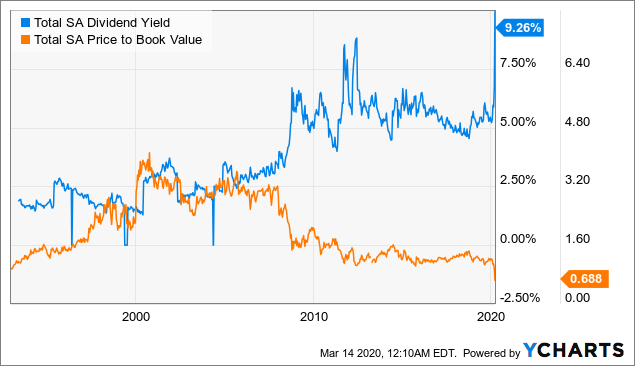 Data by YCharts
Conclusion
The bottom line is that investors should have no reason to believe that they will not be capable of sustaining their lovely high dividend yield, even if this recent oil price plunge turns into another full drawn out crash. They entered this year with strong dividend coverage and financial position as well as modest forecast capital expenditure. When combined with their history of at least maintaining their dividend payments since 1982, they are in a better position than most of their peers. Provided they are capable of sustaining these dividend payments, it becomes easy to imagine their shares providing desirable returns in the medium to long term.
Notes: Unless specified otherwise, all figures in this article were taken from Total SA’s Fourth Quarter 2019 and Fourth Quarter 2017 reports, all calculated figures were performed by the author.
Disclosure: I/we have no positions in any stocks mentioned, and no plans to initiate any positions within the next 72 hours. I wrote this article myself, and it expresses my own opinions. I am not receiving compensation for it (other than from Seeking Alpha). I have no business relationship with any company whose stock is mentioned in this article.
Be the first to comment