

There are numerous tools you can implement when analysing an asset’s price, including indicators, trendlines, candlestick patterns, and chart patterns. Precise entry and exit points chart patterns offer make them stand out from other technical analysis tools. Below you will find the most common chart patterns for stocks by FXOpen.
*Note that the patterns listed below can be used for stock, commodity, crypto**, and Forex trading.
1. Head and Shoulders
A head-and-shoulders pattern is a popular chart pattern due to the fact that it can be found on any timeframe of any asset. The Head and Shoulders is a bearish reversal pattern forming at the end of an uptrend. It consists of three tops: a head and two shoulders at the sides, and two troughs.
- Entry. The pattern must be fully formed so that its signals work. A line, the so-called neckline, drawn through two troughs, serves as a starting point for a sell position. The theory suggests traders go short after the price breaks below the neckline.
- Take profit (TP). The profit target may equal the distance between the head and the neckline.
- Stop loss (SL). Although the pattern is reliable, it may fail, especially in periods of high volatility. The stop-loss level is usually placed slightly above the right shoulder. The distance can be determined according to the risk/reward ratio.
2. Inverse Head and Shoulders
The Inverse Head and Shoulders is a bullish reversal pattern forming at the end of a downtrend. It has three lows (a head and two shoulders at the sides) and two peaks.
- Entry. A trader may go long after the price breaks above the neckline drawn through two highs.
- Take profit. A take-profit level may equal the head’s height.
- Stop loss. A stop-loss value can be calculated with the risk/reward ratio or placed below the right shoulder.
The Head and Shoulders and the inverse Head and Shoulders are widely used as intraday trading patterns.
3. Double Top
Double top is one of the common graph patterns names. It’s a reversal pattern that appears at the end of a bullish trend. The Double Top setup includes two tops and one trough.
- Entry. You can open a sell position after the price falls below a neckline drawn through a trough.
- Take profit. A potential profit can be taken after the price goes the distance equal to the length between the peaks and the neckline.
- Stop loss. An SL can be placed above the peaks or according to the risk/reward ratio.
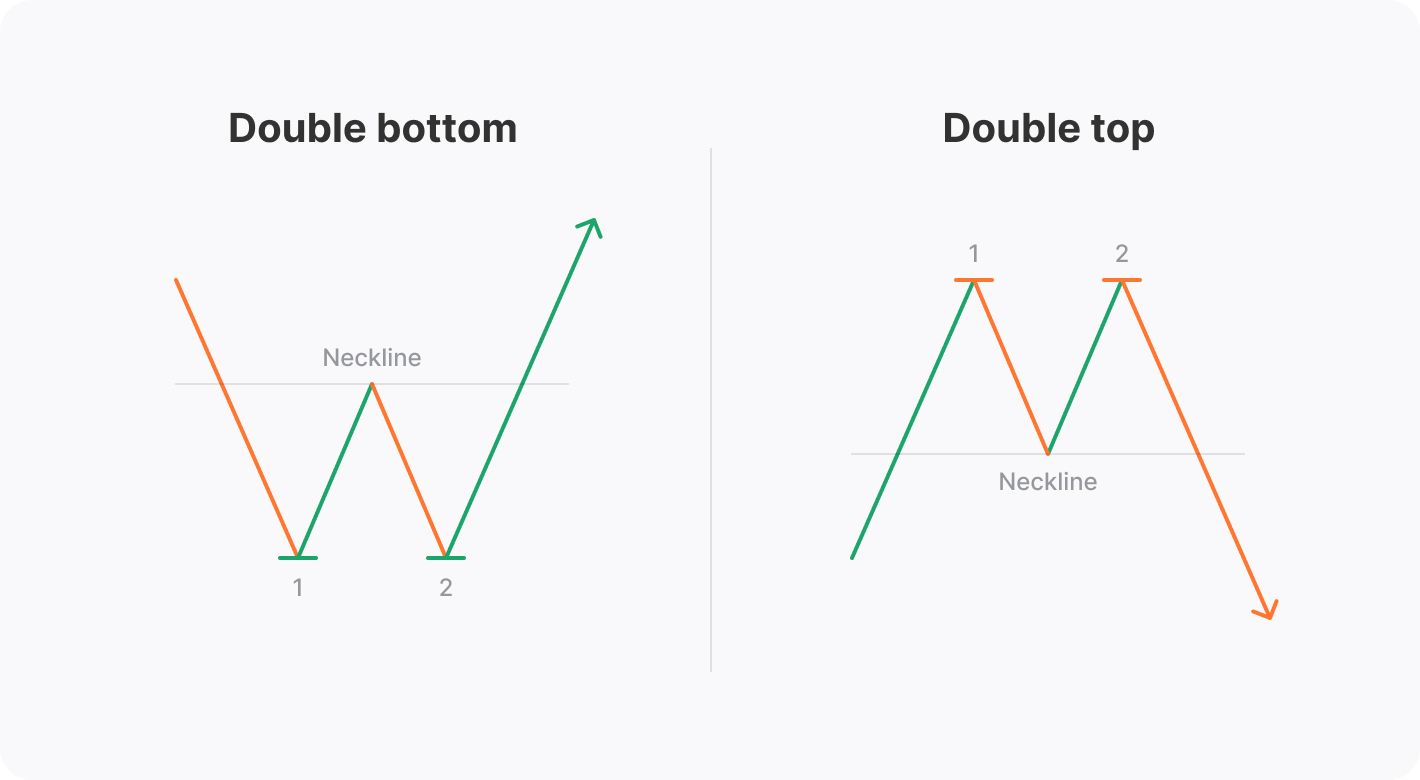
4. Double Bottom
All stock patterns have a bullish and a bearish formation. A double bottom formation is opposite the double top. It’s a bullish reversal pattern consisting of two bottoms and a top.
- Entry. As with the double top formation, the entry point is based on a neckline breakout. You can consider opening a long position after the price rises above the line.
- Take profit. The take-profit value is usually calculated based on the distance between the lows and the neckline.
- Stop loss. Risks can be limited by the stop-loss order set below the lows or according to the risk/reward ratio.
5. Triple Top
This is another of the helpful chart patterns in technical analysis. A triple top is similar to the Head and Shoulder, but its highs lie at the same level. The pattern signals an end to an uptrend. You can find the differences by examining trading patterns on charts on TickTrader.
- Entry. As an entry point, a trader may use a breakout of a neckline placed through two lows.
- Take profit. A profit target may equal the distance between the tops and the line.
- Stop loss. An SL is usually placed either above three tops or according to the risk/reward rules.
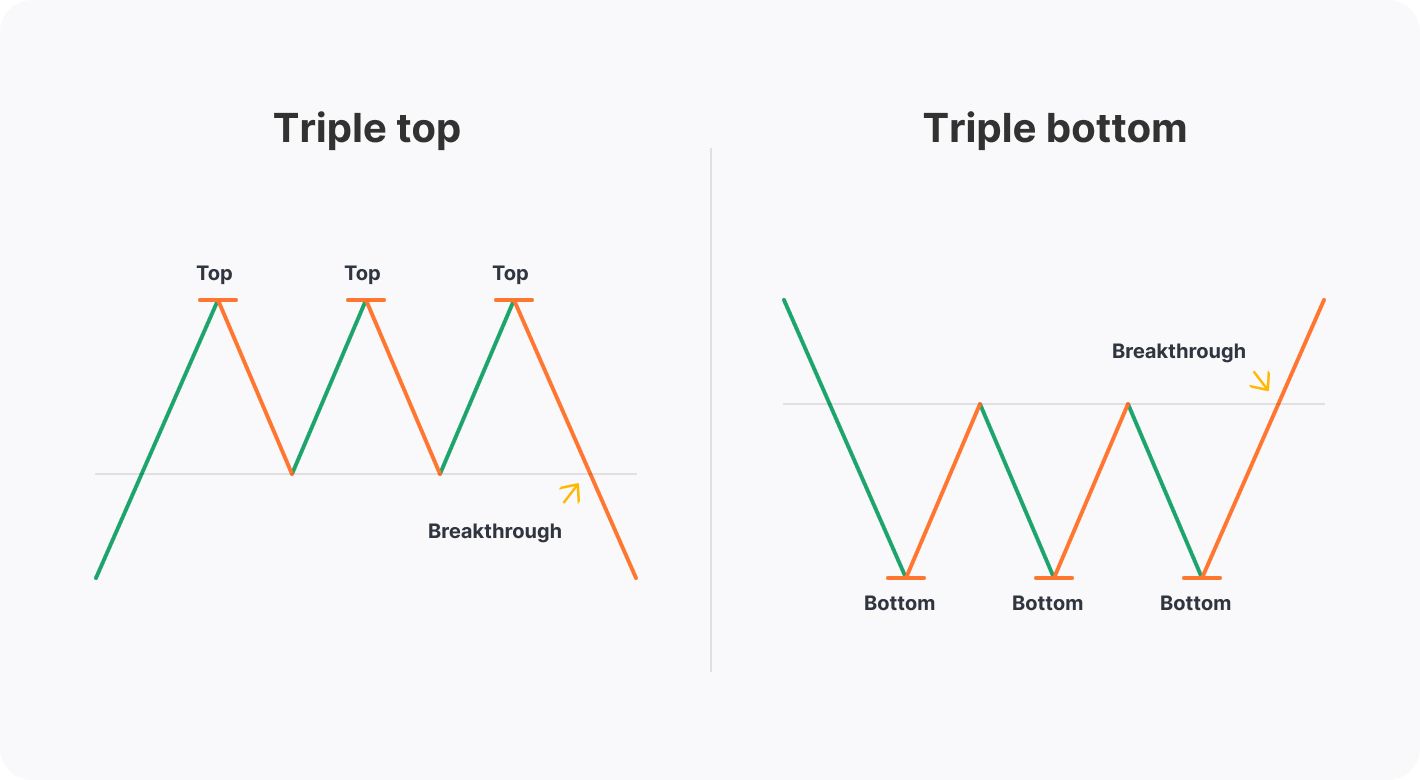
6. Triple Bottom
A triple-bottom formation resembles the inverted Head and Shoulders, but all three lows are at the same level. It’s a common stock market chart pattern.
- Entry. You may go long once the price rises above the neckline drawn through two peaks.
- Take profit. The distance between the neckline and the bottoms may be your TP target.
- Stop loss. To limit risk, you may place the SL below the three lows or apply the risk/reward rules.
Read “How to Trade Double and Triple Tops and Bottoms” by FXOpen to learn more.
7. Cup and Handle
Unlike the patterns mentioned above, the Cup and Handle is a continuation formation, signalling a strong bullish trend. It consists of a rounding bottom and a handle that resembles a flag pattern.
- Entry. A trader may buy when the price breaks above the handle’s upper trendline.
- Take profit. A TP level may be the same as the distance between the cup’s minimum and the handle’s upper trendline.
- Stop loss. An SL can be either below the lower trendline of the handle or below the cup’s minimum.
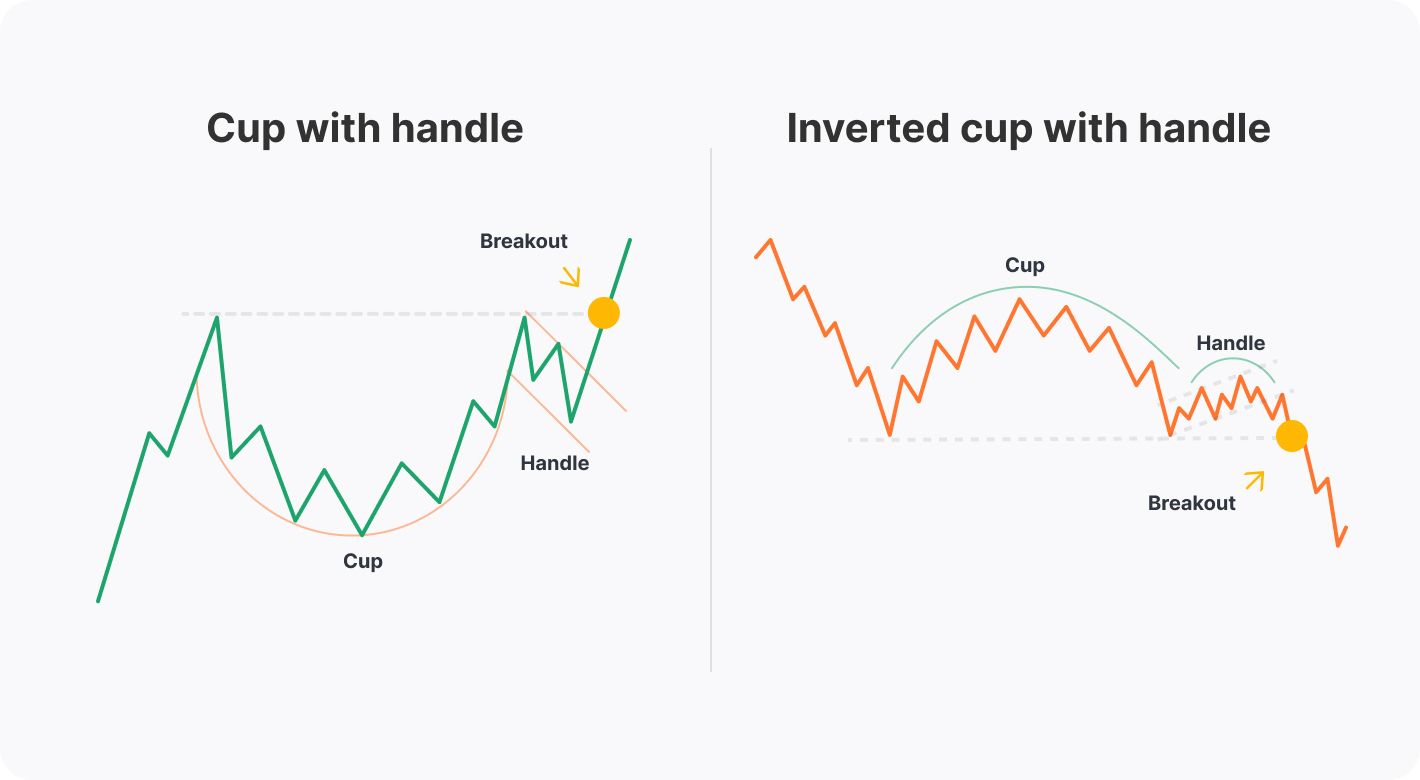
8. Inverted Cup and Handle
The inverted Cup and Handle setup signals a downtrend continuation. It has a rounding top and an upward-sloping handle.
- Entry. A trader may sell when the price breaks below the handle’s lower trendline.
- Take profit. A TP can be set at a distance equal to the one between the cup’s maximum and the handle’s lower trendline.
- Stop loss. An SL can be above the handle’s upper boundary or above the cup’s maximum.
9. Rising Wedge
A wedge is a bilateral pattern.
A bilateral pattern is a type of chart pattern that signals both a reversal and a continuation of a trend depending on market conditions.
A rising wedge includes two ascending diverging trendlines, where the support line is steeper as the price forms higher highs slower than it forms higher lows. In a bullish trend, a rising wedge formation predicts a reversal. In a downtrend, it signals a trend that may maintain.
- Entry. According to the general rules, you may go short after the price falls below the wedge’s lower boundary.
- Take profit. The take-profit size may equal the pattern’s widest part.
- Stop loss. An SL may lie at the wedge’s upper boundary.
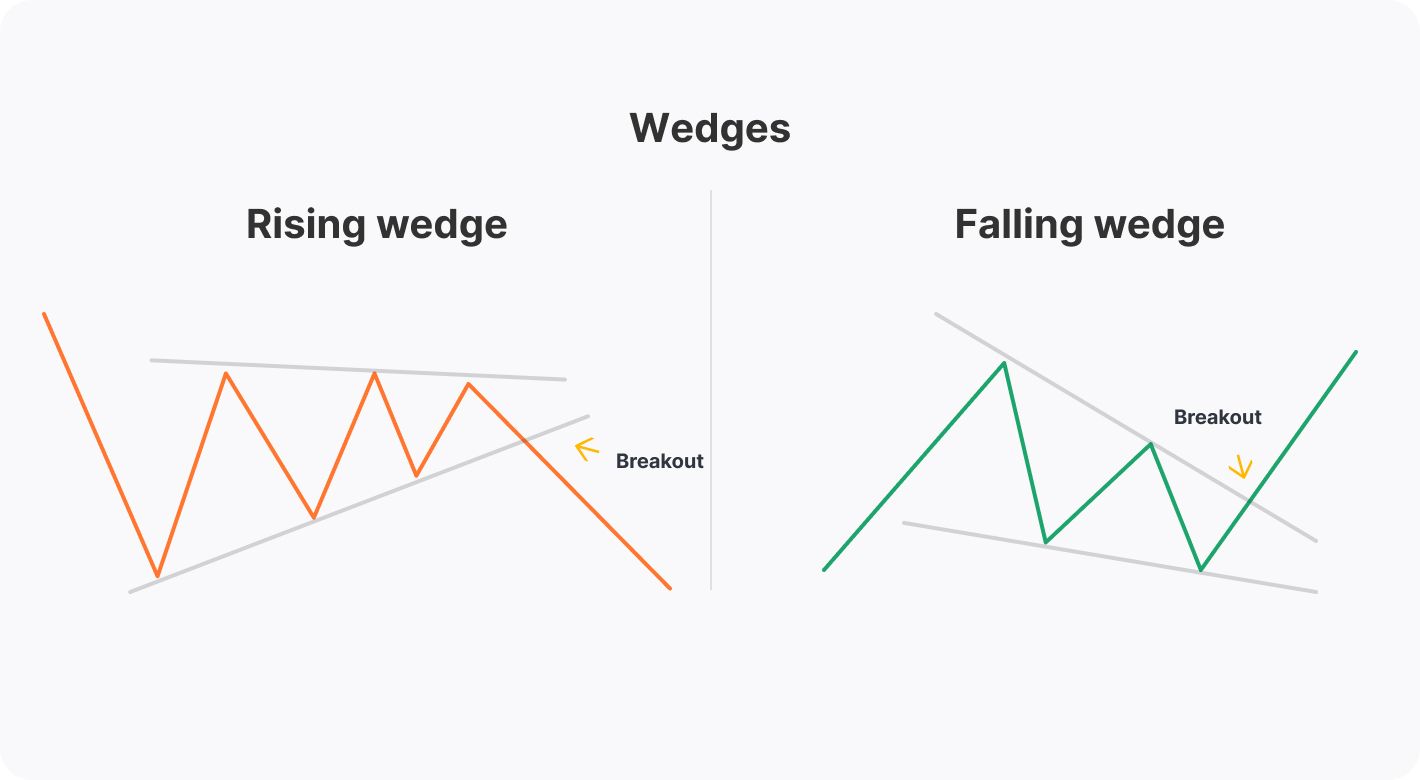
10. Falling Wedge
A falling wedge is also in our list of chart patterns which are used for stock trading. It’s formed by two descending diverging trendlines. The resistance line is steeper as the price sets lower highs faster than lower lows. In an uptrend, the wedge predicts a trend continuation. In a downtrend, it signals a market reversal.
- Entry. You may go long after the price rises above the wedge’s upper boundary.
- Take profit. A TP target may lie at a distance equal to the wedge’s widest part.
- Stop loss. You could place an SL at the wedge’s lower band.
Takeaway
Chart patterns are common tools for stock trend forecasting. However, they require traders to have experience, as different chart patterns have different trading rules. Try a free demo account by FXOpen to practise pattern trading without risks.
**At FXOpen UK, Cryptocurrency CFDs are only available for trading by those clients categorised as Professional clients under FCA Rules. They are not available for trading by Retail clients.

Be the first to comment