


DrDjJanek
The consumer price index will be released tomorrow, and estimates forecast another hot reading with CPI y/y expected to climb by 8.1% and 0.2% m/m. The Core CPI is expected to rise by 6.5% y/y and 0.4% m/m.
It will be the last CPI report before the next FOMC meeting in November. While the report isn’t going to change the path of Fed policy for next month, it could shift the direction of monetary policy for December.
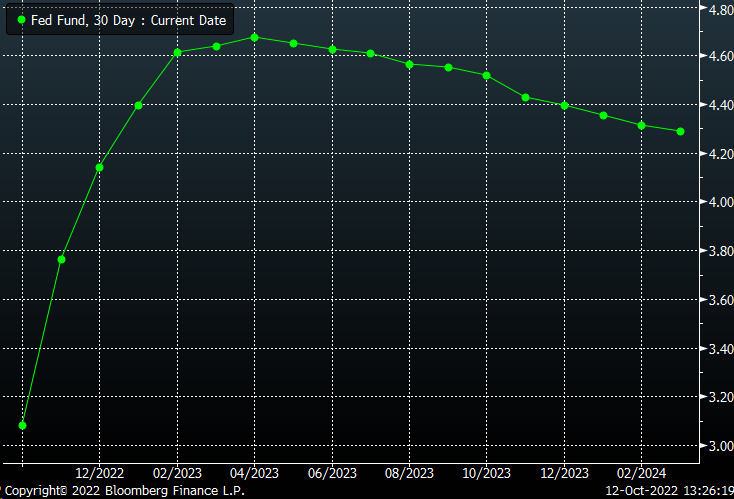
A hotter-than-expected CPI report coupled with the stronger-than-expected job report could result in worries over additional rate hikes, with the need for the Fed to raise rates by 75 bps at that December meeting. Currently, the Fed Funds futures see rates at 4.14%. That is about 25 bps below the Fed’s projections of 4.4%.
Fed Funds futures are currently suggesting 125 bps of rate hikes by December. A hotter-than-expected CPI would likely result in the market pricing in 150 bps of additional rate hikes this year, potentially shifting the entire Fed Fund futures curve higher.
Bloomberg
Hotter Than Expected?
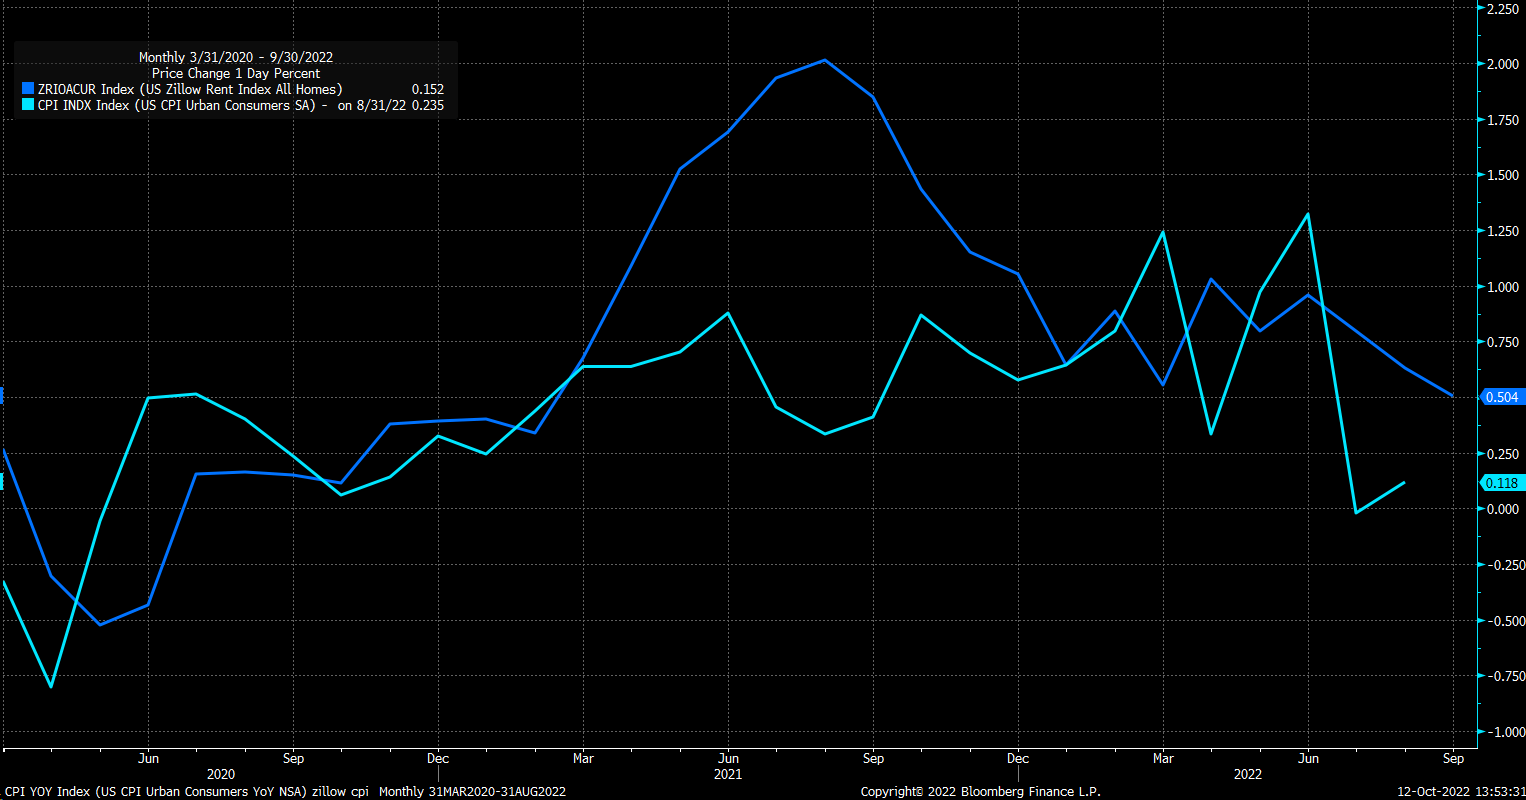
The most significant component of the CPI report is shelter, which accounts for 32% of the index. The US Zillow Rent Index for All Homes rose by 0.5% in September, suggesting that the shelter’s piece is likely to be still elevated. Without a decline in energy prices in September, such as gasoline, there will not be a significant drag lower, as seen in July and August. Gasoline prices were essentially flat in September, and gasoline accounts for nearly 5% of the index.
Bloomberg
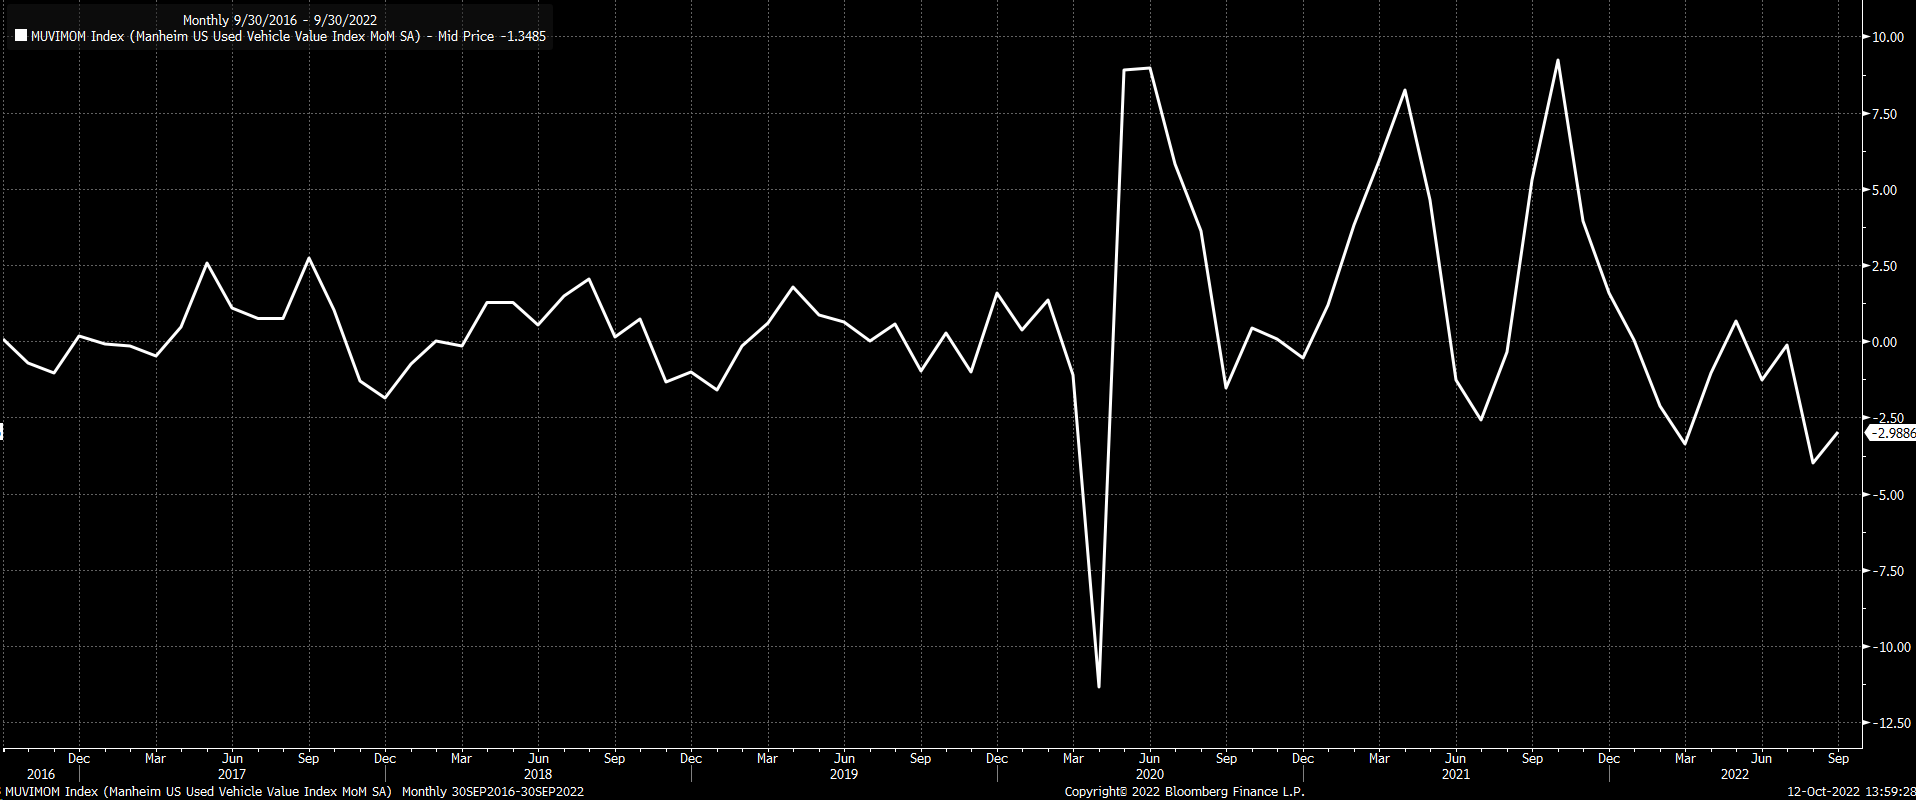
Additionally, used car prices in September, as measured by the Manheim Used Vehicle Index, fell 3% versus 4% in August. It may suggest that used car prices, although down in September, didn’t fall as much as in August, and thus there may be less of a negative impact.
Bloomberg
Bad For Stocks
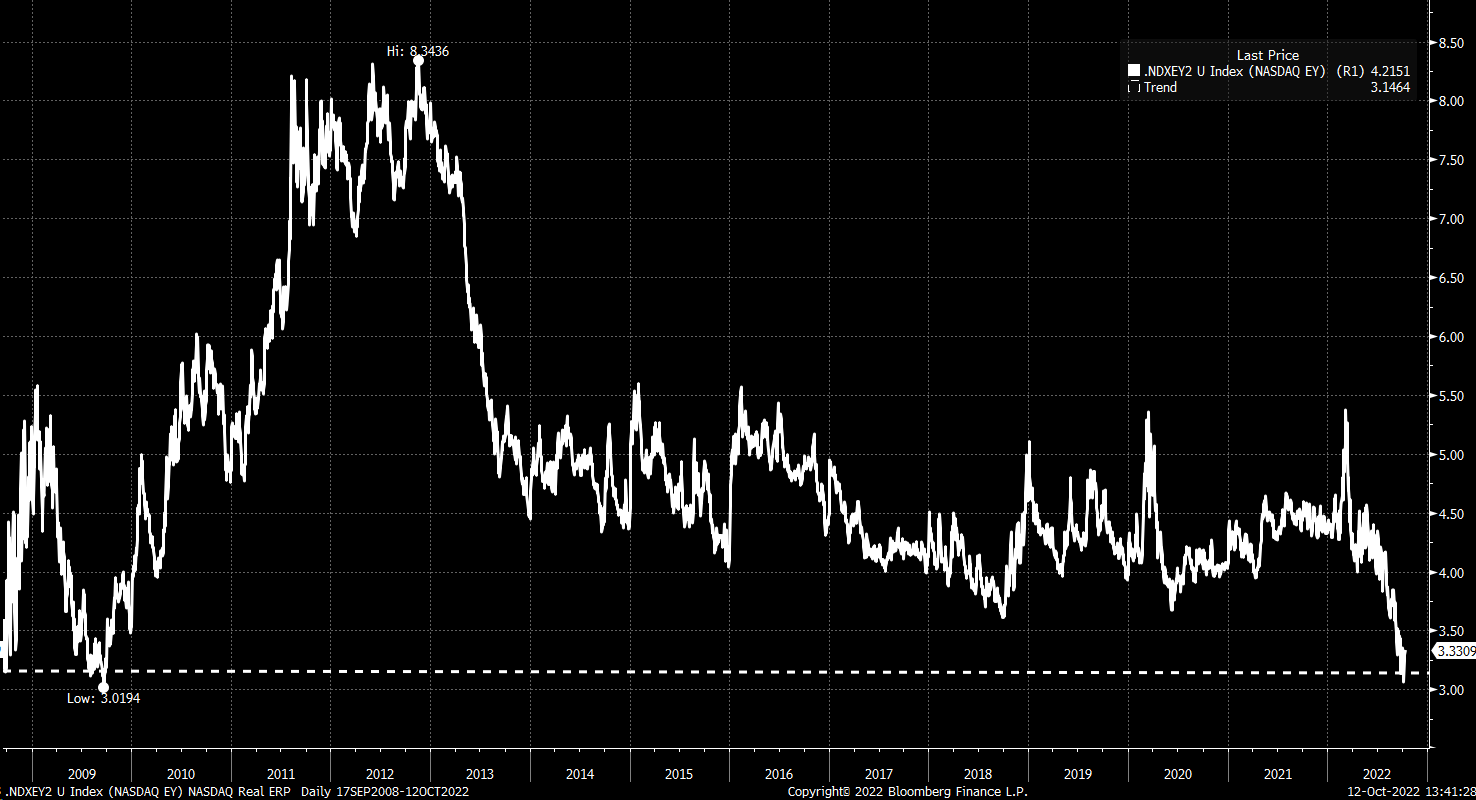
A hotter-than-expected CPI report would be bad news for stocks as it would again cause a repricing in rates, thus pushing the valuation of stocks lower. Most importantly, equities have been unable to keep pace with rising real yields. For example, the difference between the NASDAQ 100 earnings yield and the 10-year real yield is currently around 3.3%. The difference between real rates and the NASDAQ is at its lowest value since 2009. That means that stocks are significantly overvalued when compared to real rates.
It also demonstrates that despite the NASDAQ plunging in 2022, it hasn’t fallen nearly enough to keep pace with the rise in real yields. It means that the NASDAQ needs to fall even further.
Bloomberg
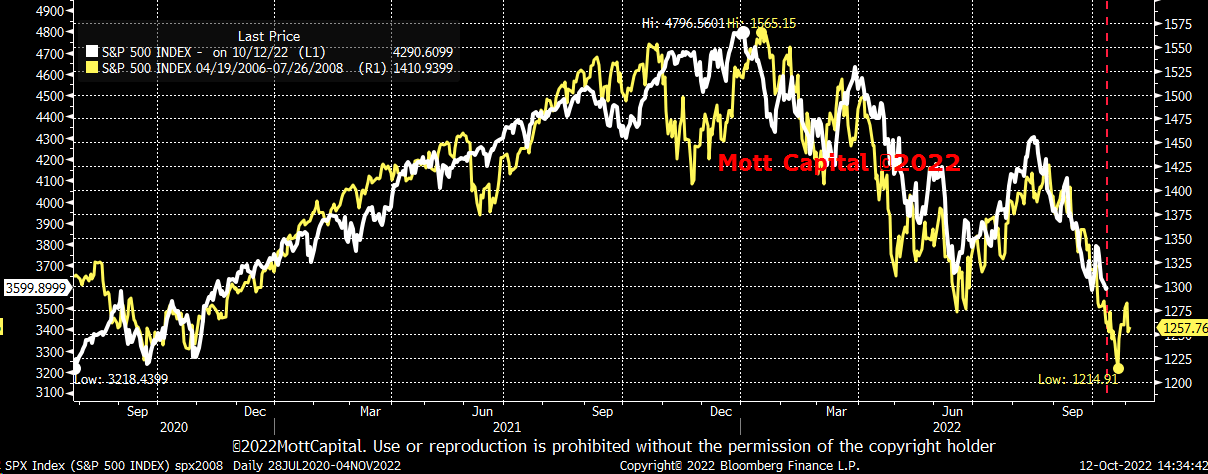
2008 Bear Market
Additionally, as this bear market plays out versus previous cycles, there may still be a sharp decline for the equity market. Comparing the S&P 500 in 2022 with the 2008 bear market cycle suggests equities may see a further drop between now and the end of October.
Bloomberg
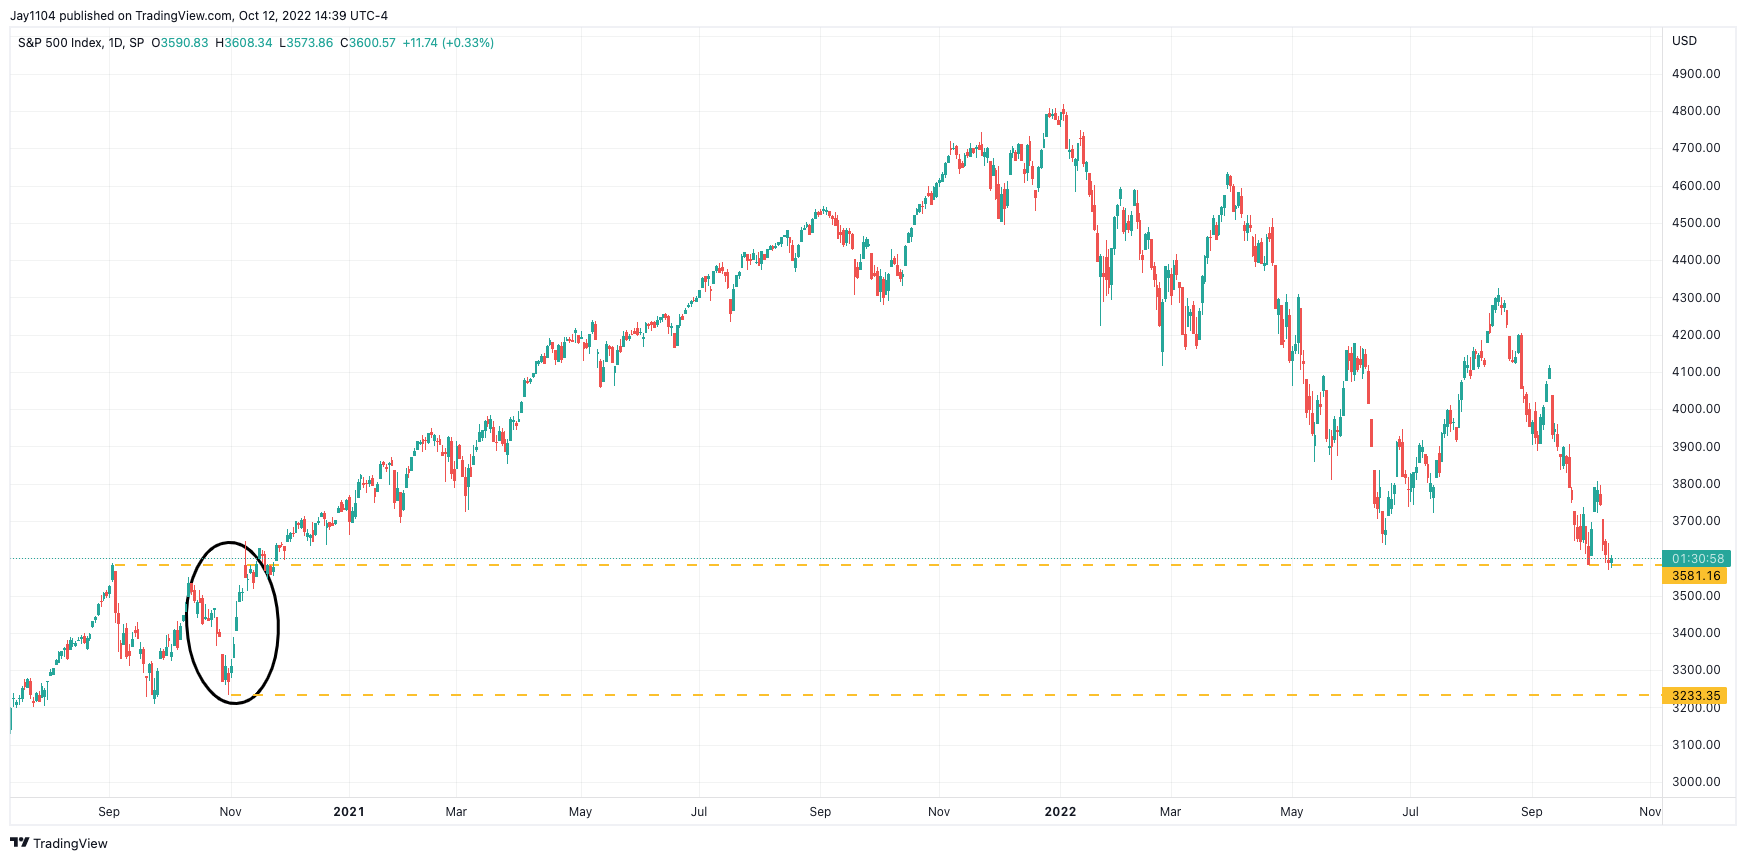
From a technical standpoint, that possibility exists. The technical chart shows the S&P 500 is currently at a critical support level of 3,580. That level of support dates back to September 2020. Once that support level breaks, there are several gaps to fill to around 3,230, or almost 11%. Because these are unfilled gaps, a decline could happen in a short time.
Trading View
At this point, a hotter-than-expected CPI report seems more troublesome than an inline report, as it is unlikely to change the path of monetary policy and the current market expectations. Yes, equities could rally on an in-line or cooler-than-expected CPI print, but a relief rally may only be short-lived, with monetary policy unlikely to change much.
Be the first to comment