

narvikk
The Motley Fool 100 ETF (BATS:TMFC) invests in top-notch, superlative picks from the U.S. equity market upper echelon included in the Motley Fool 100 Index, which features the market-cap weighting schema. These players must be in TMF’s “recommendation universe,” and, hence, they are expected to outpace the market. Though the strategy might look relatively simplistic, the fund comes with an expense ratio of 50 bps.
My previous article was published in July, when I once again questioned the viability of its strategy in the current environment characterized by higher interest rates and persistently high inflation that was previously submerged but then came to the fore, eating into multiples and causing billions in market value to evaporate. My skepticism was principally supported by the combination of factors the portfolio had back then, with valuation being the gnawing concern. Profitability was justly superb, yet alas, top quality is not enough for outperformance these days. The major question is whether it is priced adequately. If not, investors would be better off looking elsewhere.
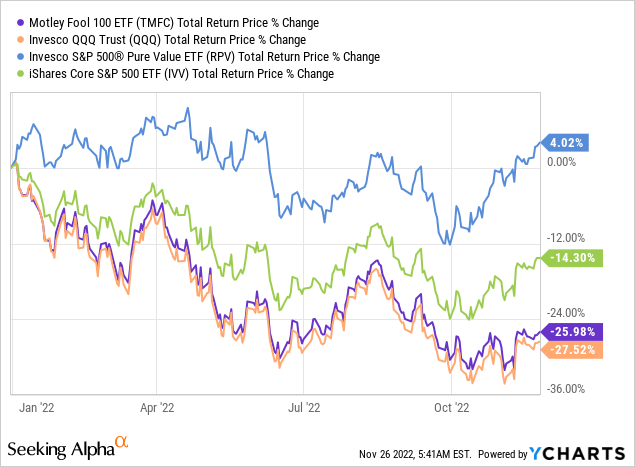
TMFC’s commitment to large-size tech growth plays had strongly supported its gains since its inception in January 2018, allowing it to easily trounce the iShares Core S&P 500 ETF (IVV), delivering a CAGR of over 23% vs. IVV’s 16.3% during the February 2018 – December 2021 period.
But this year, the cohort has been somewhat listless, to say the least. Since my July note, TMFC has declined by over 2% while the S&P 500 managed to eke out a gain of 3.7%.
Seeking Alpha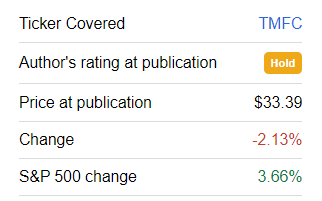
The YTD decline is almost on par with the Invesco QQQ ETF (QQQ), yet solidly below IVV’s, more likely reflecting the lack of exposure to the pure-value names that have been shoring up the S&P 500.
Today, we should look at how the TMFC portfolio has evolved to arrive at a conclusion on whether an upgrade is deserved.
TMFC: homogeneous portfolio, IT dominates the mix, weighing on the earnings yield
At least this year, homogeneity is what the fund has been pursuing. For example, since July, only minor changes were made. As a brief digression, this is in stark contrast with the Innovator IBD 50 ETF (FFTY), a fund following a high-conviction strategy with gargantuan turnover I covered last week.
As of November 25, TMFC’s portfolio included 99 equities, with the top ten still accounting for most of the net assets, close to 55%.
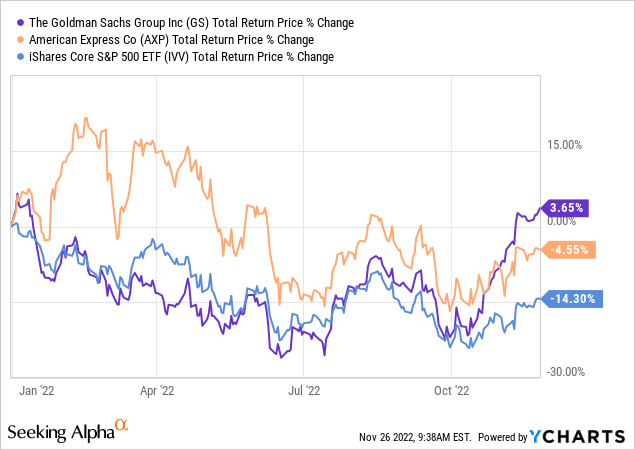
Since July, two stocks were added upon the quarterly reconstitution, namely Goldman Sachs (GS) and American Express Company (AXP), names that have been defying the bearish pressure this year. Together, they account for a measly 1.4% of the net assets, so their above-market earnings yields of 9.7% and 6.5%, respectively, only marginally contributed to TMFC’s valuation profile. More on that shortly.
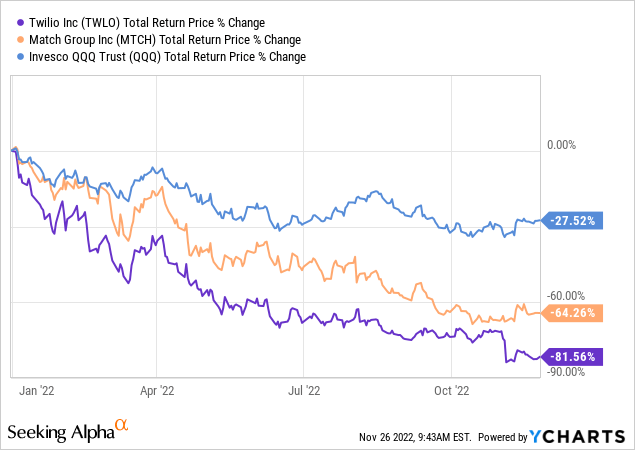
Three names were removed, including Twitter, Twilio (TWLO), and Match Group (MTCH). The reason for the removal of Twitter is self-evident. The latter two have seemingly fallen out of favor with Motley Fool analysts. A due remark here is that their weights in the portfolio as of July were exiguous, about 22 bps combined vs. 34 bps as of January. And of course, as most of the growth tech league, both have a year to forget.
Turning to sectors, TMFC is enamored of IT, especially of the $1 trillion league, and almost nothing could change its bullish stance on it. About 42% of its net assets are invested in tech at this point (precisely the same amount as in July), with Apple (AAPL) and Microsoft (MSFT) accounting for 24.4% combined. Consumer discretionary (14.4%) and healthcare (12.5%) are in second and third places, respectively. The addition of GS and AXP has slightly boosted the Motley Fool ETF’s exposure to financials, yet the sector still accounts for just 9.3%.
For some reason, TMFC has little interest in the energy sector, if at all. Amid the value rotation, this is counter-intuitive, at least for my taste. It invested in Kinder Morgan (KMI), a leading energy infrastructure company sporting excellent profitability, modest valuation, and comparatively strong revenue growth, yet with a weight of just 20 bps. I cautiously assume that if the fund topped up its allocation to oil & gas (e.g., adding some decent amount of exploration & production plays) during one of this year’s reconstitutions, e.g., in March or June, its performance would not have been that dismal.
Did the slight price decline and minor additions/deletions result in a better valuation profile? Hardly. Owing to the size factor and large exposure to quality, comfortable trading multiples is not something to expect from TMFC. At this point, the median market capitalization is at $64.8 billion, yet the result ignoring stock weights is somewhat misleading. For better context, the weighted-average figure is at $835 billion, as per my calculations, so there is no reason to expect a moderate valuation whatsoever.
The fund is betting on bellwethers, so the size premium will be a permanent issue, for better or worse. For context, the earnings yield is at around 3.6% (a P/E of 27.7x), as of my calculations again, which specifies a solid premium to IVV. Another metric of interest is Price/Sales, and it still does not offer solace, with the WA standing at 6.2x, being impacted heavily by both AAPL and MSFT. Overall, I have issues with creating a strong bullish thesis for a portfolio that has just 1.8% of stocks with A and B Quant Valuation grades, literally a trace amount. It has even shrunk since my July note when it stood at 2.2%. Meanwhile, the share of those with D+ ratings and worse went from ~81% to 89.6%.
There are also a few due remarks on quality. Since the portfolio is mostly homogeneous, tectonic shifts in profitability characteristics are not something I anticipated when I started the analysis. And truly so, TMFC remains a quality investor’s dream, with 99.1% of the net assets allocated to stocks with a B- Quant Profitability grade and better. 73% of the holdings have a Return on Total Capital above 10%, a decent result, while none is cash-burning. Just two stocks, namely Uber Technologies (UBER) and Roblox (RBLX) have poor margins and returns on equity, total assets, and total capital, thus they have a D rating as of writing this article.
Created by the author using data from Seeking Alpha and the fund
Final thoughts
TMFC’s standout performance in the past, with a starling 23% CAGR delivering during the February 2018 – December 2021 period, was undergirded by ultra-loose monetary policy and consistent gains of the bellwether tech plays, a perfect mix for a market-cap-weighted portfolio, something that QQQ enjoyed in a similar fashion. Yet its strategy appeared to be ill-prepared for the bear market, if at all, with plenty of names from TMF’s recommendation universe performing dismally. To bring a bit more color, about 16.8% of the fund’s net assets are currently allocated to 19 stocks that delivered gains this year, with a median return of 15.1%. Yet the average for those that are in the red is horrible at 27.2%.
Investors should answer by themselves whether they are content with a 6.2x WA P/S multiple which comes with a WA forward revenue growth of ~14%. Please do note a recession, even a mild one, means lower growth and lower trading multiples.
Here, there is also something to reflect on. Comparing the weighted average forward revenue growth rates that the April, July, and current versions of the portfolio sported, I noticed a trend. More specifically, the WA rate was at about 18.8% in April, then at approximately 18% in July, and, finally, at 14% in November. Are analysts factoring in a higher cost of capital across the board or indirectly acknowledging the recession is no longer an impossible outcome? Time will tell. All in all, I believe it would be unjustified to upgrade TMFC today.
Be the first to comment