

DNY59
In August, I published a piece about long duration U.S. Treasuries titled TLT: Holding My Nose And Buying Bonds. The thesis was that despite my animosity towards negative real rates, the macro fundamentals were indicating that long duration bonds should start to perform. This investment thesis was premature, and premature means wrong.
Immediately, the iShares 20+ Year Treasury Bond ETF (NASDAQ:TLT) turned south and shed 21% in share price since. The fund’s dividend yield has gone from 2.13% to a 30-Day SEC Yield of 4.32%. I was long March 2023 call options on TLT and stopped out at 50% loss. Fortunately, the position size was small, a product of my tepid bullishness.
Revisiting the investment thesis today finds that I am neutral on long duration bonds. However, the fundamental reasons that caused me to be bullish in August have improved, as has the yield. I believe we are seeing signs that the bond bear market is close to a turning point and am patiently waiting to put this trade back on.
Contrarians Wanted
The bond bear market has reached unprecedented conditions. The 10Y U.S. Treasury has experienced its worst year of performance since 1788, only five short years from the end of the Revolutionary War when the United States was no economic power. Between 1775 and 1788 the U.S. GDP fell by 45%. In 1788, the United States had no central bank, no stable currency, no commercial banking system, and no integrated securities markets. If the U.S. had a credit rating back then it would certainly have been junk.
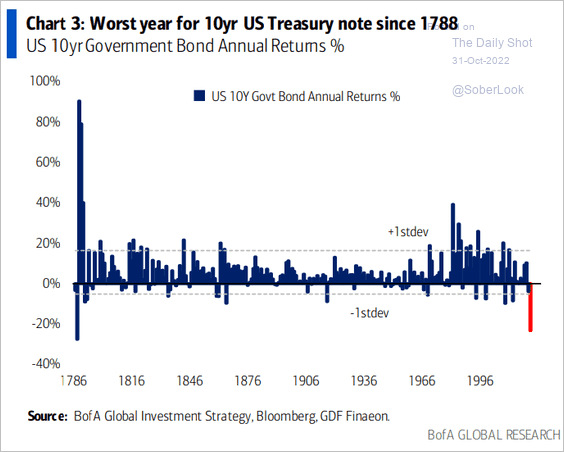
The Daily Shot (used with permission)
The result is the most oversold that the TLT ETF has ever been on a weekly basis. The weekly RSI hit a low of 19 on October 17th. Over a decade of price appreciation has been wiped out in two short years.

Charts by TradingView (adapted by author)
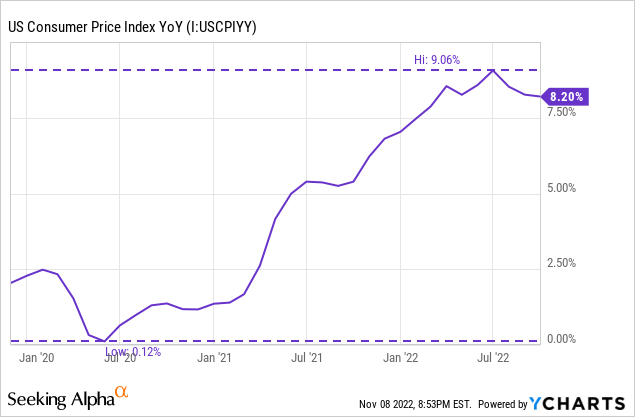
While headline CPI inflation is persistently high, the momentum of inflation has slowed. The YoY CPI growth of 8.2% suggests that real rates on 30Y Treasuries are deeply negative at -3.9%.
But the reality is that this inflation has already occurred. What matters now is forward real yields. If we compare the rate of the 30Y Treasury with the annualized monthly CPI growth we can see that real rates were actually positive in July and August. This fact contributed to my bullish position. In September, hotter than expected CPI resulted in an annualized real rate of -1%.
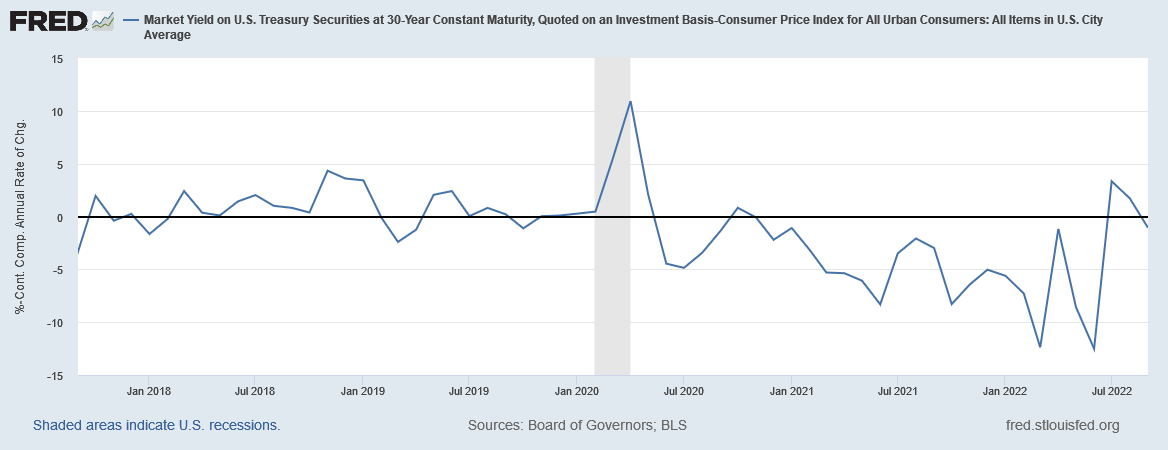
Federal Reserve Economic Data | FRED | St. Louis Fed
Using the breakeven rate for 30Y bonds, which represents the market’s expectation for future inflation, we can see that expected real yields are nearly 2%. This is the highest since 2011. I started to become bullish when real yields rose above 0.8%, which is approximately the 10-year average.
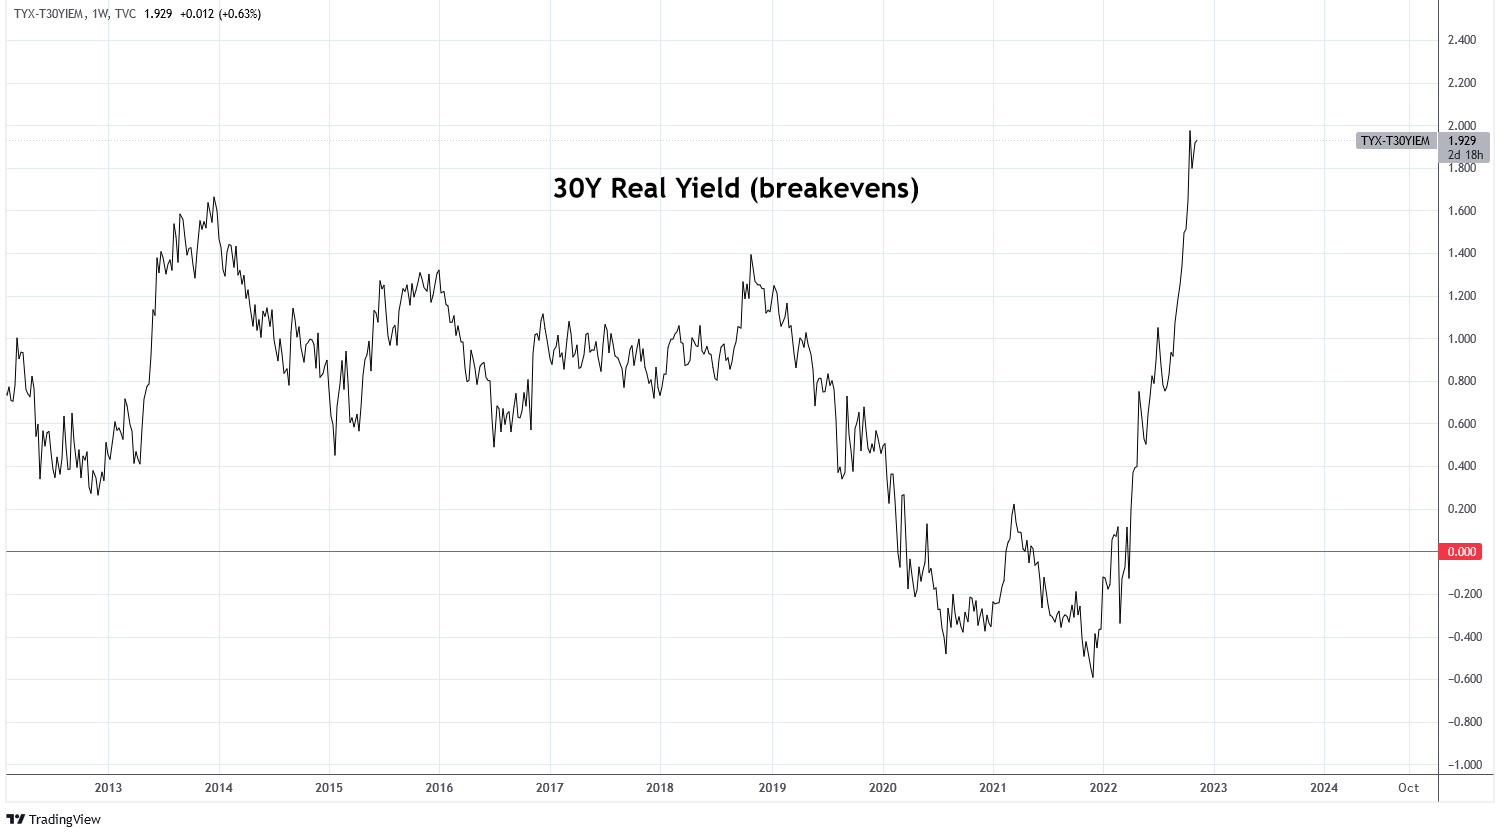
Charts by TradingVIew (adapted by author)
Today, long duration bonds scream “mean reversion!” Through most of its history, long duration bonds have performed well in the year following a down year. Understanding the reasons for this extreme volatility is key to positioning correctly. Previously, I underestimated those reasons.
Keep It Simple, Stupid
Ultimately, the reason that long term rates continue to rise is because short term rates are pushing them higher. It really is that simple and I overestimated other fundamental factors that matter far less. Looking at the chart, 30Y rates are rarely below Fed Funds rates and when they are it is right before a decline in Fed Funds resulting in a short-lived inversion. As long as short-term rates continue rising, long term rates are likely to follow. The forecasted terminal Fed Funds rate is now between 5-5.3% which implies that the 30 Year will get there at some point, potentially before the Fed Funds rate.
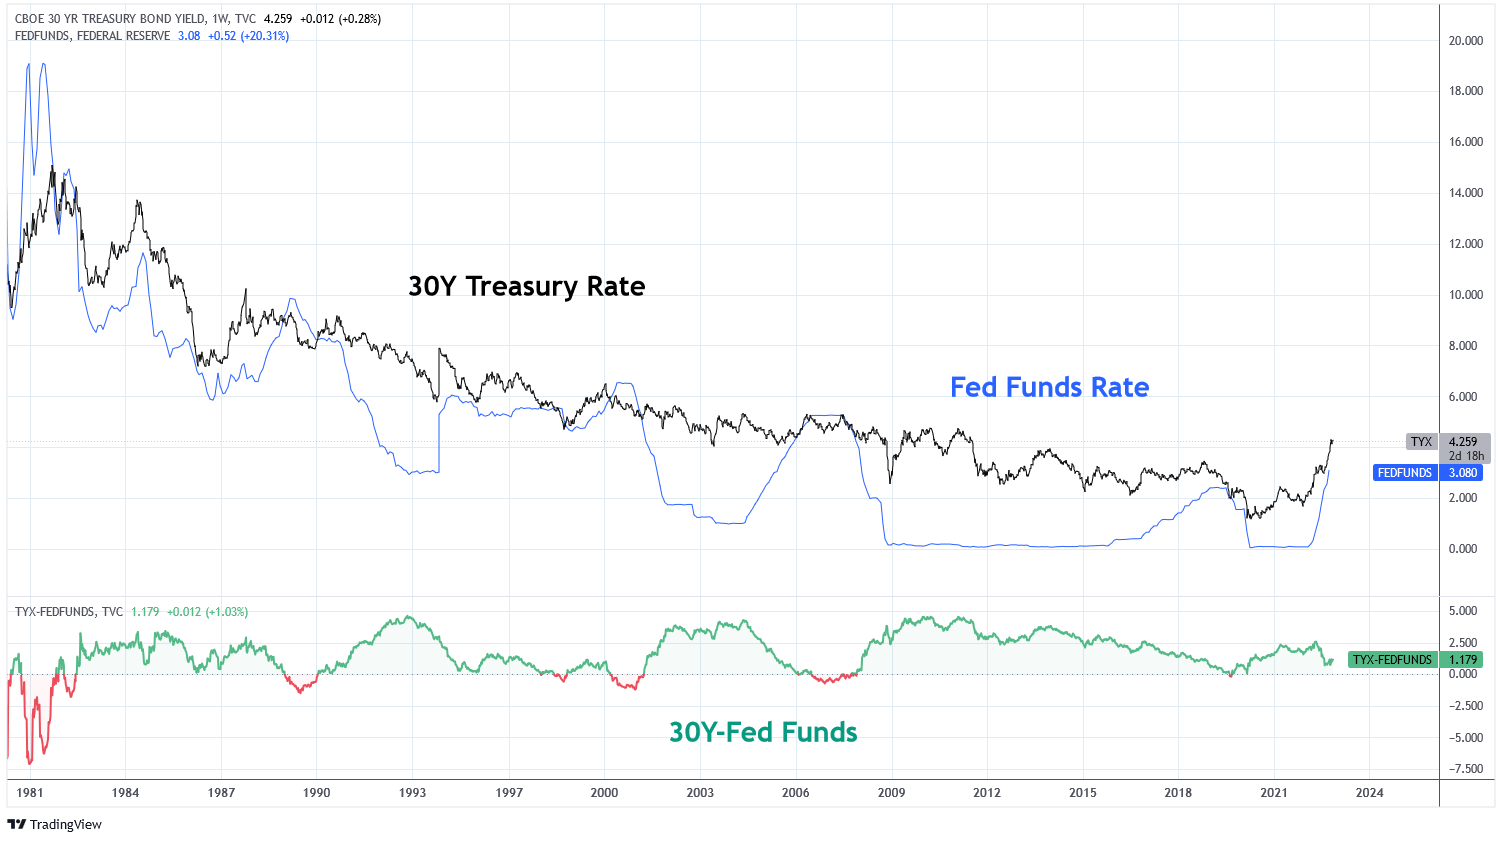
Charts by TradingView (adapted by author)
Another yield curve, the 10Y minus 3M Treasury, has a consistent record of forecasting economic contraction which leads to a rally in long duration bonds and lower rates. Since 1981, the yield curve has significantly inverted four times. In the months and years following each inversion the rate on 30-year Treasuries has fallen. The yield curve has just inverted again last month. It’s too early to determine if this is a significant inversion or a “fake out.” But given economic conditions, my base case is this signal will precede economic contraction and lower rates.
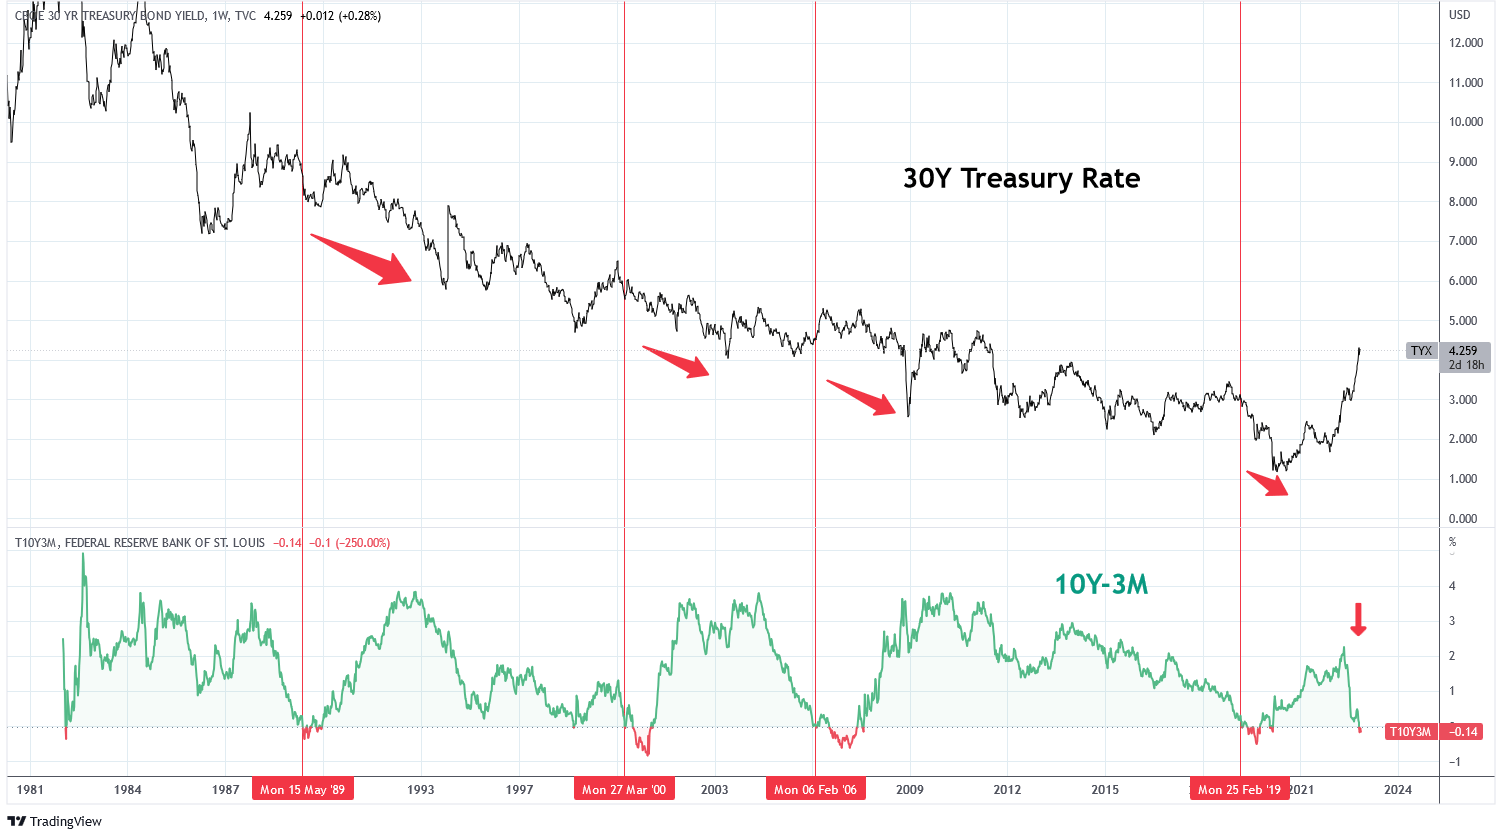
Charts by TradingView (adapted by author)
Inspired by the phrase “housing is the economy” I have come to adopt a version which is “FedEx is the economy.” Because FedEx offers freight services that are used by all facets of the economy the company is a good barometer for economic growth. This is why the share price of FDX tracks the ISM manufacturing PMI and Chicago PMI closely.
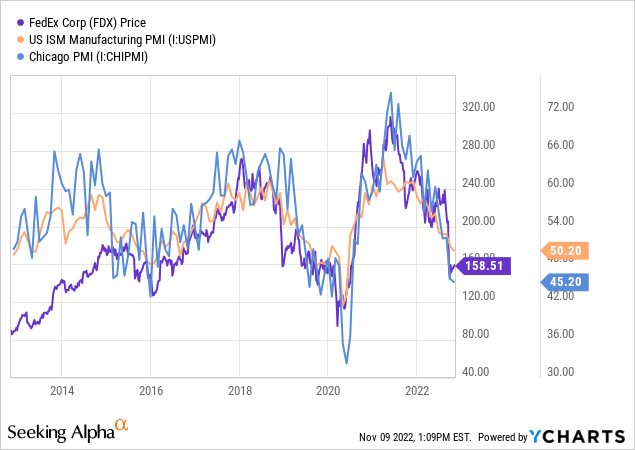
It makes sense, then, that the share price of FDX is often correlated with the inverse performance of TLT as long duration bond rates are inversely correlated with economic growth. The period of 2006-2011 demonstrated a strong inverse relationship between FDX and TLT.

Charts by TradingView (adapted by author)
Between 2015 and 2020 the relationship was again strong. TLT lagged behind FDX in 2020 and 2021, a function of the Fed pinning rates low. Since the Fed began tightening in 2022 the relationship has reversed. While FDX has experienced weakness TLT has been falling dramatically.
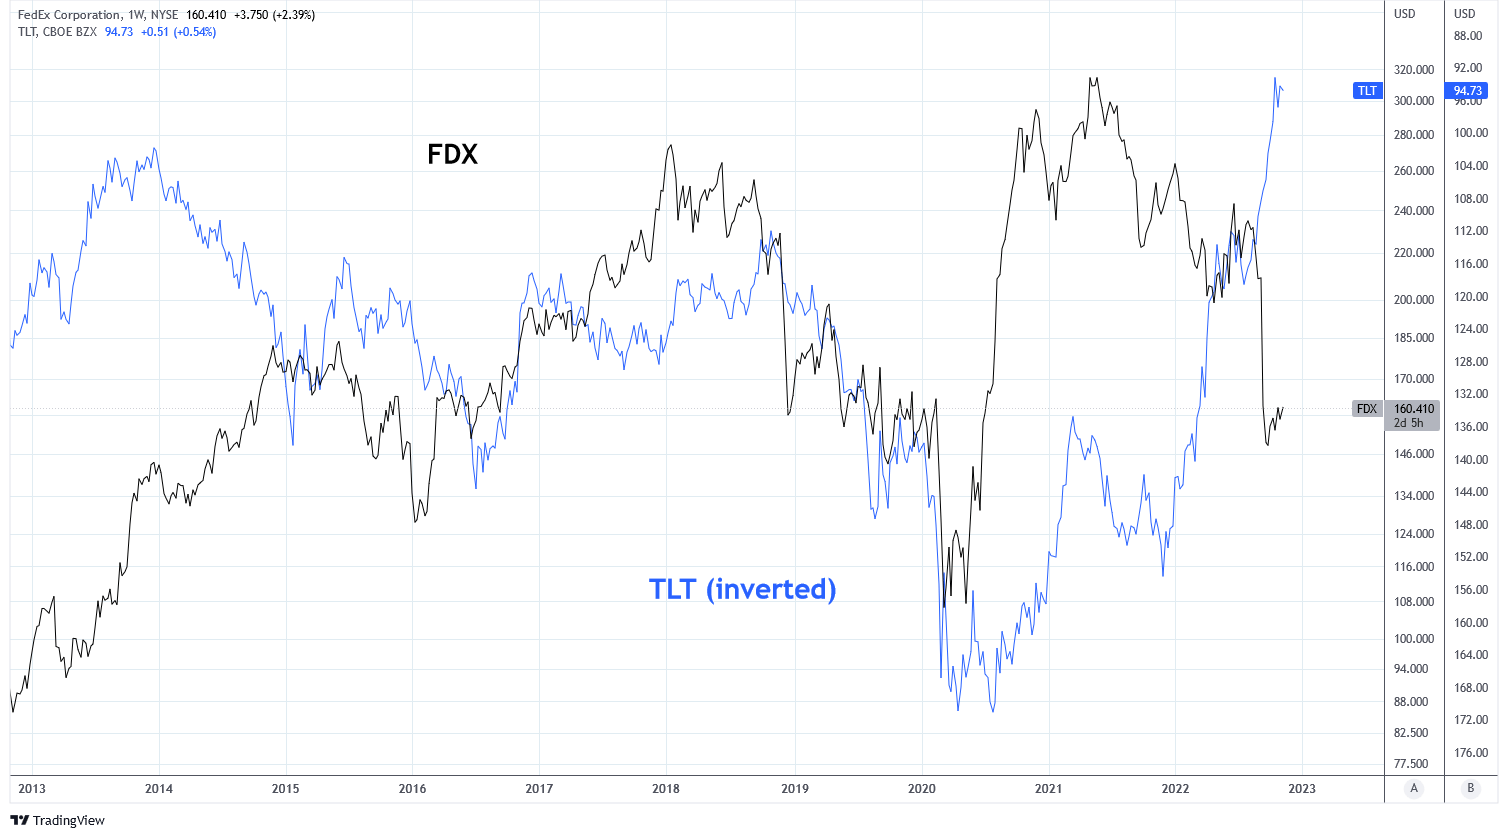
Charts by TradingView (adapted by author)
This is important because FedEx management is guiding for further weakness. During the company Q1 2023 earnings teleconference, Executive Vice President and Chief Customer Officer Brie Carere had this to say:
Starting with Asia, our results were impacted by macroeconomic weakness. Our lower demand is consistent with the broader market, with ocean and air freight rates under pressure in recent weeks.
In Europe, the economy was weaker than we anticipated and service further pressured our results.
Executive Vice President and Chief Financial Officer Mike Lenz said this:
For the remainder of the year, while we are not providing guidance, given current uncertainties, our plan is based on an expectation that the weak trends we saw in late Q1 will persist across our major geographies.
The company says that a looming global recession will cause them to miss revenue expectations by $500 million. In response, FedEx has announced that it is parking planes to manage costs against weaker demand. FedEx is a leading indicator for global economic activity and the company is exhibiting significant weakness in the near term. This is bullish for bonds, eventually. FDX share price suggests that TLT could go to $130.
Buyers and Sellers of Treasuries
Two major buyers of Treasuries have stepped away from the market in 2022: the Federal Reserve and foreign accounts. Both are contributing to the weakness experienced in long duration Treasuries.
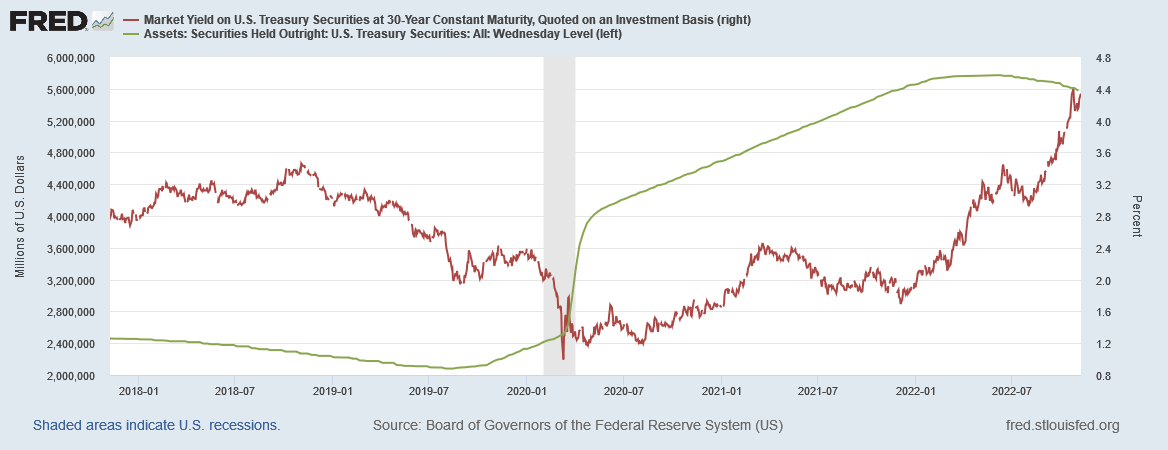
The Federal Reserve began reducing its Treasury bond assets in June. It has been accomplishing this by letting Treasury assets roll off its balance sheet as they mature. The reduction was initially capped at $30B per month with excess maturities being reinvested. In September, that cap increased to $60B per month. Rates have continued to rise dramatically during this balance sheet reduction.
Federal Reserve Economic Data | FRED | St. Louis Fed
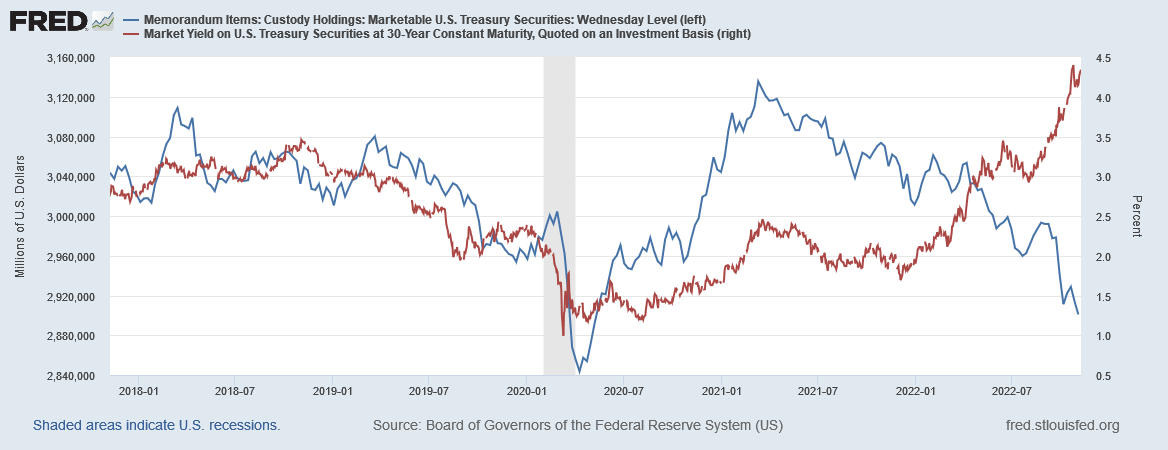
At the same time, the amount of Treasury securities held in custody for foreign official and international accounts has been in decline. This is partially a function of a strong dollar in Forex markets causing foreign governments to sell USD denominated assets to backstop their currencies.
The most notable operation so far has been by the Bank of Japan and the Yen. Last month, Japan reduced its foreign securities holdings by $43.9B and deployed $42.9B in the FX market to support the Yen. It is expected that U.S. Treasuries were included in those operations.
Federal Reserve Economic Data | FRED | St. Louis Fed
Global bond market liquidity is drying up as bond volatility increases. And now, Treasury auctions are demonstrating greater weakness. The latest 10Y Treasury auction on November 9, 2022 is an example of this. The bid-to-cover was 2.23 which is the lowest in 3 years. The tail was 0.032 percentage points, the largest since 2009, and the percent of primary dealers accepted was 24.4% which is the highest since 2021. This was an exceptionally weak auction coming after the last FOMC meeting which was exceedingly hawkish.

Charts by TradingView (adapted by author)
Debt and Demographics
The two main reasons why I remain bullish on bonds in the intermediate term (1-5 years) are debt and demographics. These have been primary drivers of lower yields over the past 40 years and the trends are set to continue.
Public U.S. Debt as a percent of GDP has been rising steadily since 1980. As the debt burden increases rates tend to decline. This has resulted in an inverse relationship with debt to GDP and U.S. Treasury rates. Current Treasury rates are significantly disconnected with the long-term trend of this relationship. I expect debt as a percent of GDP to remain steady or rise which will influence rates lower.

Federal Reserve Economic Data | FRED | St. Louis Fed
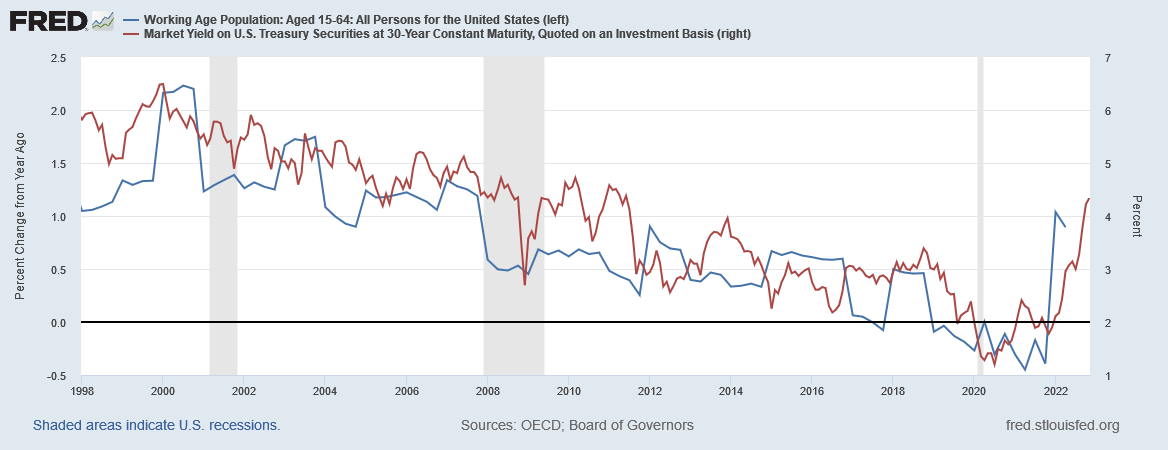
Similarly, the growth of the working age population has been correlated with rates for more than two decades. Aging demographics that result in slower growth of working age persons tends to keep interest rates low. Demographic projections expect the U.S. labor force to continue growing at slower rates in the intermediate future.
Federal Reserve Economic Data | FRED | St. Louis Fed
The Next Trade
Debt and demographics, in combination with recessionary conditions and negative economic growth, are the fundamentals of my bullish thesis on bonds. However, I expect that it is early to be long bonds. The thesis will be difficult to play out until the Fed stops raising rates and buying demand for Treasuries recovers.
I am not interested in going short long duration bonds. I prefer to invest for higher rates through floating rate notes. When I feel that it is time to transition to long duration bonds, I’m considering a covered call trade on TLT like the one below. My current price target on TLT is $82 corresponding to an average yield to maturity of about 5.1%.
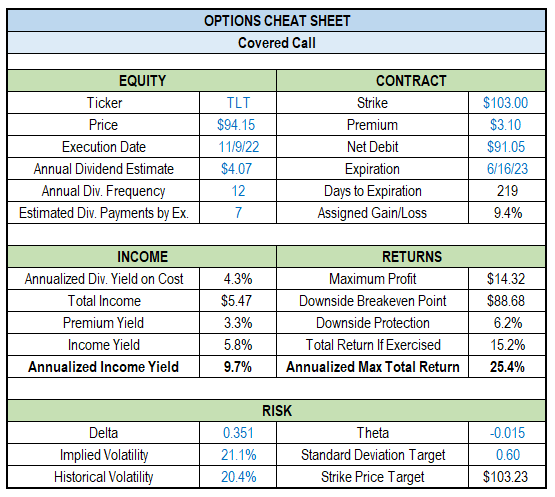
Chart by Author
Summary
Bonds have continued to sell off, led by hikes in the Fed Funds rate. The terminal Fed Funds rate is now 5-5.3% by mid-2023. If this comes to pass, long duration bonds are likely to reach these levels of rates. The 10Y-3M yield curve has now inverted which supports other macroeconomic data that growth recession is likely. Normally, bonds outperform in the period immediately following an inversion of this curve.
This year, demand for Treasuries has grown weak as the Federal Reserve and foreign institutions have stepped away from buying bonds and reduced their reserves. Primary dealers have stepped up to buy the bonds, which is usually a last resort. The bond bear market has become so severe that when it turns it has the potential to produce outstanding returns.
Be the first to comment