

Andrei Berezovskii
The investment thesis
I co-produced an article last week with Sensor Unlimited focusing on the cyclicity of the chip business. The article used NVIDIA Corporation (NVDA) and Micron Technology, Inc. (MU) as examples to illustrate the stage of the cycle we are currently in. The main takeaways from that article were the following two predictions:
- The current contraction cycle will reach its worst in the next 6 to 12 months, if history is of any guidance, i.e., around later 2022 or early 2023.
- Although valuation is forever forward-looking and always reacts more hastily. Historically, valuation has led businesses fundamentals by about 5 to 10 months and seems already raced to the bottom for both MU and NVDA in this current downturn cycle.
The article has been very well received by SA readers (and we’re very grateful and flattered) and has received extensive comments. Many of the comments are so thought-provoking that addressing them would merit separate articles (and we do plan to do that eventually down the road). Today, we want to address the following question that was a common theme in the comment section of our earlier article. The question is: then how about Intel Corporation (NASDAQ:INTC) and Advanced Micro Devices, Inc. (NASDAQ:AMD)? What are their places in the chip cycle?
It is kind of a loaded question, and readers have unpacked it into the following two parts for us:
- What are their places in the current cycle? Or in other words, which stage of the cycle are INTC and AMD in currently? My answer is that it is very similar to NVDA and MU. We will walk you through the analysis next, and you will see lots of similarities to what you’ve seen in NVDA and MU. That is, they seem to be also following the historical chip cycles of 3.5 to 4 years. They are experiencing the downturn stage of the cycle now, and I foresee the current downturn stage to last into late 2022 or early 2023 for all four of them.
- What are their places among the chip stocks? Or in other words, are they more or less cyclical than NVDA or MU? This is the more interesting result for us. And for readers who cannot wait, the answers are in the second last section toward the end (and spoiler alert: MU has been the most cyclical stock and INTC the least). We happen to own both MU and INTC (but not AMD and NVDA). In the final sections, I will also provide some thoughts on why we pick the least and most cyclical ones instead of the ones in the mid.
Finally, in terms of valuation, the market is always forward-looking. And as a result, valuation for all chip stocks seems already raced to the bottom ahead of fundamentals, maybe with the exception of INTC (whose situation is complicated, in a good way in my view, by its foundry initiative). Its bottom may have already passed. And we will elaborate on the nuances toward the end.
Which stage of the current cycle are INTC and AMD in?
First, for readers who are not familiar with my earlier article, the chart below shows the last two cycles for NVDA and MU in the past 10 years. You see the sine wave behavior of growth and decline, with a cyclicality of about 4 years from peak to peak (or bottom to bottom).
Seeking Alpha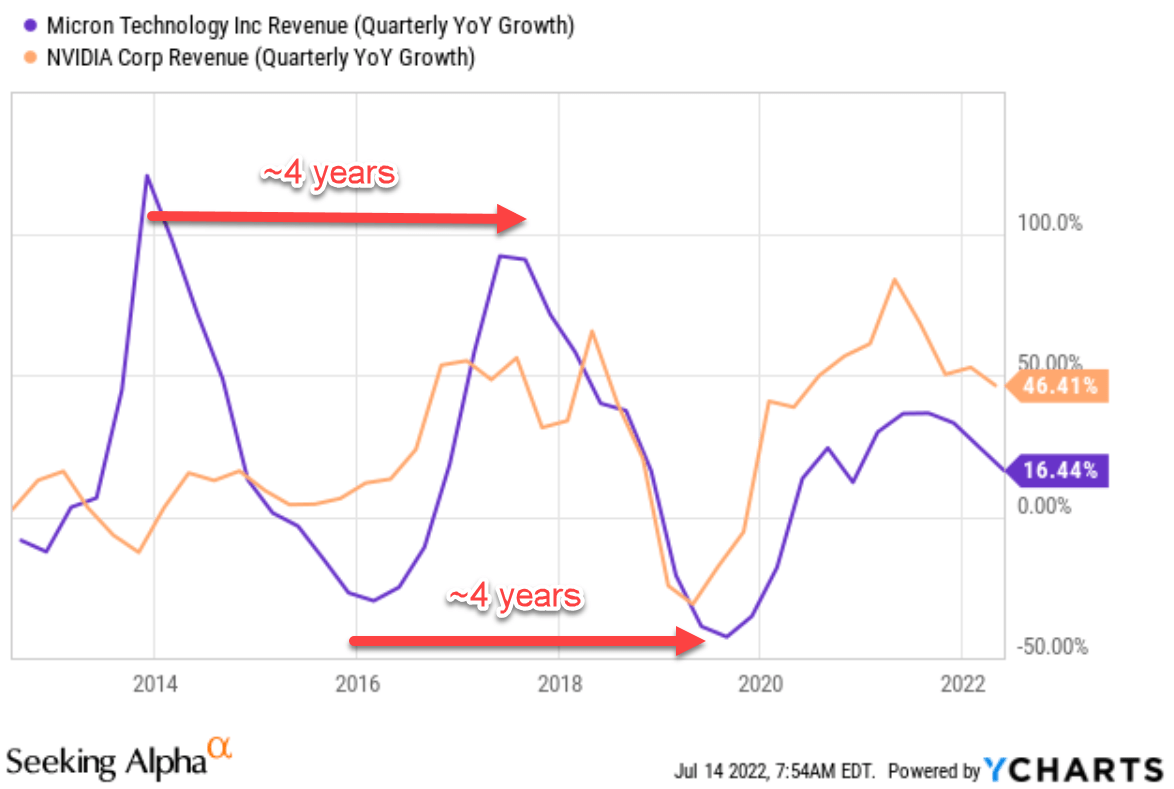
The chart below shows the same information, the quarterly revenues change YoY, for INTC and AMD over the past 10 years. You see the same similar sine wave behavior for both of them. AMD demonstrates the cycles more dramatically and INTC less. INTC is actually the least cyclical one among these four (and we will detail the reasons toward the end). You can clearly see AMD’s previous chip expansion cycle peaked in 2014 and peaked again toward mid-2018, resulting in a peak-to-peak duration of about 4.5 years. Similarly, AMD’s previous contracting cycle reached its worst in mid-2015 and again in early 2019, resulting in a bottom-to-bottom duration of about 3.1 years. The exact numbers show some variances relative to the average 4-year cycle. But they are close enough, and the broader patterns are identical to those observed for NVDA and MU.
Seeking Alpha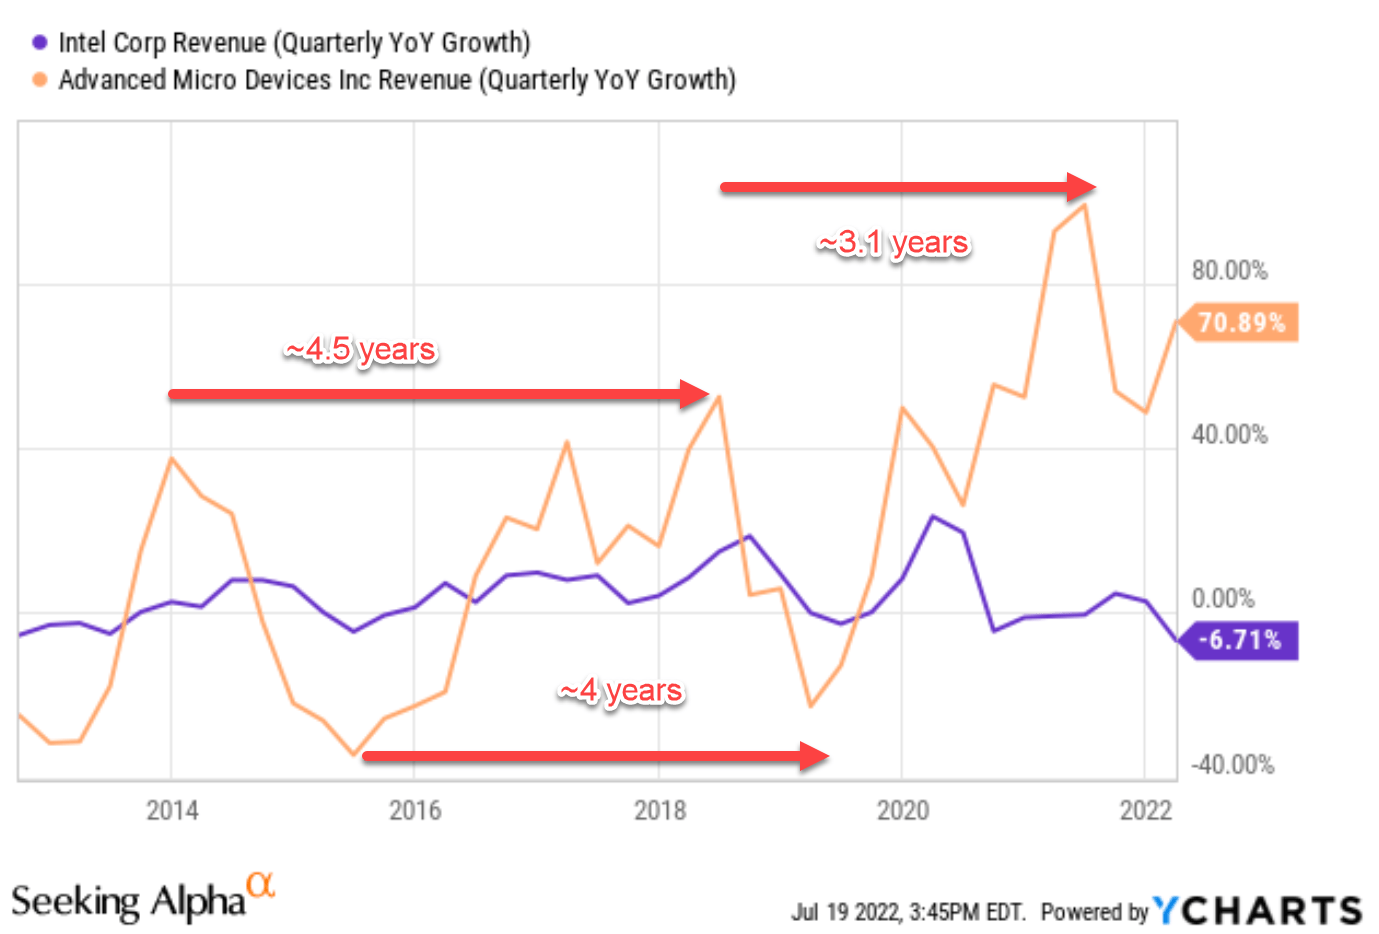
Looking forward, I foresee the next steps to be like the following as detailed in our article last week:
On the demand side, the market will first have to digest the chips that they have hoarded. On the supply side, they will have to sell their own accumulated inventory first, which will take some time as the demand will be lower. Then the next logical step is either to reduce the price and/or also scale back production.
In late June, MU Chief Business Officer Sumit Sadana already mentioned that MU would reduce production. I have not heard about any similar announcement from INTC or AMD yet. But I am seeing similar signs at both places based on their asset turnover rates (“ATR,” aka asset utilization) as shown in the chart below. The ATR for INTC has been fluctuating in a range between about 0.746x and 0.475x with an average of 0.571x in the past 10 years. And its current ATR of 0.475x IS the lower end of that range. Also note the sharp decline of the ATR since mid-2020, when its ATR plunged from the historical average level of 0.571x to the current 10-year bottom level.
The picture for AMD is very similar as shown in the bottom panel of the chart below. The main difference is that it is much more dramatic because the stock is more cyclical than INTC. The ATR for AMD has been fluctuating in a range between about 1.72x and 0.85x with an average of 1.34x in the past 10 years. And its current ATR of 0.849x is also the lower end of that range. Furthermore, note the sharp decline of its ATR over the past quarter. It literally went over a cliff, dropping vertically from the top 25% quartile of 1.52x to the current 10-year bottom level.
To reiterate, I see all four chip stocks in a similar stage in this current cycle, which is the beginning of the contracting stage in terms of business fundamentals. Next, we will examine their valuation cycle, and you will see the valuation cycle always acts more hastily.
Seeking Alpha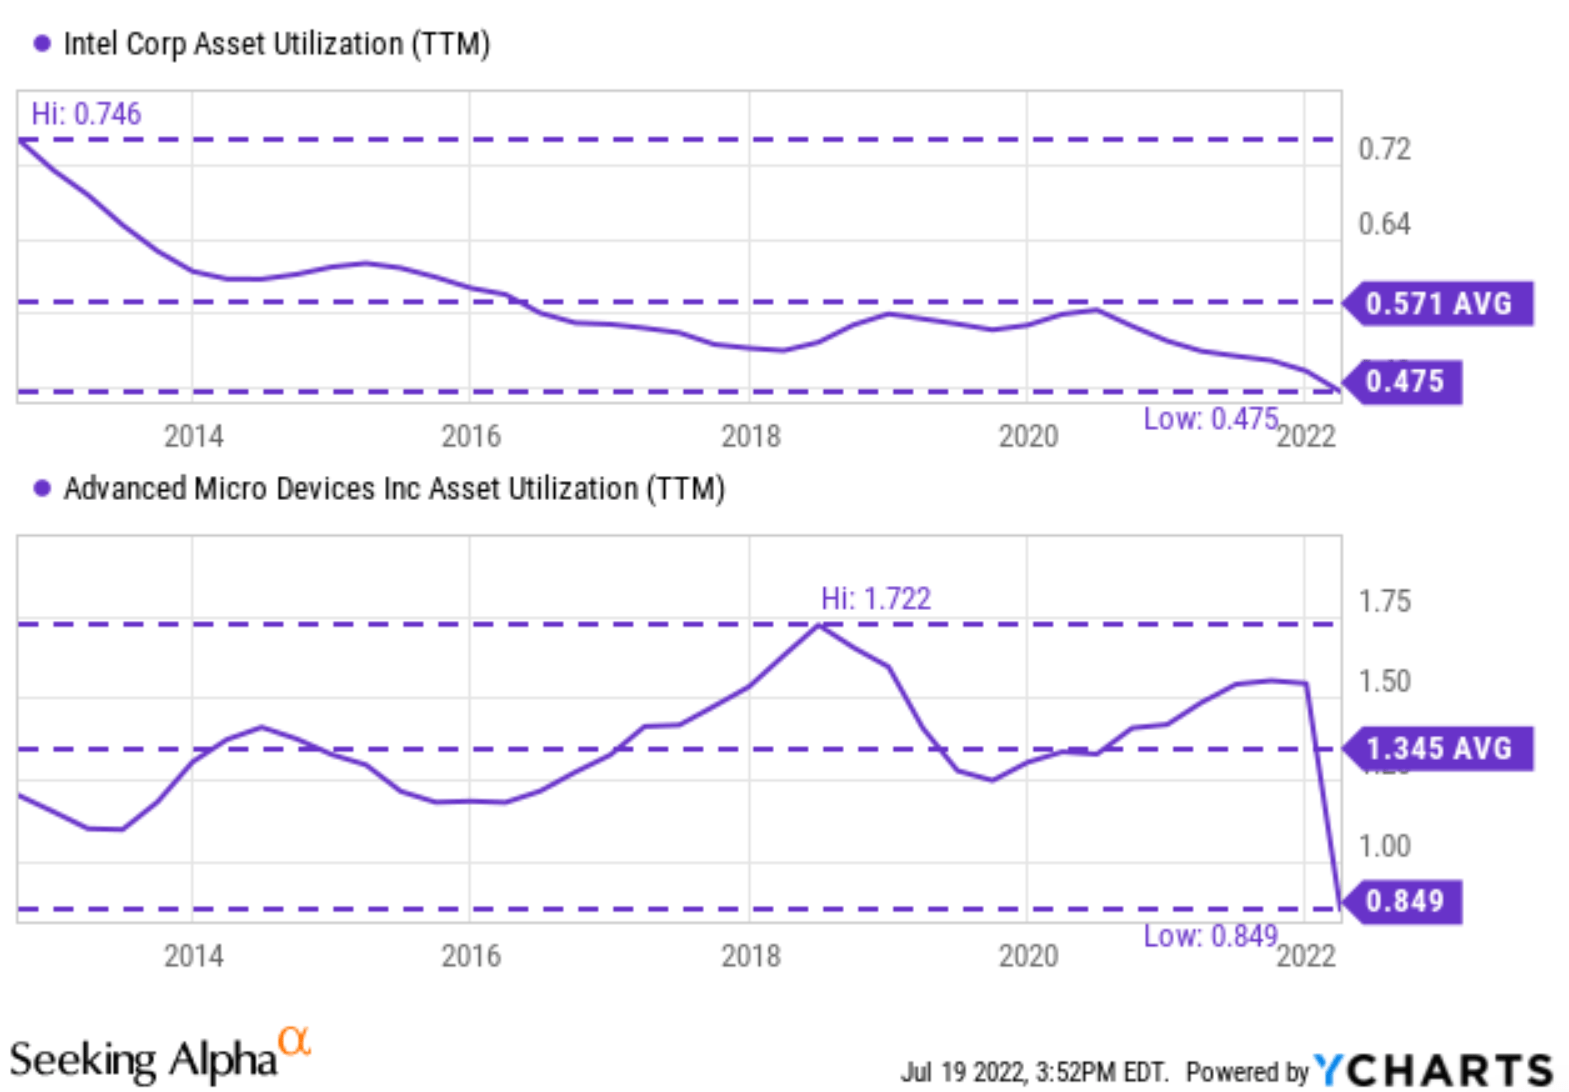
The forever forward-looking nature of P/E
Also as commented in our article last week:
Investors are always forward-looking (like what I am doing here). And the current valuation always tries to price in future developments. For this reason, valuation always leads business fundamentals as you can clearly see from the following charts. Even though the fundamentals have not bottomed yet (actually the chip sector is still reporting positive growth if you recall from the early charts), their PE ratios already reached a multi-year bottom.
The chart in the above quote refers to the next one, illustrating how MU’s P/E (both peak and bottom) has led business fundamentals by about 5 to 10 months.
Seeking Alpha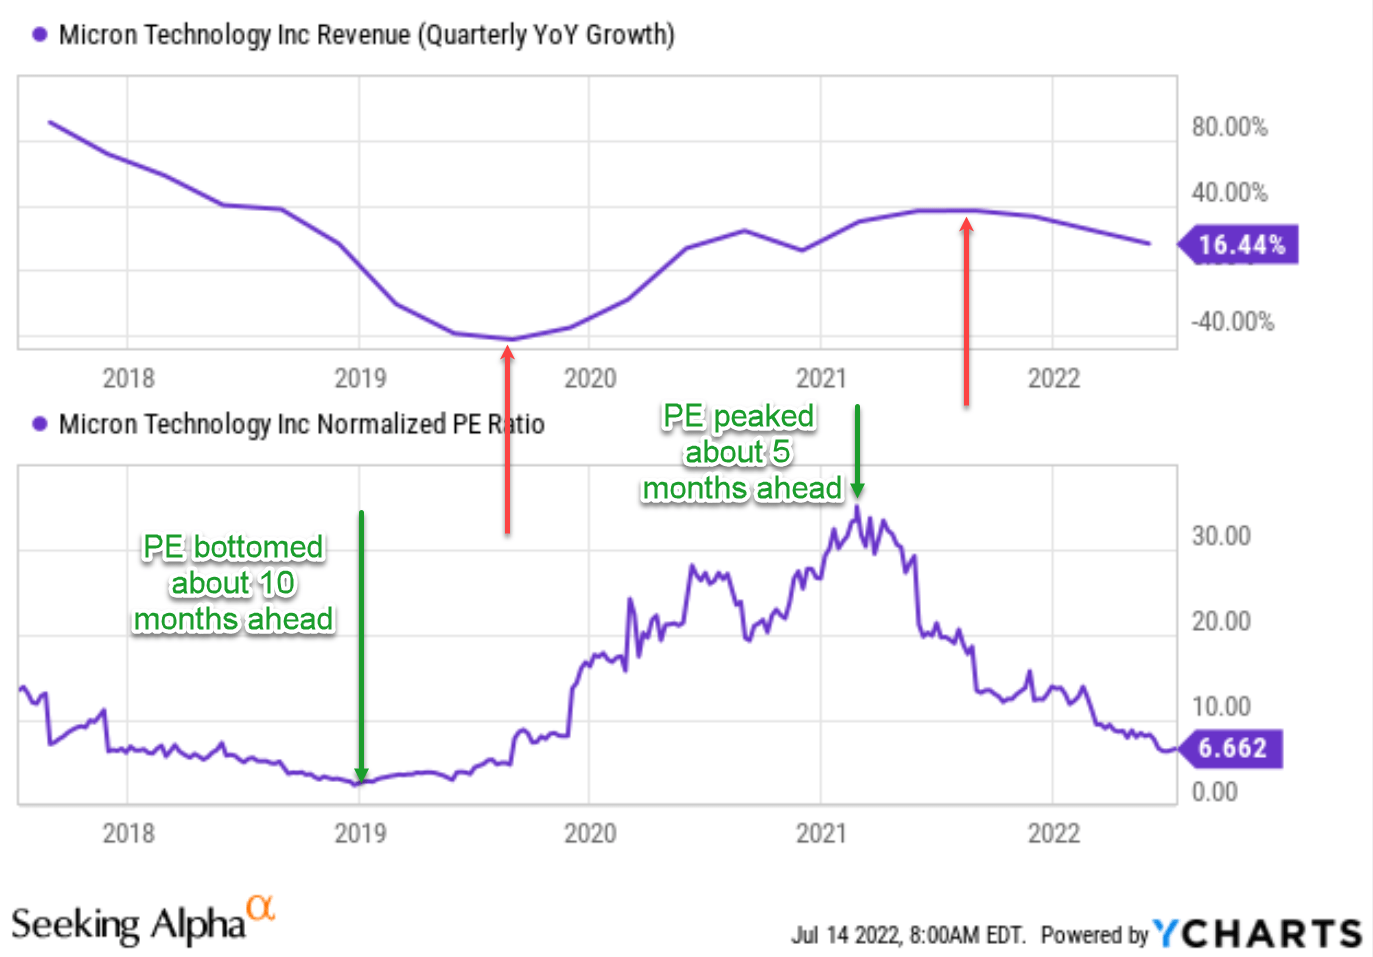
The picture for INTC and AMD are very similar as shown below in the next chart. Here again, their valuations have already reached the bottom as you can see from the following chart even though fundamentals have not (quarterly revenues are still showing positive growth YOY). In the case of INTC, its valuation may have already passed the bottom if you zoom into the data in the past 1 or 2 years. To wit, the lowest normalized P/E for AMD has been about 27.4x and occurred for the last time around mid-2021. Its current normalized P/E of 31.7x is not that far from the 10-year bottom. For INTC, the lowest normalized P/E has been about 8.97x, and it just occurred early this year.
Seeking Alpha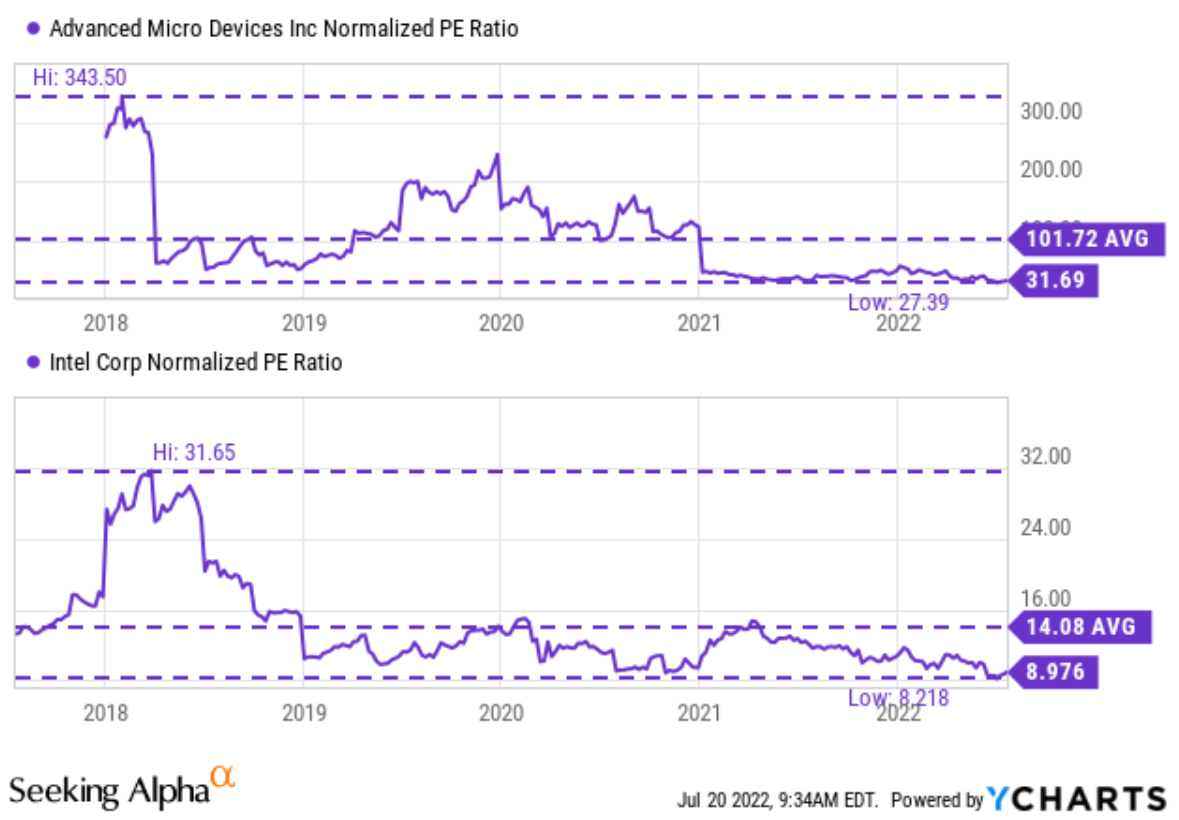
The following chart for AMD illustrates the leading nature of the PE multiple more clearly. The chart shows the YoY quarterly revenue growth of AMD overlaid with its P/S ratio during the last cycle. I am using the P/S ratio here because the earnings for AMD were too volatile in the beginning part of the decade. As you can see, in its last contraction cycle, its P/S bottomed in early 2018, about 1 year ahead of its fundamentals (its contraction did not end till mid-2019). Then in its last expansion cycle, its P/S peaked in late 2020, leading its fundamentals by about 1 year also.
Again, the exact numbers are different from stock to stock and can show some variance. For example, if you recall, the lead in MU’s case was about 5 to 10 months. But in investing, being approximately right (or directionally right) can already help us make sound decisions.
Seeking Alpha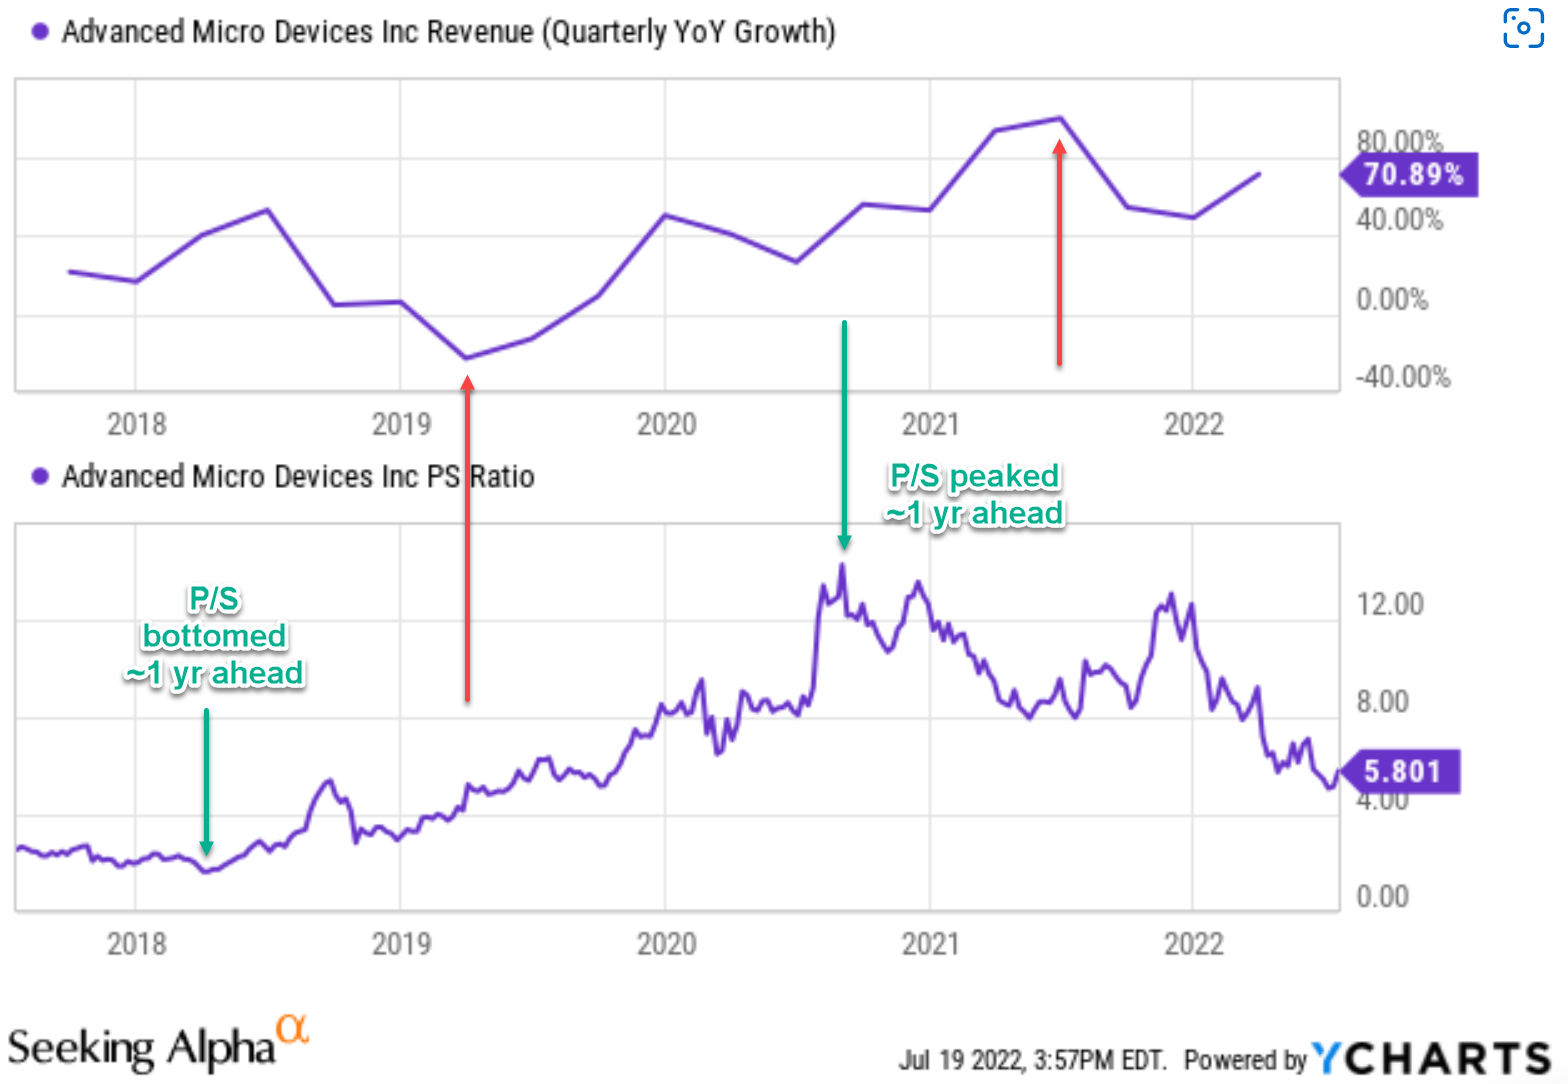
Expected return
As long-term investors, our approach to return projection is relatively simple. Long-term return is the sum of the owner’s earning yield (“OEY”) and perpetual growth rates. Details can be found in our earlier article and the results for these four chips stocks are summarized in the table below. As seen, under current conditions, MU provides the highest expected annual return (17.2%), followed by INTC (14.8%), then by AMD (10.3%), and finally NVDA (9.5%). All four are very attractive now. All of them are offering enticing odds for double-digit annual returns in the long term, far exceeding my projection of about 6% for the overall market.
Author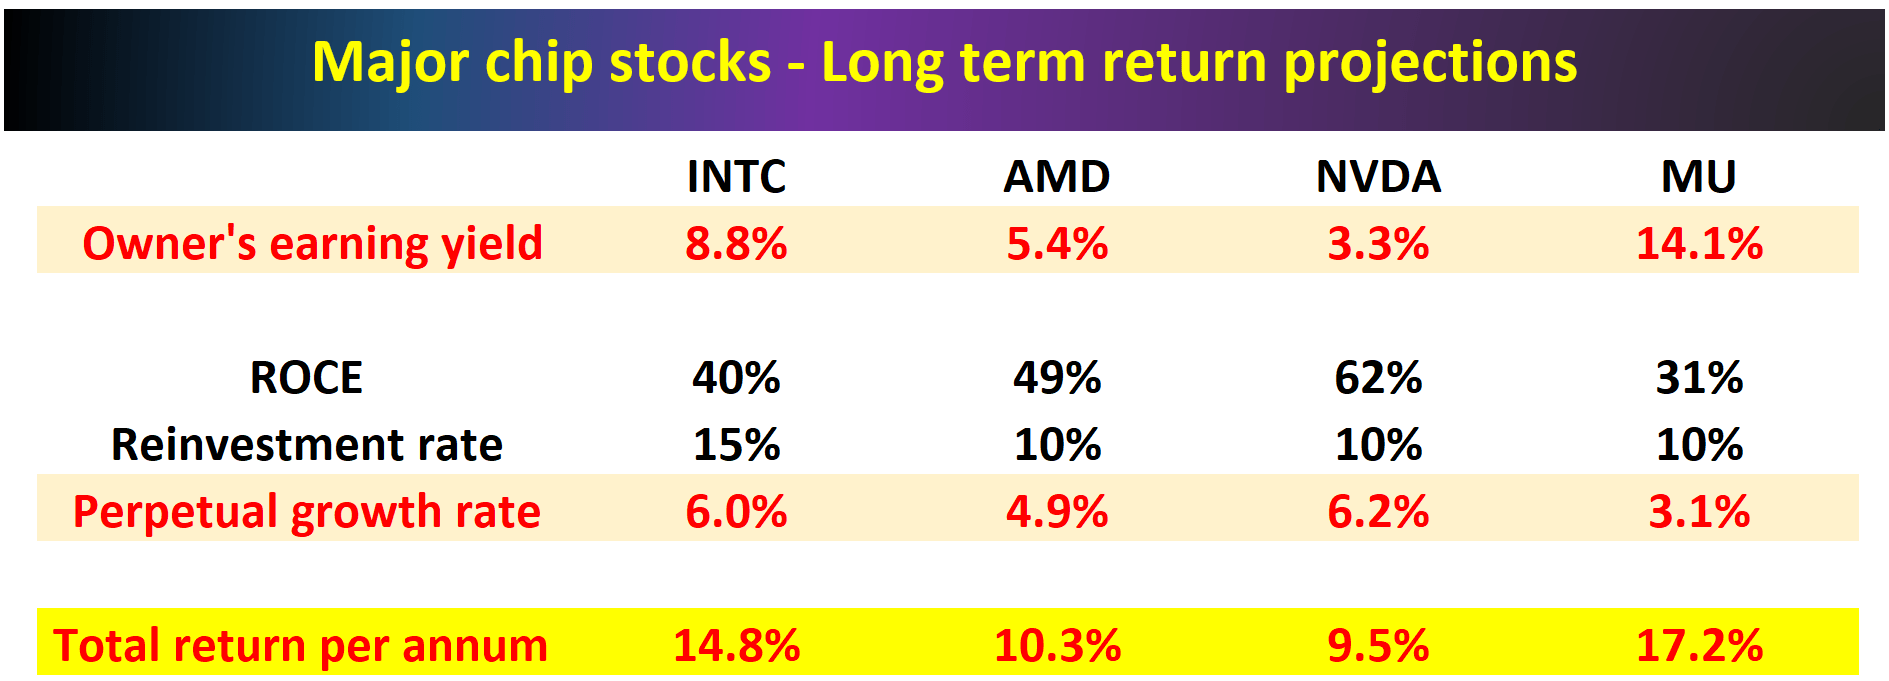
The most and least cyclical chip stock
We’ve touched on this in the previous sections. But here let’s take a focused look at the second part of the readers’ question: what are INTC and AMD’s places among the chip stocks in terms of cyclicality? After reviewing all the results above, my conclusion is that MU has been the most cyclical stock and INTC the least. The reasons are multifaceted. For the sake of brevity, I will only cite the top one.
The first one involves the diversification of revenue sources. As you can see from the chart below, MU is among the least diversified in terms of revenue exposure. It derives more than 85.5% of its revenues from memory semiconductors and another 14.3% from data storage hardware (which add up to more than 99% already). And both memory semiconductors and hardware happen to be among the most discretionary items in the semiconductor ecosystem. In contrast, INTC’s revenue sources are better diversified and less discretionary. Its largest revenue source is Processor Semiconductors (84% of total revenues), but processors are less discretionary than storage devices and INTC still dominates the CPU market. Then for the remainder of 16%, INTC is also better diversified across Memory Semiconductors, Specialized Semiconductors, programmable semiconductors, and consumer vehicle parts manufacturing. Looking forwards, its foundry initiative will further strengthen its diversification, as argued in our earlier article.
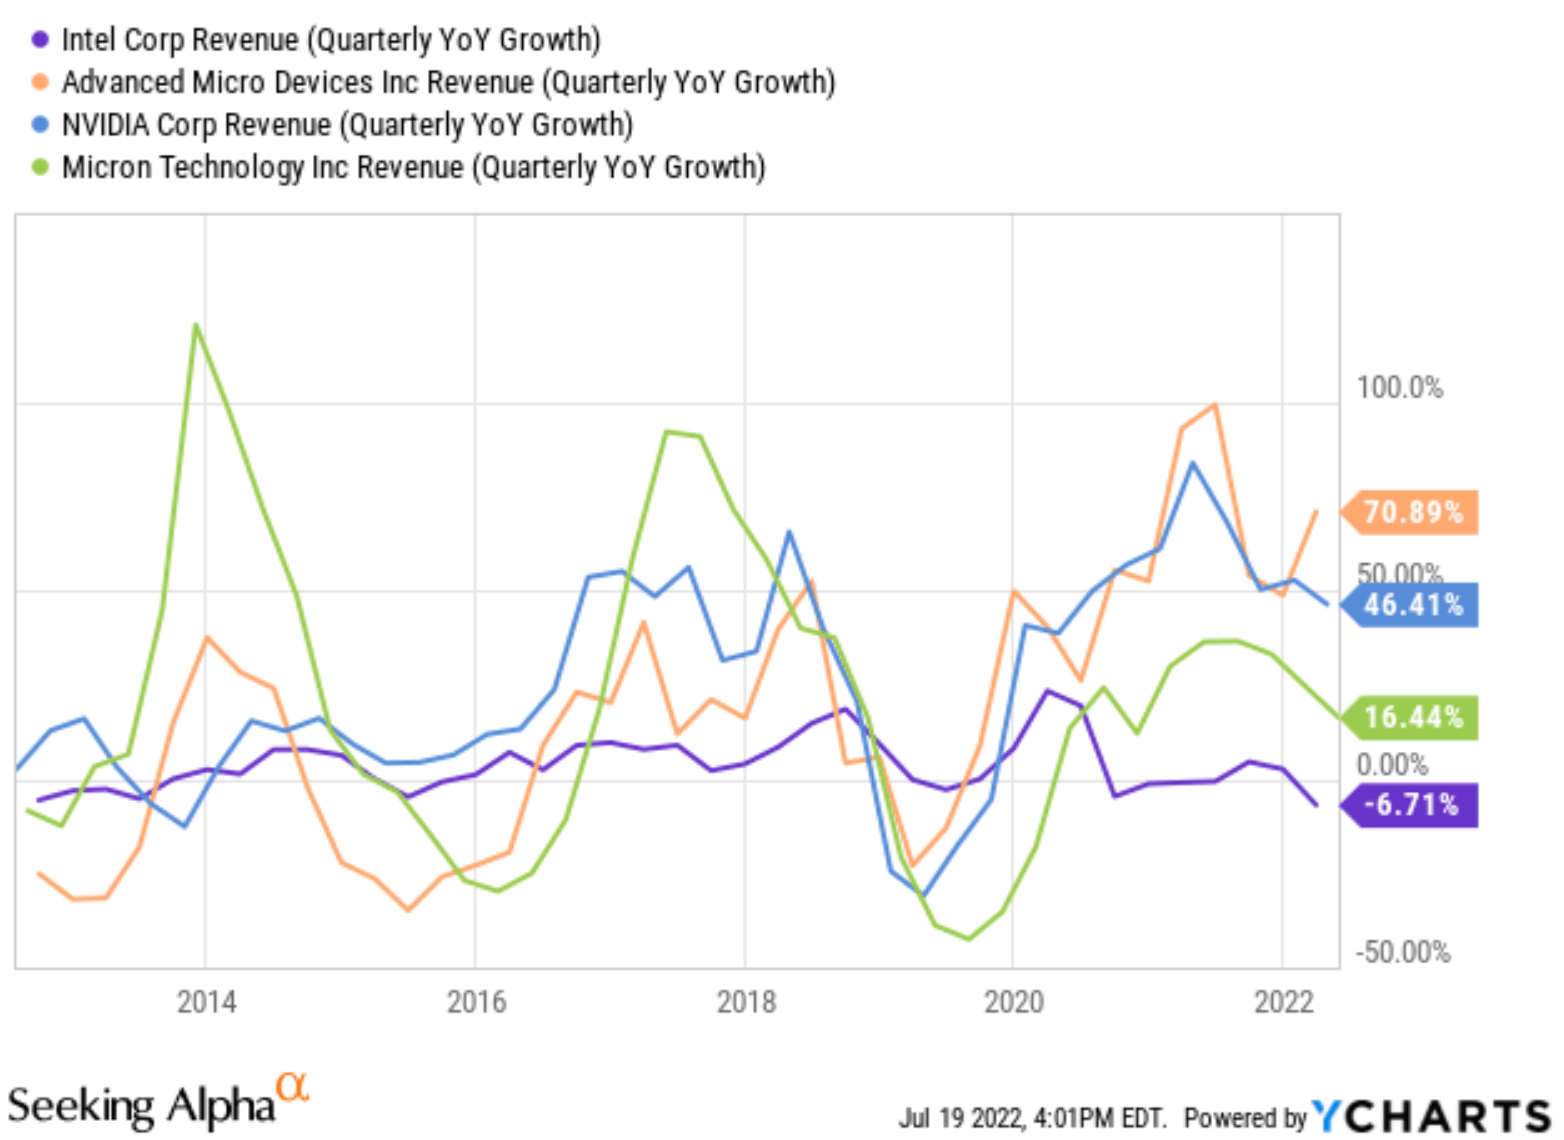
Due to these factors, you can see from the second chart below that MU (the green line) has demonstrated the largest magnitude in its sine wave fluctuation. Peak quarterly growth YoY has been around 100%, and the worst contraction around -50%. In contrast, INTC (the purple line) has demonstrated the smallest magnitude of fluctuation. Both peak growth and contraction have been typically in the teens range.
FactSet Seeking Alpha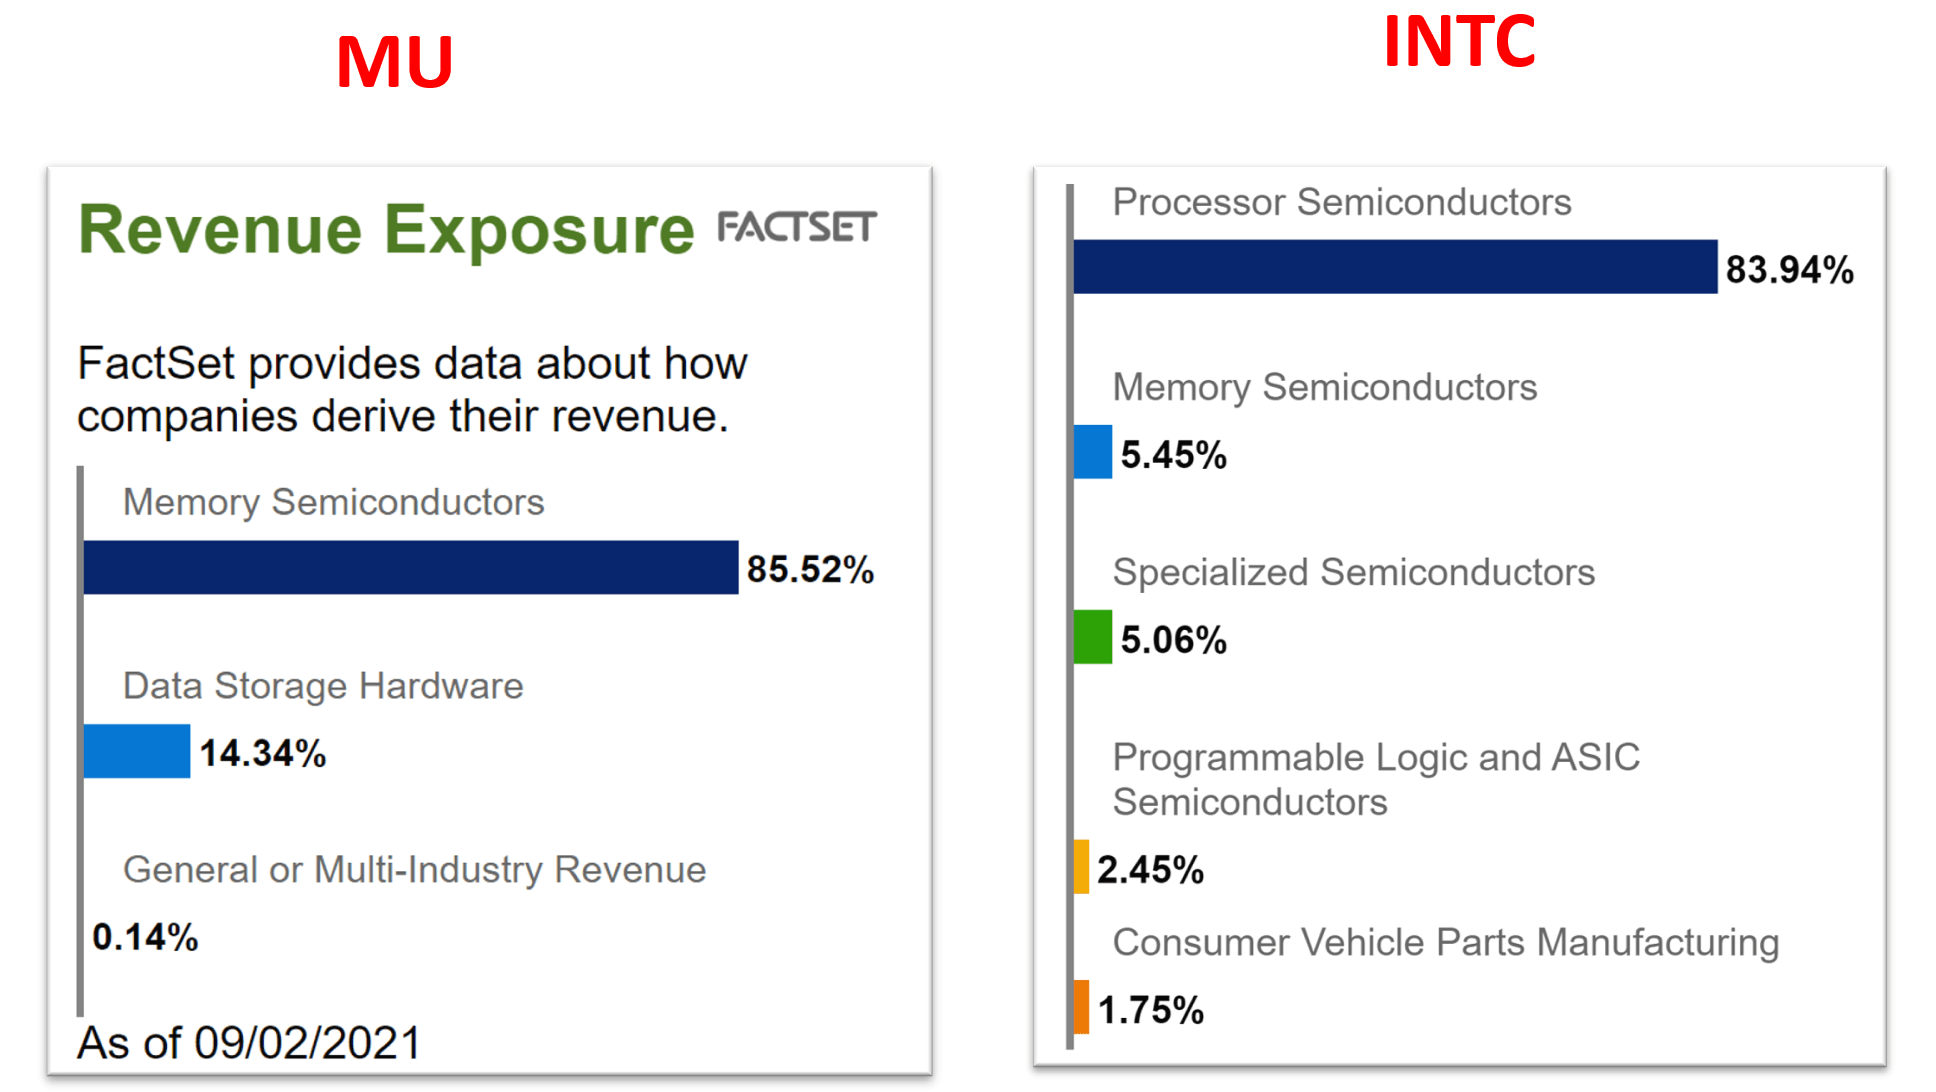
Final thoughts and other risks
To sum up, I see INTC and AMD in a similar stage in the current chip cycle as NVDA and MU. If history is of any guidance, they all have been following a cycle of about 4 years. They are all experiencing the downturn stage of the cycle now, and I foresee the current downturn stage to last into late 2022 or early 2023 for all four of them. In terms of their places among the four chip stocks, MU has been the most cyclical one and INTC the least in the past. And I expect this same trend to act out again in this current cycle.
Now risks and implications for investors. Depending on your view and investment style, being the most cyclical stock in the pack, MU can either be the one with the lowest or highest risk. Obviously, you can argue it has the highest risk because it is the most cyclical. But on the other side (which is the side I am taking myself), you can also argue since it’s the most cyclical stock, its valuation suffers the most contraction during the downturn and therefore leaves the largest margin of safety.
There are also other risks surrounding all chips stocks besides cyclicality. These risks include currency headwinds, geopolitical risks, global supply chain disruptions, sensitivity to crypto mining, et al. These risks have been detailed both in our own articles and by other SA writers. And we won’t repeat them here.
Here I think it is more important to explain our thinking of owning both MU and INTC, the most and least cyclical in the pack, instead of AMD and NVDA (the ones in the middle). Besides the consideration of a margin of safety and INTC’s foundry initiatives, the top reason on my mind for owning INTC is diversification at a grand scale by the so-called barbell model. As I always remind our readers and marketplace members, diversification across stocks is the last consideration in investing. The grand scheme starts with risk isolation. And the best strategy I know from experience for risk isolation is a barbell model – do not invest in something with mild risk. Instead, invest in something with risk above and something below at the same time.
Be the first to comment