


designer491
In seven articles starting on September 13, 2021, I have pounded the table for I Bonds while more or less dismissing TIPS. There were good reasons for both views and I doubt that anyone who was made aware of I Bonds by those articles has a complaint. If they acted on my suggestions they grabbed a very high 12-month yield of 8.1% which served an income investor well whether held as a short term parking place for cash or long term protection against inflation. The long term is a series of shorter terms and it helps a lot to compound money starting with a very strong first year.
Over the course of 2022 things changed. In my most recent I Bond article I noted that Month-Over-Month inflation was beginning to flatten out. That trend has continued. The title of that October 13 article was “I Bond Yield At 8.2% But It Could Be The Last Dance; Time To Load Up If You Haven’t Already.” That headline was borne out by events. My suggestion in that article was to buy I Bonds before the November 1 reset, if you hadn’t already done so. My reasons started with data that suggested that inflation might be slowing down.
How To Think About The Future Prospects For Inflation
The advice to buy I Bonds before November 1 was grounded in the fact that inflation as measured Month-Over-Month had flattened out for the past three months and seemed likely to flatten out further. When it comes to inflation there’s a key point that even sophisticated investors miss. It has to do with what inflation actually is. Inflation is not high prices. Inflation is the rate-of-change in prices. Prices over the past 21 months have risen about 12%. In the aggregate the services and things people buy cost about 12% more than they did 21 months ago.
That 12% is not the inflation rate now, however, unless you want to calculate the inflation rate in terms of recurring 21-month periods. For most purposes, shorter periods tell us more if used in conjunction with longer periods that show the present moment isn’t an outlier. Inflation Hour-Over-Hour is obviously too short except for one period in Argentina in which store owners posted new rates hourly. Months work pretty well, being about as close as we want to go to instantaneous rate of change. If the inflation rate for next month is zero that’s the Month-Over-Month inflation rate: zero.
To get back to where prices were 21 months ago would require deflation – quite a lot of it. Something like this happened twice in the U.S. going back to 1900. Both times happened as a result of war. From 1916 through 1920, because of WWI, the U.S experienced extremely high inflation, much of the time in the teens. Then in 1922 the direction of prices turned around and became deflationary, though not enough to take prices back to where they had been in the middle of 1916. This pattern repeated after WWII with high inflation in 1946-47 followed by moderate-to-high deflation in 1949-50. Again the brief deflationary period did not take prices back to where they had been in 1946. That’s an important point to keep in mind when thinking about the slightly different effect of inflation on I Bonds and TIPS. It also matters to those like me who acquired Gift Box I Bonds to double dip on high rates. Ideally we would like to have them “delivered” in lieu of annual purchases in a year of low inflation or even deflation.
The table below conveys important information about what is really happening right now with inflation. The Year-Over-Year numbers on the bottom row, in decline since June but still quite high, are the numbers which semi-annual inflation-based payments to I Bond holders are based on. They are also the scary numbers the media prefer to use as a headline. In reality, the still high but slowly declining numbers are driven mainly by the earlier base rates a year in the past which are only slowly falling out of the 12-month period. The 12-month rate of change, in other words, is out of date. The Month-Over-Month provides the rate of change which tells you what inflation is doing right now. Glance over the table below:
| Oct 22 | Nov22 | Dec22 | Jan23 | Feb23 | Mar23 | |
| Index | 298.012 | 297.711 | – | – | – | – |
| M/M | 0.41 | -0.10 | – | – | – | – |
| Y/Y | 7.7 | 7.1 | – | – | – | – |
Six Month Percentage Change: To Be Determined (2 months = 0.30)
| Apr22 | May22 | Jun2 | Jul22 |
Aug22 |
Sep22 | |
| Index | 289.109 | 292.296 | 296.311 | 296.276 | 296.172 | 296.808 |
| M/M | .56 | 1.10 | 1.27 | -.01 | -.04 | .22 |
| Y/Y | 8.3 | 8.6 | 9.1 | 8.5 | 8.3 | 8.2 |
Six Month Percentage Change: 3.24% (6.48% annualized)
| Oct21 | Nov21 | Dec21 | Jan22 |
Feb22 |
Mar22 | |
| Index | 276.859 | 277.948 | 278.802 | 281.148 | 283.716 | 287.504 |
| M/M | .83 | .49 | .31 | .84 | .96 | 1.34 |
| Y/Y | 6.2 | 6.8 | 7.0 | 7.5 | 7.9 | 8.5 |
Six Month Percentage Change: 4.81% (9.62% annualized)
| Apr21 | May21 | Jun21 | Jul21 |
Aug21 |
Sep21 | |
| Index | 267.054 | 269.195 | 271.696 | 273.003 | 273.567 | 274.310 |
| M/M | .82 | .80 | .93 | .48 | .21 | .27 |
| Y/Y | 4.2 | 5.0 | 5.4 | 5.4 | 5.3 | 5.4 |
Six Month Percentage Change: 3.56% (7.12% annualized)
Now take a close look at the months from July through the recent November number just reported. Those five-month numbers sum to 0.48, or less than 0.10 on average per month. The numbers are contained in two different six-month periods for I Bonds, so it will be a while before numbers that low make up the total for a six-month period. If these benign numbers persist, we may be headed for a reversion to the hyper low rates of much of the past decade, at least for a while.
What’s The Likelihood Of Returning To Very Low Inflation?
Experts are divided as to whether this series of low rates will continue. Several important inputs to the Urban CPI are idiosyncratic enough that a large move by one of them could move the overall number materially. The most prominent and frequently mentioned input is housing/rent for which reported numbers are rising but with an (hidden) asterisk because of lag time. The important rent number rose 0.8% Month Over Month in November, making it an upside leader, although many observers have noted that leases appear to be no more than even since October. Exacerbating this problem is the fact that rents are smoothed over a six-month period so that stale numbers from six months in the past are still part of the rent number. Jeremy Siegel has been pointing out this rent anomaly for months and has expressed the opinion that the actual present rate of change in CPI-U may well be negative – outright deflation. Nobody knows, but the known facts on rents are a strong indicator that inflation may have peaked and begun to fall.
One other indicator shows a market view that reinforces the likelihood that future inflation will be modest. Market expectation is derived by subtracting the real yield of TIPS from the nominal yield of same-duration ordinary treasuries. Here’s what that shows:
| Term | Treasury Yield | TIPS Real Yield | Inflation Assumption |
| 5 Years | 3.62% | 1.41% | 2.21% |
| 10 Years | 3.44% | 1.28% | 2.16% |
| 30 Years | 3.47% | 1.33% | 2.14% |
Please note: Current numbers like those above have bounced around quite a bit for the past few days and I am using the ones in effect as I prepare to submit this article. The predictions for future inflation have all the virtues and defects of crowd opinion. For what it’s worth, the level of predicted inflation started the year almost 70 basis points higher for the five year and has been declining steadily. If inflation actually hits something like the above rates it may suggest a fairly sharp disinflationary period sooner rather than later. If so, it would be consistent with the average Month-To-Month inflation in the table above. There are quite a few implications for both TIPS and I Bonds. First, though, the next section presents the basic terms of TIPS and I Bonds as set forth on the TreasuryDirect site.
TreasuryDirect Comparison Of TIPS And I Bonds
The table below is a shortened version of the one provided by TreasuryDirect.
| TIPS | I Bonds | |
|---|---|---|
| Type of Investment | Marketable–can be bought and sold in the secondary securities market | Non-marketable – cannot be bought or sold in secondary securities market. |
| How to buy | At auction through TreasuryDirect, or through banks, brokers, and dealers. | Online from TreasuryDirect. Paper: available only using your tax refund. |
| Purchase Limits | Auction: Non-competitive bidding:up to $10 million – Competitive bidding – up to 35% of offering amount | Electronic: $10,000 per Social Security number per calendar year. Paper (through tax refunds): $5,000 per Social Security number per calendar year. |
| Par Amount/Face Amount | Minimum purchase is $100. Increments of $100. | Electronic: Purchased in amounts $25 or more, to the penny. For tax returns, 5 denominations ($50, $100, $200, $500, $1,000). |
| Inflation Indexing | Inflation adjustments measured by CPI-U published monthly | Semiannual inflation rate (based on CPI-U changes) announced in May and November. |
| Discounts/ Face Amount | Price and interest determined at auction. | Electronic I Bonds – purchased in amounts of $25 or more, to the penny. |
| Earnings Rates | Principal increases/decreases with inflation/deflation. Interest calculations are based upon adjusted principal. Fixed interest rate. | Earnings rate is a combination of the fixed rate of return, set at the time of purchase, and a variable semiannual inflation rate. |
| Interest | Semiannual interest payments are based on the interest rate set at auction. Inflation-adjusted principal is used to calculate the interest amount | Interest accrues over the life of the bond and is paid upon redemption or maturity. |
| Tax Issues | Semiannual interest payments and inflation adjustments that increase the principal are subject to federal tax in the year that they occur, but are exempt from state and local income taxes. | Tax reporting of interest can be deferred until redemption but may be claimed annually. Interest is subject to federal income tax, but exempt from state and local income taxes. I |
| Life Span | 5, 10, and 30 years. | 30 years. |
| Disposal before maturity | Can be sold prior to maturity in the secondary market. | Redeemable after 12 months with three months interest penalty. No penalty after 5 years. |
How TIPS Took The Lead In The Middle Of 2022
Between April and July this year the fixed rate of TIPS of all maturities crossed over the zero level below which they had languished since the middle of 2019. The real yield kept moving upward at a steep rate and in October set a new high for the decade. The chart below from the Federal Reserve Bank of St. Louis shows how this recent development in real yields fits into the past ten years of TIPS yields:
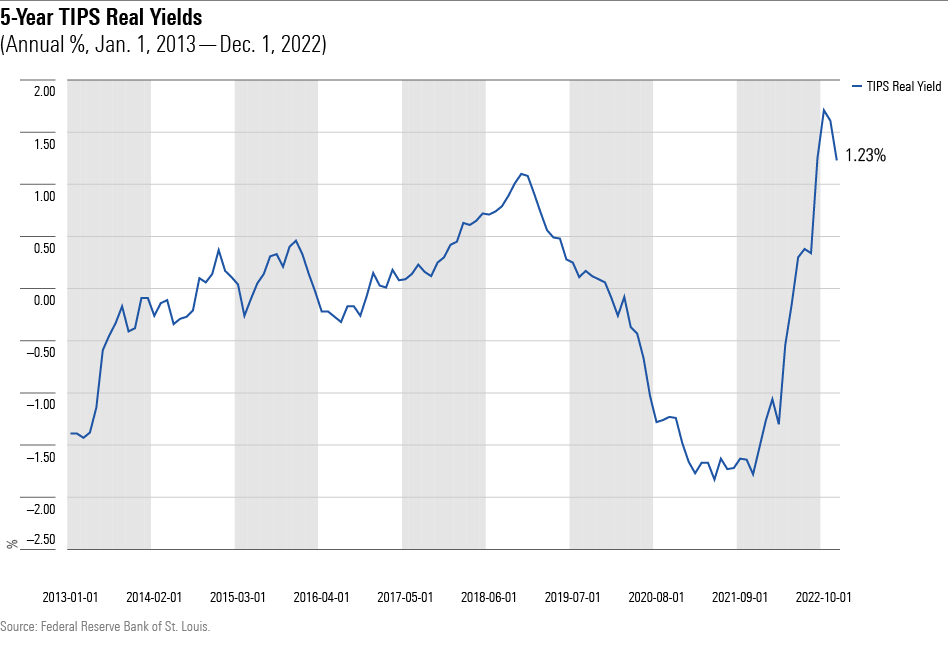
10 year chart of 5 year tips real yield (Federal Reserve Bank of St. Louis)
Chart From Federal Reserve Bank of St. Louis
The Treasury offering on October 16 was set at a real rate of 1.65%, reflecting the rising yield of ordinary Treasuries. TIPS thus had a significant advantage over I Bonds, which currently offer a fixed rate of 0.40%. Since the October auction TIPS rates have bounced around quite a bit, however, trading as low as 1.16% on December 2 and coming back up to 1.48% before falling again to their current rate of 1.44%, having bounced a second time in one day after the Jay Powell press conference suggesting a “final” rate of 5.1%. That’s more than 100 basis points higher than the fixed rate on I Bonds. TIPS have a 1% higher yield than I Bonds, so go with TIPS, right? End of story. Well, not quite so fast. Before deciding that, let’s take a detailed look at the different terms of I Bonds and TIPS going somewhat beyond the comparison made by TreasuryDirect.
TIPS And I Bonds Both Defend Against Inflation, Sort Of
TIPS were first brought forth in 1997 to offer Treasury Bond investors a vehicle defending against future inflation. Series I Savings Bonds (usually called I Bonds) followed in 1998 in order to provide the same inflation protection for small investors who buy Savings Bonds. I Bonds broadly resemble TIPS but have small differences which will be discussed below. Some of these differences are important.
Both TIPS and I Bonds defend against inflation but with one catch. The inflation adjustment is taxable. As a result the inflation protection is actually the increase in inflation minus the amount deducted at your tax rate. When you go to a store to buy things, however, you pay the inflated price of goods without any deduction. Thus you don’t actually “keep up” with inflation. This is also true of your salary or other income, of course, including your Social Security increase or anything like a pension or annuity indexed to inflation. People don’t usually think about this kind of thing. It’s one way that a bit of inflation benefits the Treasury.
The Fact That TIPS Trade Daily Is A Mixed Blessing
TIPS trade daily in the bond market while I Bonds are held inside TreasuryDirect accounts and don’t change hands until redeemed or passed on to your heirs. Both trading and not-trading have their pros and cons. You can sell your TIPS at any time you wish. That’s one of the pros. It allows you to realize cash when you need it. You can also realize a loss, and if you wish buy a different TIPS and start over. Taking the loss may be desirable for tax purposes. This is done all the time with bonds, in particular by insurance companies which, like you, get the benefit of reducing taxes.
Trading means that your TIPS have a different value every day. One consequence which may be undesirable is that TIPS may be pulling in a very good return as inflation adjustments are added to its total value but still be falling in price. This happens because TIPS are, after all, bonds. When rates go up, bonds decline in value, and this bond aspect of TIPS may pull down its price. That’s exactly what happened to TIPS this year as pictured in the following chart:
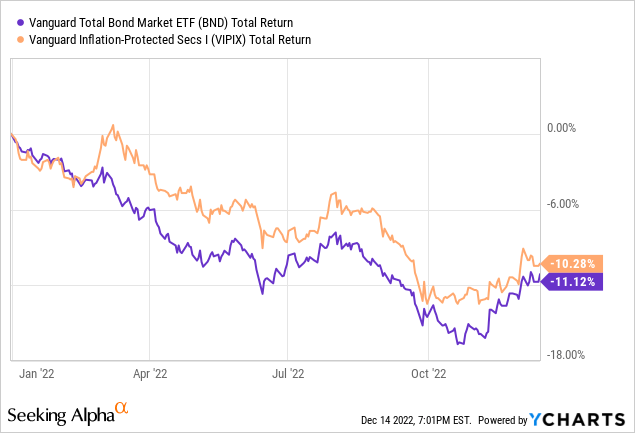
Sometimes a picture is indeed worth a thousand words. Many owners of TIPS and TIPS ETFs and Funds were stunned to find that they were losing money in what should have been a great year to own TIPS. What you see in the above chart is how the bond side of TIPS pulled them down almost to the degree that ordinary bonds went down. Unfortunately, you still owed taxes on the amount of inflation adjustment. That’s separate from the price decline which results from the “bond aspect” of price being pulled down by the same rise in rates that pulls down ordinary bonds. If you need money in a hurry and are forced to sell, you may suffer from a temporary decline in price.
There’s one way to avoid worry about the ups and downs of TIPS prices. That’s simply buying and holding to maturity. If you buy new issues on TreasuryDirect, for example, you know exactly the amount that you will receive at maturity as well as the amounts you will receive semi-annually in fixed rate payments. With a little knowledge about duration you can also calculate this for TIPS bought in secondary markets. If you hold your TIPS at TreasuryDirect there is nothing you can do about the fact that you must pay taxes annually on the “phantom income” received from inflation adjustment. TreasuryDirect will provide a 1099. This early cash outlay cuts the value received in the same way that semi-annual positive cash return for ordinary bonds reduces duration and increases the rate of return on capital.
There’s one thing I must add. Just as bonds fall with rising rates, they rise with falling rates. Rates have fallen a bit since October – you can see that modest rally in the chart above – and may continue to fall in 2023. The key word is may. If that happens, TIPS should rally with bonds. This would make them a good capital gain candidate.
I Bonds Don’t Trade, But They Have Great Flexibility
The fact that I Bonds don’t trade is more a blessing than a problem. They are always worth an amount which can be calculated from month to month. A major virtue is their flexibility. Granted, you can’t redeem an I Bond until 12 months after its month of purchase. Redeeming comes with a sacrifice of one quarter of foregone returns until you have held them for five years. After that, you can sell them without sacrifice for full calculated value at any time of your choosing.
These terms in effect make I Bonds a great short term investment as well as a great investment for up to 30 years. You would not choose TIPS as a short term investment because they might well be down in price after a year. I Bonds are comparable to CDs, and have in recent years offered higher returns. The fact that I Bonds can be long or short term at your whim with known one-year returns makes them unique in the investing world. There are two months, April and October, when you can know around the middle of the month the exact one-year forward inflation adjustment. That’s because the last month before the May 1 and November 1 resets are March and September respectively. The obvious underlying reason is that the April and October numbers are not yet available.
The only thing which may change is the fixed rate, which has generally been small compared to the inflation adjustment. It’s the ability to grab the outgoing rate as well as the incoming rate which has made I Bond buyers rush to buy over the past couple of years. Some have even doubled up using the Gift Box to capture the combined outgoing and incoming numbers. I am one of them.
Some Small Details Favor I Bonds
I Bonds are not only an inflation hedge but a hedge against deflation. In the event that inflation flips to significant deflation for a period, as it did in the aftermath of WWI and WWII, the accumulated inflation earnings of I Bonds remain intact. The worst thing that can happen is that the fixed rate number for the six month period may be reduced by the amount of deflation, but only to zero. That yield is currently 0.40%, a relatively unimportant number. Before that, during the period of high inflation, the fixed rate has been zero, so that deflation would have had zero impact.
TIPS, on the other hand, are protected against deflation by the amount of the fixed rate. TIPS lose some principal value after every month of deflation. This may be seriously damaging if high inflation is corrected by steep deflation. The fact that this would reduce the monthly number for the accrued inflation adjustment could make quite a dent in semi-annual compounding.
I Bonds also offer a tax advantage. The owner may choose to report or not report I Bond earnings on an annual basis. It’s a one time decision at purchase and is binding for the length of time you hold the I Bond. If choosing to defer and pay all taxes at redemption or maturity the owner can potentially accept the taxes at a time when his/her income is lower and taxed at a lower rate. This also is true in the event the owner dies and the beneficiary has a lower tax rate. Deferring taxes is almost always a good idea as pointed out by many models showing the power of enhanced tax-free compounding in IRAs, 403Bs, and the like. Finally, in some cases I Bonds may be used for education expenses without tax consequences.
There’s a little timing trick which can enhance returns on I Bonds and reduce the quarterly sacrifice of income in effect for the first five years. Any I Bonds bought up to the last day of the month earns income for the entire month. For that reason I Bond purchasers can get almost an entire month of added income.
I Bonds have had low inflation adjustments over much of the past decade before 2021 along with a 0.00 fixed rate. Inflation has been enough, however, that their return has beaten most Treasuries most of the time. They have generally trounced TIPS which often sold with negative fixed returns.
While I Bond annual purchases are limited to $10K plus up to $5K as part of your tax return, many I Bond investors – myself among them – have discovered the use of the Gift Box in the recent high rate period. This works by making a pair with a family member or close friend each of whom buys I Bonds in equal amount for the other. There is no limit on the amount although the amount has a $10K limit for each separate transaction. The one real constraint derives from the fact that Gift Box bonds must be “delivered” in the future, and cannot exceed the $10K annual limit. The “delivery” is in lieu of making an annual contribution. I will be watching closely for potential years of suitably low interest rates to have my Gift Box I Bonds “delivered” instead of making an annual purchase. I will write something on the subject if an opportunity occurs.
The Major Advantages Of TIPs
You can buy up to $10 million of TIPS on TreasuryDirect. You can also buy as many as you want on the open market. You can buy them in tax-advantaged accounts in case you wish to avoid the “phantom tax” problem. You can sell at any time. Most brokerages offer TIPS on the secondary market. I notice them frequently in the fixed income section of my Vanguard brokerage account.
Now may be a good time to buy TIPS. Refer to the 10-year chart of TIPS real return fixed rate in the chart above.
The fixed rate for TIPS is now significantly higher than that of I Bonds at all maturities. All else aside, that advantage is important. There’s a reopening of the October TIPS auction on TreasuryDirect at 1 PM on December 22. If you have been hankering to add TIPS you should start paying attention to the likely yield and consider making a bid. There’s also the regular 10-year auction in January.
Conclusion: TIPS Or I Bonds?
Both.
Either.
Which you prefer will depend upon your temperament and your goals.
TIPS and I Bonds have many similarities but also quite a few differences. Both currently have major virtues as laid out above. TIPS have only been this attractive for a brief period in 2019, and unless rates in general turn around and resume an upward path the window of opportunity may close soon. You might commit part of the amount you would maximally commit to TIPS and hold the remainder in reserve. The ratio would depend upon your opinion of the direction in interest rates.
I Bonds may well continue to be attractive. My approach is to wait until April when the inflation return for the May 1 reset will be known. It will build upon what will be the backward looking six-month return of 3.24% combined with the six-month return through March. The fixed rate, currently 0.40%, will not be known for the October-March period until May 1. If the number comes in within the 4-5% area you might wish to buy your annual quota in April. I will write about it at the time. Meanwhile I will do my best as always to respond to all questions included in comments.
Be the first to comment