

Take a leap into the future: time to pivot your investment approach Dilok Klaisataporn/iStock via Getty Images
Introduction
World Bank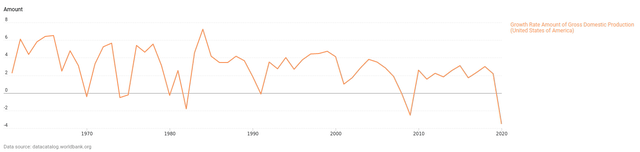
When the economy is growing at an average of less than 3% for a decade or more, as the chart above demonstrates, how can the businesses that make up the economy grow at 16.6% per annum over the period 2011 to 2021?
Consider that for a moment before reading on.
I will explain where this additional value has come from and, more particularly, what it means for the future for your investments.
It would appear that the best strategy over the past ten years has run its course and now is the time to pivot.
I’ll explore passive investing in the S&P 500 (SPX)(SPY) and what that might yield over the next decade. I will then go on to apply the same unique analytical approach to Apple (AAPL), Google (GOOG) (GOOGL), Facebook/Meta (FB) and Amazon (AMZN).
The S&P 500 And Passive Investors
The chart below is fascinating. The dates at the bottom are the secular peaks and troughs in the stock market over the past century going back to the great depression in 1929.
The red line shows the S&P 500 (and equivalent going back in history). Since 1982 it is easy to see the peaks and troughs but due to the scale it is more difficult for the early dates. For this reason I have added the values of the index in red to enable you to see how the index oscillated up and down at that time.
I also plot the market cap of all US stocks against US GDP (this is one of Warren Buffett’s favourite macro-economic metrics). You will note that every market peak coincides with a peak in the market cap to GDP ratio, and the troughs similarly align.
Author’s chart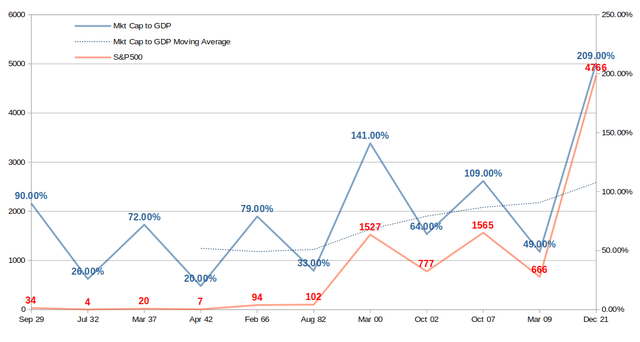
We appear to be at a cyclical peak right now, but more concerning is that we are off the scale relative to the moving average (dotted line).
The moving average trend is upwards. This is easily explained on the grounds that the technology businesses of today grow more quickly than the industrial companies of yesteryear hence the fatter price premiums.
However, that does not fully explain why the market has, in recent years, run so far ahead of itself with an unprecedented 209% market valuation to GDP ratio as at the end of 2021. To understand how this has happened we need to dig deeper and take a more granular look at how we got to where we are. Only then will we be able to formulate an opinion on where we may be heading which ought to inform future investment decisions.
As an investor you must have an expectation for growth in sales per share, changes in profit margins and a reasonable expectation of fair multiple to be paid for those margins. These are the primary elements that will drive your return on investment. The other component will be any dilution or accretion from changes in the share count.
At the beginning of the last decade the net profit margin of 9.2% on the S&P 500 and the average market capitalization stood at 13 times earnings, resulting in an index price of $1,257.60. This was 1.17x sales.
To put things in perspective, over the past century average net profit margins were closer to 6.5%, so 9.2% was historically very high even then.
However, ten years later the profit margin has expanded to a record 13.4% and the index is capitalized at an average 23.6 multiple of earnings, so the index closed 2021 at $4,766.18. This was 3.17x sales which is similarly unprecedented for the S&P500.
When we combine the expansion in net profit margin, the expansion in earnings multiples and sales per share growth which was 3.7% CAGR, the index compounded by a historically eye-watering 16.6%.
This total return can be mathematically broken out (the math is beyond the scope of this article) as follows in order to determine how it was achieved with reference to growth in sales, growth in margins, growth in multiples changes in share count and dividend yields.
We are thus able to reverse calculate the individual components of the 16.6% annual growth for the S&P 500 over the past decade as follows:
Author’s calculations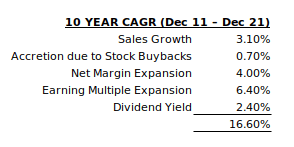
The largest component was the multiple expansion from 13.0x to 23.6x, an increase of 81% which contributed 6.4% annually to shareholder returns. To repeat this over the next decade the average earnings multiple for the index would need to reach 42.7x. That’s never happened before and the long term average is closer to 15x so how likely do you think that is?
The next biggest constituent of the return was the net profit margin which grew from what was already a record 9.4% to a new record 13.4% (see chart below).
Much of this profit growth can be attributed to the tax cuts introduced by Trump (TCJA) in 2017. When these cuts occurred every company in the US received a boost of 21.5% to their bottom line (profit after tax increased from 65c to 79c in every Dollar) and most of this gain has now been competed away. It was a political stunt which caused the market to rally and will not be repeated. More concerning is that the tax cuts are almost certain to be undone by the Biden administration which will have the opposite effect on corporate profits.
Then we have the issue of raging inflation and higher interest rates, both of which will increase operating costs and so adversely impact margins. Interest rates are rising to tackle troublesome inflation with the Fed having already hiked rates for the first time since 2018 and signaled another six rate hikes this year with three more in 2023. This puts US rates at approximately 2% at the end of this year rising to around 2.75% next year. Moving from rates of 0.25% to 2.75% in the space of two years is an 11x increase in funding costs. That eats into profit margins and curtails growth.
Against this backdrop, do you expect net profit margins to move higher or lower in future?
Author’s chart
The chart demonstrates how profit margins are well above long term trend for the reasons discussed above. It also shows the cyclically adjusted price-to-earnings ratio (commonly known as CAPE, Shiller P/E, or P/E 10 ratio) which is price divided by the average of ten years of earnings, adjusted for inflation (hence the different values to the LTM earnings multiples mentioned in the text above). Using CAPE paints a more accurate picture when analyzing a century worth of data.
Earnings multiples are equally unlikely to remain so far above the long term average given that multiples are the premiums that the market pays based upon expectations of growth – we have already discussed that growth in coming years cannot match the past decade which was fueled by lax monetary and fiscal policy supplemented by stimulus from central banks.
So, we must conclude that unless net profit margins move higher from today’s record 13.4% (unlikely) and/or the businesses that make up the S&P 500 are capitalized on an earnings multiple beyond 23.6 (unlikely), there simply is no scope for the index to produce returns over the next decade that are even close to those produced in the last ten years. This was one of the best 10-year periods of all time. As such, index investors will achieve no more than growth in sales per share plus dividends.
Sales growth on a per share basis for the S&P 500 averaged 3.5% for the past decade. Given high corporate and government debt, growth going forward isn’t likely to be any higher. Coupled with today’s average 1.3% dividend yield, the average returns are unlikely to exceed 4.8% per annum.
That doesn’t meet the hurdle rate of many intelligent investors. It certainly does not provide a sufficient equity risk premium over the rising risk-free rate.
More of a concern is that if profit margins contract from their current elevated levels and if earnings multiples contract (equally likely for the reasons given) then investor returns are crushed.
Let us assume that sales growth, share buybacks and dividend yields remain constant but that profit margins move back to the last secular peak of 9.4% and earnings multiples move down to 18x (still above the long term average), this is what the index investor’s annual return looks like for the next ten years:
Author’s calculations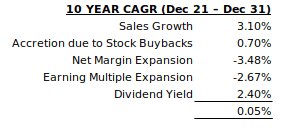
Ouch!
And those assumptions are relatively sanguine.
The passive investing crowd have done well over the past decade. They will experience a rude awakening in the next decade if they expect more of the same.
Now is the time to pivot in terms of investment strategy.
There is precedent for this situation.
The decade from 1989 to 1999 saw a total return of 18.3%
Author’s calculations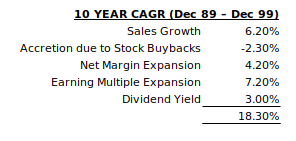
During the 1989 to 1999 decade the earnings multiple expanded from 14.5x to 28.4x, margins expanded from 5.4% to 8.0% and sales grew cumulatively by 78.8% over the ten year period. Share buybacks were not so much of a thing back then and so despite net share issuance diluting shareholders by 2.3% per year, investors still enjoyed an annual return of 18.3% in that period.
However, the decade that followed saw the earning multiple contract back to 19.6x, margins contracted to 6.3% and sales only grew cumulatively by 49.1% over the decade. The result was a negative return for investors on an annual basis of -0.9%.
Author’s calculations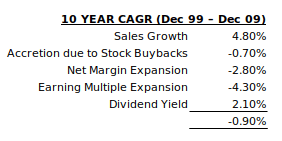
The market is no different from the biblical story of Joseph where seven good years are followed by seven bad years. In this way the pendulum swings back and forth either side of equilibrium.
The situation is no different for individual companies, no matter how good their business. Allow me to demonstrate on a micro economic level with reference to two iconic companies, Coca-Cola (KO) and Microsoft (MSFT).
In 1998 Coca Cola was trading for an eye watering 50 times earnings. The share price in that year peaked at $43. Twenty-three years later the price touched an all time high of $62. That’s a 1.64% CAGR. Twenty-three years of working the multiple down from 50x to 25x resulted in an awful return for anyone invested in an outstanding company with a dominant market position and a very wide moat. Price matters!
As I like to say, even the best company makes for a bad investment at the wrong price.
A better case study is Microsoft which had its IPO in 1986. The fourteen years that followed were remarkable. Annual growth rates were 43% for sales, 51% for earnings and 68% in terms of its market capitalisation. The problem stemmed not from the business, which would continue growing its top and bottom lines at rates that were well in excess of almost all other companies. The problem was the share price which, at 31x sales and 80x earnings, was way ahead of the business.
The primary issue is that when price runs too far ahead of intrinsic value, as was the case here, there will always be a period of consolidation that follows. Either the price will drop back in line with intrinsic value, or else price will stagnate for many years until the fundamentals of the business catch up with the price. It was the latter that happened with Microsoft. In the two decades that followed to 2019 Microsoft continued to experience outstanding growth. Revenue grew at 9.4% per year increasing from $21.8 billion to $134 billion over the period. Profits grew at 7.9% per year increasing from $8.7 billion to $41.6 billion. As an added kicker, because the company repurchased a net 26% of its outstanding shares during that period, the earnings per share grew by 9.9% per year. Yet this time the share price massively under-performed the growth in the business because it was working-off its initial enormous overvaluation in terms of earnings multiple which contracted from 80x to 25x. The eagle-eyed reader will have calculated that although profits increased, profit margins contracted from 40% to 31% which also impaired shareholder return.
So despite sales increasing six-fold and profits increasing five-fold, the market cap in the same period only doubled which amounts to share price growth for the poor investor of 3.6% annually plus dividends which pushed the total return to 5.9%.
Author’s chart, MacroTrend data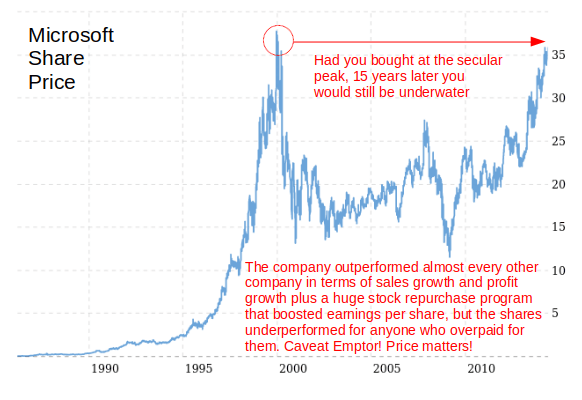
Can you think of any companies today that look a lot like Coca-Cola and Microsoft at the turn of the millennium?
In my mind there are way too many. The next decade or two for investors in these companies will be grim.
Let’s apply the same analytical approach to some of the heavyweights of the S&P 500 today.
Apple, Google and Amazon
Apple has had a roaring decade driven by sales of the enormously successful iPhone and the iPad together with ancillary products and services. Its sales rocketed, it has been buying back stock in large denominations and its earnings multiple expanded from 11.4x to 28.9x in the period. Overall it has shown its investors an annual 28.9% return over the decade. Compounding at that rate is truly impressive.
Author’s calculations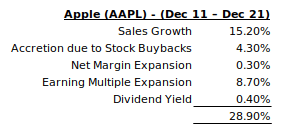
Of note is that net margins at Apple remained relatively constant at around 26% and so that has not contributed much to growth and there is no basis to expect margins to improve in future. They may in fact decline due to increased product competition and disquiet from major developers around 30% fees levied by the App Store. The law of diminishing returns suggests that as a company grows in size it becomes more difficult to maintain the same rate of sales growth. After all, it is far easier to double your customer base when you have only a single customer than when you have hundreds of millions of customers. As a company tends towards saturation its growth rate slows. Even if it is able to maintain the same growth rate as it had over the past decade (unlikely), it can’t justify an earnings multiple beyond 28.9x. Probability suggests that its multiple will contract and its PEG will tend to 1 – it is currently 2.5.
Google provided its investors with a 24.5% annualized return over the past decade. This was driven primarily by an amazing cumulative 580% growth in sales and advertising revenue, 2021 vs 2011. Profit margin was relatively flat around 26% throughout, Google pays no dividends, it expanded its share count over the ten years and so diluted shareholders marginally but its earnings multiple expanded from 21.1x to 28.3x.
Author’s calculations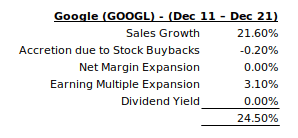
But where will the growth come from in the next 10 years? Unlikely to be from improved margins given that those have been static for the past 10 years. The earnings multiple against growth gives a PEG of 1.34. Perhaps it could hold this level or perhaps it will tend to 1 over time. Either way, it is not likely to contribute to investor returns. Google pays no dividend and so, at best, the shareholder can expect to achieve the sales growth rate going forward. What will the average sales growth rate be over the next decade? Again, Google is running up against the law of diminishing returns due to its mammoth size but I’ll leave you to form your own opinion on this one.
Facebook, now known as Meta, is a timely case study which captures much of the commentary I have given around expectations for the likes of Apple and Google.
Following its IPO, Facebook sales were almost exponential over the decade increasing 3077.8% from where they were in 2011 to where they were at the end of 2021. At the same time net margins, principally from advertising revenue, increased from 18% to over 33%. A combination of strong sales growth and margin growth is just what every shareholder wishes for. All else being equal, on the back of sales growth and improved margins alone, the share price would have gone from $38.23 to $4,835.69 (+12,500%) in a decade.
But all else was not equal. First, the share count expanded 27.1%, which diluted shareholders. Second, back in 2011 Facebook shares were trading at an eye-watering 122.8x earnings meaning that early shareholders paid a hefty premium for the stock and in so doing gave away a great deal of the future upside.
Author’s calculations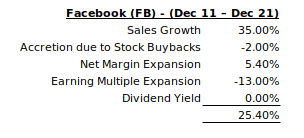
Over the course of the decade the earnings multiple contracted and stood at 23.3x at the end of 2021. This essentially shaved 13% annually off the total return achieved by shareholders. So rather than enjoying compounded growth of over 40% a year, Facebook shareholders compounded at 25.4% (still a great achievement).
Then came the revelation in February 2022 that user numbers had declined for the first time in since Facebook’s inception and the market sold off heavily driving the earnings multiple down further. At the time of writing Facebook trades at 15.18x earnings which is a 35% decline on where it had been at the end of 2021. The result is that anyone that held the shares from Dec 2011 until today has now achieved a ten year compound annual growth rate of 19.1%, rather than the 25.4% as at the end of 2021 (calculation above). What a difference a couple of months can make on a decade of compounded growth! Again, price matters.
Facebook’s challenge is that its users are its product. It doesn’t charge most users for the service and instead sells the captured attention of its users to advertisers. The users are the unit of production and there are only so many people in the world and so many hours of attention capable of being captured each day. Facebook is close to saturation point. Accordingly, sales growth is likely to be muted over the next decade, unless Facebook is able to reinvent itself and monetize its user base in some other way. Last year it poured $13 billion into new ventures in an attempt to achieve this objective. It also tried to reinvent itself by changing its name to META. All of this looks desperate, it points to earnings not being particularly durable and it does nothing to inspire confidence amongst investors. Hence the sell off.
So, with no clear path to sales growth, and net margins already at 33% highly unlikely to expand further, where will growth come from over the next decade? Sure, Facebook may get lucky with some augmented reality venture, but then again it may not. It’s difficult to make a solid investment case on calculable risk versus reward.
Without sales and margin expansion, shareholder returns can only come from multiple expansion (there needs to be a business catalyst for that to happen) or a return of equity to shareholders via share repurchases or dividends. Both would be a major shift of policy for the company which is accustomed to reinvesting all of its earnings in its business.
Finally, let’s look at Amazon which has been the jewel in the crown of this group of star performers. It has grown its top line by 877.2%, 2011 vs 2021 which contributed 26.3% of the annual 34.4% total return enjoyed by shareholders. It expanded its net margin from 1.3% to 5.1% in this period which contributed 14.9% of the annual shareholder returns. What is truly astounding is that it generated a return of 34.4% annually despite paying no dividends, it issued new shares and so diluted shareholders and it saw its earnings multiple contract from 124.6x to 70.7x which, in combination, eroded 6.8% of what would have otherwise been a 41.2% annual return.
Author’s calculations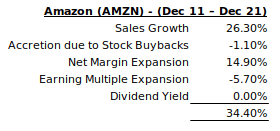
But where do we go from here? Well, Amazon may still have scope to reward its shareholders going forward and so it is my favourite of this group. Net margins are at only 5.1% weighted heavily in favor of low margin e-commerce business, but the higher margin cloud and advertising parts of the business are growing rapidly and so net margin expansion is to be expected. Margins could more than double from here. Sales growth will also continue, although at a lower rate. Ignoring the exceptional COVID pandemic year of 2020, Amazon has seen consistent sales growth in 2019 and 2021 around 21% per annum. This is exceptional, although it is noteworthy that sales growth is slowing from the average 26% per annum over the last decade. The danger, with contractions in growth and an eye-watering earnings multiple is that both are likely to contract which will erode shareholder returns.
If we assume sales growth slows to an average 15% per annum, the company uses its cash to repurchase stock, net margins double over the period but that the earnings multiple halves, then the next decade is likely to provide the investor with an annual 16% return (see table below). Pretty awesome, although significantly lower than the 34.4% of the past decade.
Author’s calculations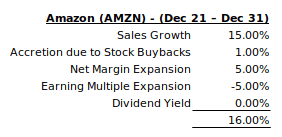
If Amazon does indeed achieve an annualized 16% return over the next decade then that would see the value of the company move from the current $3,000 per share level to $13,000 by 2031 (not adjusting for the imminent share split). I would take that.
Conclusion
In conclusion, passive investing in the S&P 500 over the next decade is not a smart play. Now is the time to pivot. In order to achieve the best returns, an active investment approach is required.
Blindly jumping on board the winners of the last decade is also not a great approach, particularly if all investor return growth drivers have been exhausted and over valuation creates a real risk of multiple contraction in the years ahead.
Of the winners from the last decade, Amazon looks best placed to continue rewarding shareholders as it still has growth drivers. However, the big winners of the next decade are out there just waiting for you to discover them.
I intend to write more on Seeking Alpha in the coming weeks and months with suggestions of the companies which are well placed to be the next big winners.
Be the first to comment