richcano
The case for owning long-term U.S. Treasuries. At first glance, the notion of either holding or establishing a new allocation to long-term U.S. Treasuries may seem utterly mad. We just printed a fresh new cycle high of +9% annualized inflation rate on the Consumer Price Index, and yet the 10-year U.S. Treasury is providing a sub-3% yield. This is effectively a yield of -6% on an inflation adjusted basis. Why on earth would investors even consider owning Treasuries in this currently scorching inflation environment?
The following are just a few of the reasons why investors might wish to consider long-term U.S. Treasuries today. For the purposes of this discussion, I will focus on the iShares 20+ Year Treasury Bond ETF (NASDAQ:TLT).
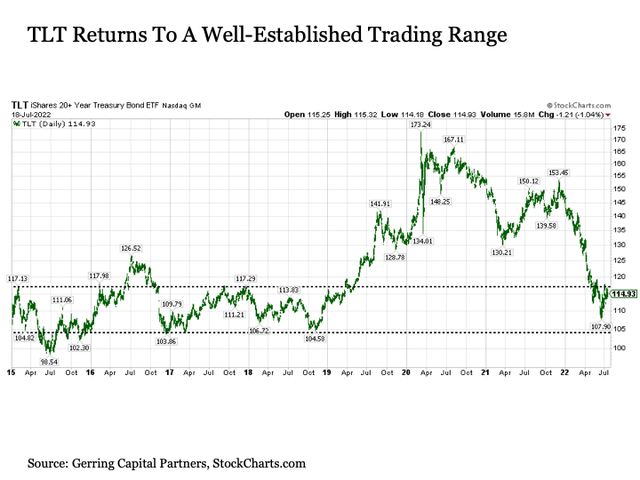
Technical support. I’ll begin with a look at the charts. The decline in the TLT since mid-2020 has indeed been precipitous. But then again, the preceding ascent in the TLT that started in late 2018 but really picked up steam starting in mid-2019 was equally as steep. As a result, long-term U.S. Treasuries have effectively completed a round trip to return back to where they started more than three years ago.
In the process, the TLT has entered back into a well-established trading range between $104 and $117 on a dividend adjusted basis that was in place for more than four years from 2015 to early 2019. As a result, given the extensive amount of buying and selling of long-term U.S. Treasuries that occurred in this trading range for so many years prior to the COVID outbreak, the TLT will be hard pressed to fall below $104 on a dividend adjusted basis without an extended fight.
Why does this matter? Because TLT has a well-established floor of support in the $104 per share range that more short-term oriented investors can use to reference against for any new long allocations.
Economic recession. While the negative GDP growth rate from 2022 Q1 could be debated for its composition (in short, the economy was not nearly as bad in 2022 Q1 as the negative GDP print might imply), the fact remains that if the upcoming release of 2022 Q2 GDP growth ends up negative as the Atlanta Fed GDPNow is currently forecasting, then we will officially be in a recession as measured by the standard textbook definition. Unfortunately, the fact that the U.S. Federal Reserve is also tightening their monetary faces off right now in the midst of a hot inflation firefight suggests that we may end up seeing at least a few more quarters of negative GDP growth through the rest of 2022 and into 2023 before it’s all said and done.
Why does this matter? Because long-term U.S. Treasuries historically perform very well during economic recessions. This is because the “long bond” provides a safe haven for investors during a period of uncertainty that typically includes sharply falling stock prices. Consider the following table below showing the 10-Year U.S. Treasury yield from key dates in and around the last eight economic recessions.
| Date | Yield (%) | Date | Yield (%) | Diff. (%) |
| 12/69 | 7.88 | 3/71 | 5.53 | -2.35 |
| 10/73 | 6.71 | 9/75 | 8.48 | 1.77 |
| 2/80 | 12.72 | 6/80 | 10.09 | -2.63 |
| 9/81 | 15.84 | 4/83 | 10.27 | -5.57 |
| 4/90 | 0.04 | 9/93 | 5.40 | 5.36 |
| 1/00 | 6.68 | 5/03 | 3.37 | -3.31 |
| 7/07 | 4.78 | 4/13 | 1.70 | -3.08 |
| 11/18 | 3.24 | 8/20 | 0.52 | -2.72 |
It should be noted before going any further that when it comes to bonds, yields move inversely to price. Put simply, when bond yields fall, bond prices rise. And the lower the yield, the more significantly positive the impact on price associated with a decline in yields. In each of the above past recessionary periods with the exception of one, 10-Year U.S. Treasury yields fell by an average of two percentage points from peak to trough.
It is important to highlight that many of these past instances either took place during a past period of high inflation in the 1970s and early 1980s (one could even make the case for the 2007-08 period given the sky-high commodities prices before the late 2008 crash despite the fact that the inflation rate itself remained relatively low at the time). As a result, long-term U.S. Treasury yields can still fall measurably during a recession even it is in the midst of a broader high inflation environment.
Of course, the one exception in the above table that stands out is the period from 1973 to 1975, which was in the midst of the first oil crisis in the U.S. and helped define the “stagflation” term that we hear thrown about so much today. This leads to the next important question, which is whether it looks like inflation is going to remain persistently hot for the foreseeable future due to dithering and indecisive monetary policy, or is the back of inflation set to be broken?
Transitory inflation. Yeah, I know the word “transitory” gets thrown around a lot lately in mocking the Fed for having gotten their inflation call dead wrong over the past year. But the reality remains that while the Fed was definitely both very late in taking decisive action against building inflationary pressures and was initially very slow in shifting from easy to tight monetary policy once the alarm bells were finally blaring, if they can succeed in bringing both headline and core inflation back down from recent heights back to historically more reasonable levels in the 1.5% to 3.5% range, then today’s inflation will have still proved transitory at the end of the day. It will have ended up being a tough 12 to 18 months from a pricing standpoint, but it would be nothing like the more than decade of persistently high inflation like we saw from the late 1960s to the early 1980s. And as long as the current Fed continues to get their Paul Volcker on now that they’ve finally gotten there, then transitory inflation (along with potentially a deeper recession versus what we have been accustomed in recent decades) remains the most likely outcome.
But before getting commentarily browbeaten for maintaining this transitory inflation view, it is worthwhile to reference the data. After all, given that inflation more than anything else including budget deficits or the size of the national debt is the primary determinant of long-term U.S. Treasury yields, it is worthwhile to take a closer look to make sure we are getting the right confirmation signals.
For this purpose, let’s consider the 5-year breakeven inflation rate. This is a reading that implies what market participants are expecting inflation to be in the next five years on average based on the spread between the nominal 5-Year U.S. Treasury and the 5-Year U.S. Treasury Inflation-Indexed securities. Beyond the punditry, this is what the “smart money” investors in the bond market that have their careers at stake are estimating at any given point in time.
Federal Reserve Bank of St. Louis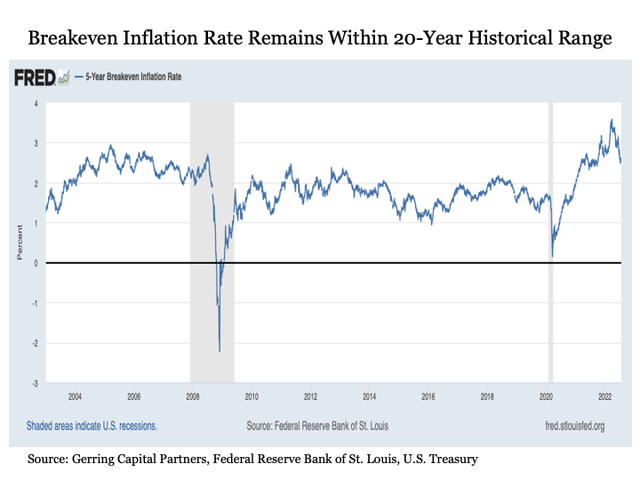
What we see is that the 5-year breakeven inflation rate as of Monday, July 18 was 2.63%. As recently as last week, this reading was as low as 2.50%. This is either at or not much higher than the inflation expectations we have been seeing over the last two decades.
Why does this matter? Because although inflation is currently sky high, the “smart money” is betting that inflationary pressures will soon come back under control (and could even overshoot a bit back to the downside) in order to remain within the 5-year average range that we have seen for so many years. And if inflation is indeed transitory and set to come back down, this is bullish for long-term U.S. Treasuries, particularly in a recessionary environment.
Correlations. Some of the key forces that either drive inflation or are directly influenced by inflation are also signaling support for long-term U.S. Treasuries going forward.
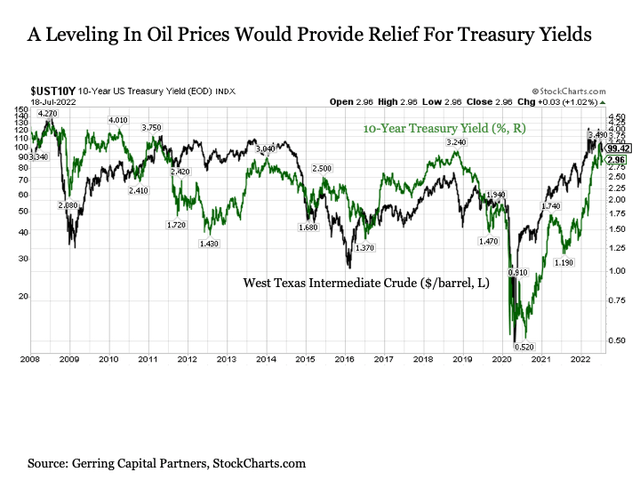
Energy. Consider oil prices as measured by West Texas Intermediate Crude (Brent Crude oil prices also work). These prices move in notably high correlation with the 10-Year U.S. Treasury yield as shown in the chart below. Of course, this relationship makes sense given that oil prices are a primary driver of inflation and inflation is a primary determinant of Treasury yields.
What is this relationship telling us today? That if oil prices level or even marginally fall, this will provide relief for long-term U.S. Treasury yields going forward. As the period from 2011 to 2013 demonstrated, Treasury yields can even fall measurably if oil prices level at a relatively high price. And if the U.S. economy is indeed in recession or set to enter it soon, it would provide a catalyst for yields to fall.
So what would cause oil prices to stop rising from here? According to the U.S. Energy Information Administration in their latest short-term energy outlook released last week, we saw inventory builds in 2022 Q2 for the first time since 2020 that are expected to continue into 2023. This coupled with the expectation that demand may decrease in the coming months due to the slowing economy, that China’s struggles to contain the outbreak of COVID well into the second half of the year, and that non-OPEC producers such as the United States, Brazil, Canada, and Norway have already moved to more than fill the production gap left by Russia are all among the forces that may help cap oil prices in the coming months if not bring it back marginally lower in the near-term.
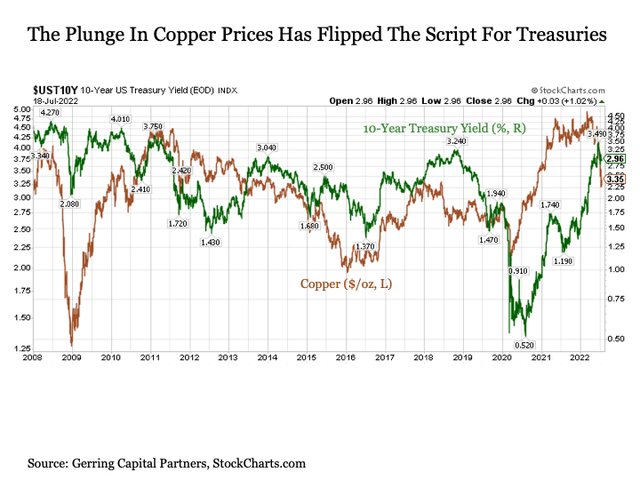
Metals. Next, consider copper prices. While the correlation is not as strong as oil price, it is still notably high to 10-Year U.S. Treasury yields. And after serving as a force to pull Treasury yields higher dating back to the onset of COVID, copper prices have recently plunged and are now at a price that implies lower long-term U.S. Treasury yields going forward.
Bottom line. While it has been a bruising stretch for long-term U.S. Treasuries over the past two years, we may have arrived at a juncture where it is time for Treasuries to find their footing and perhaps start working their way back to the upside in the coming months.


Be the first to comment