

g-stockstudio/iStock via Getty Images
Investment Thesis
For thousands of years, gold has been treasured as a store of value. Besides Central Bank purchases, gold has industrial uses, but jewelry is where most of the gold gets consumed. While gold is considered a good hedge in uncertain times, buying gold mining stocks is considered riskier than holding physical gold. In this article, we’ll look at gold production and consumption, as well as perform technical analysis on gold charts, to see if it’s worthwhile to invest in a leveraged gold miners ETF.
Central Bank Purchases
Central banks will have purchased over 673 tons of gold by the third quarter of 2022 according to World Gold Council. The largest purchases of gold have been by the central banks of Turkey, Uzbekistan, and India so far this year. For retail investors, the fact that central banks have increased purchases in 2022 could be supportive if central banks continue to purchase gold.
Central Bank Gold Purchases (World Gold Council )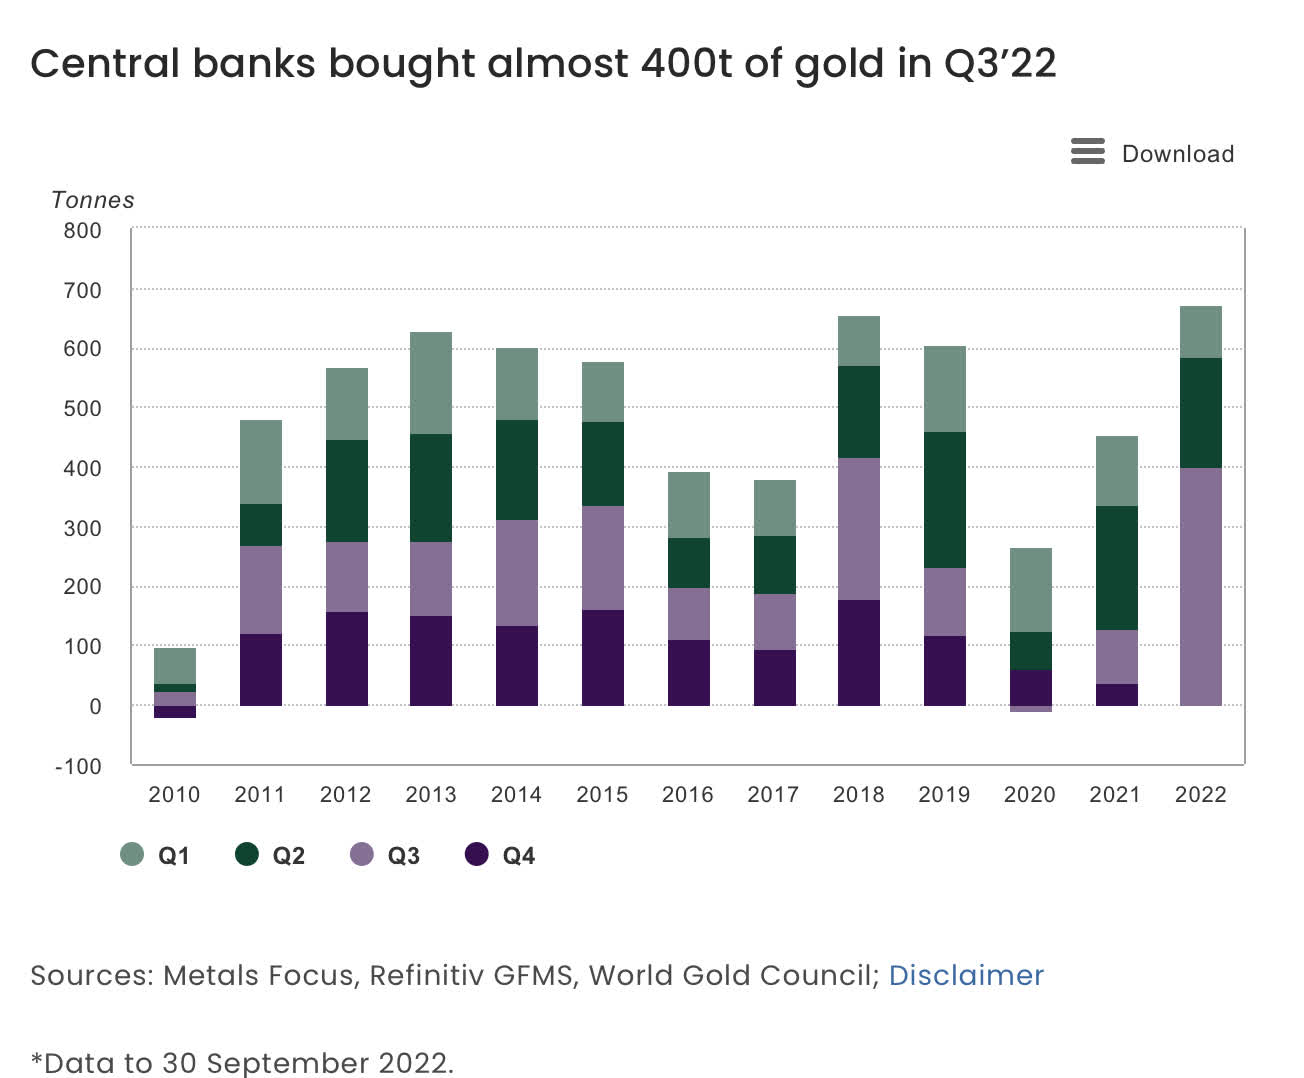
Production and Consumption
Worldwide production of gold was just under 4,700 tons in 2021, down from production in 2020 or 2021.
Gold Production (World Gold Council ) Gold Production 2021 (Statista)

Global gold consumption was just over 4,000 tons in 2021, after subdued demand in 2020.
Gold Consumption (Author )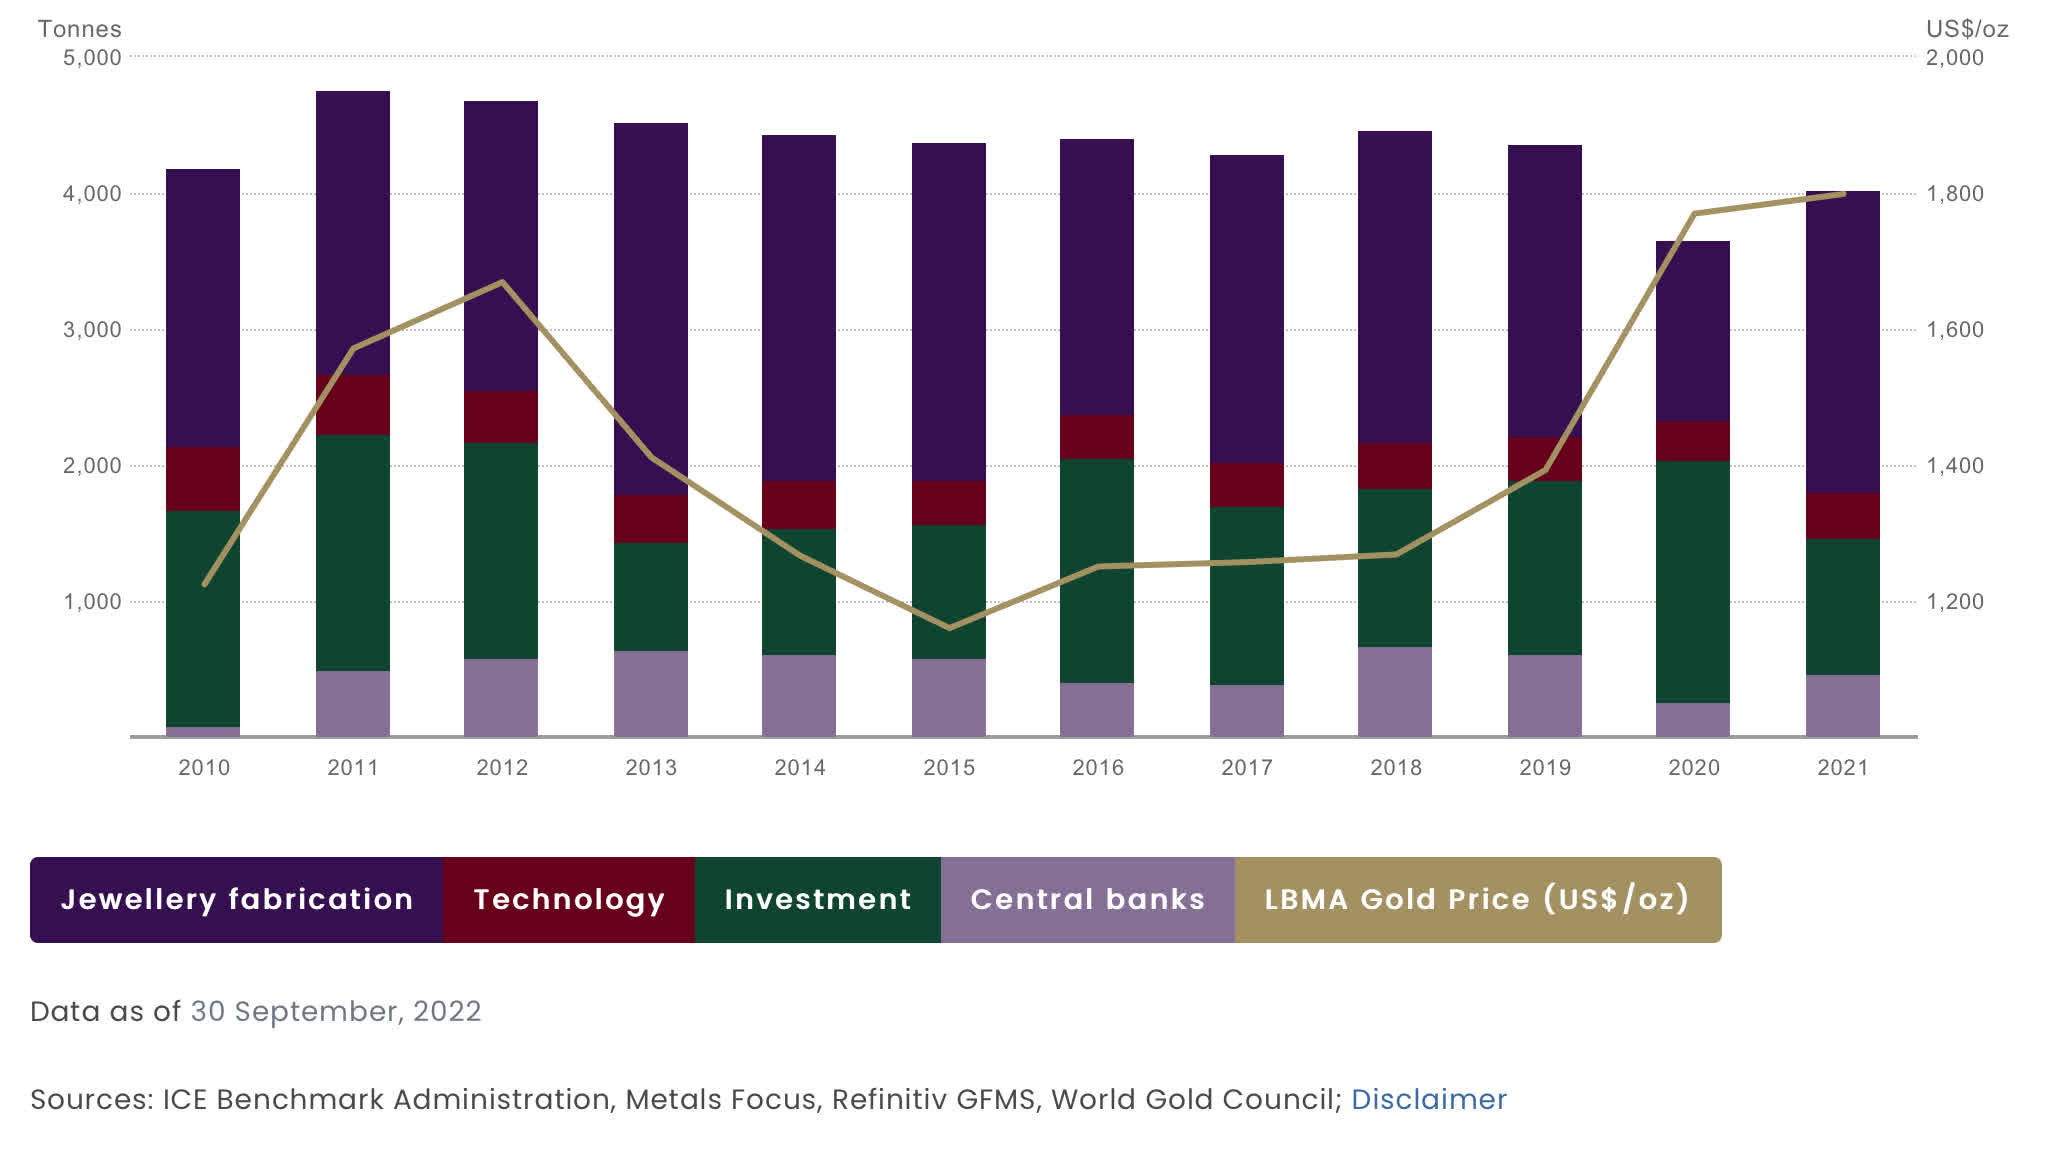
In 2021, jewelry accounted for 2,230 tons of over 4,000 tons of gold consumption in 2021.
Gold Consumption 2021 (Statista )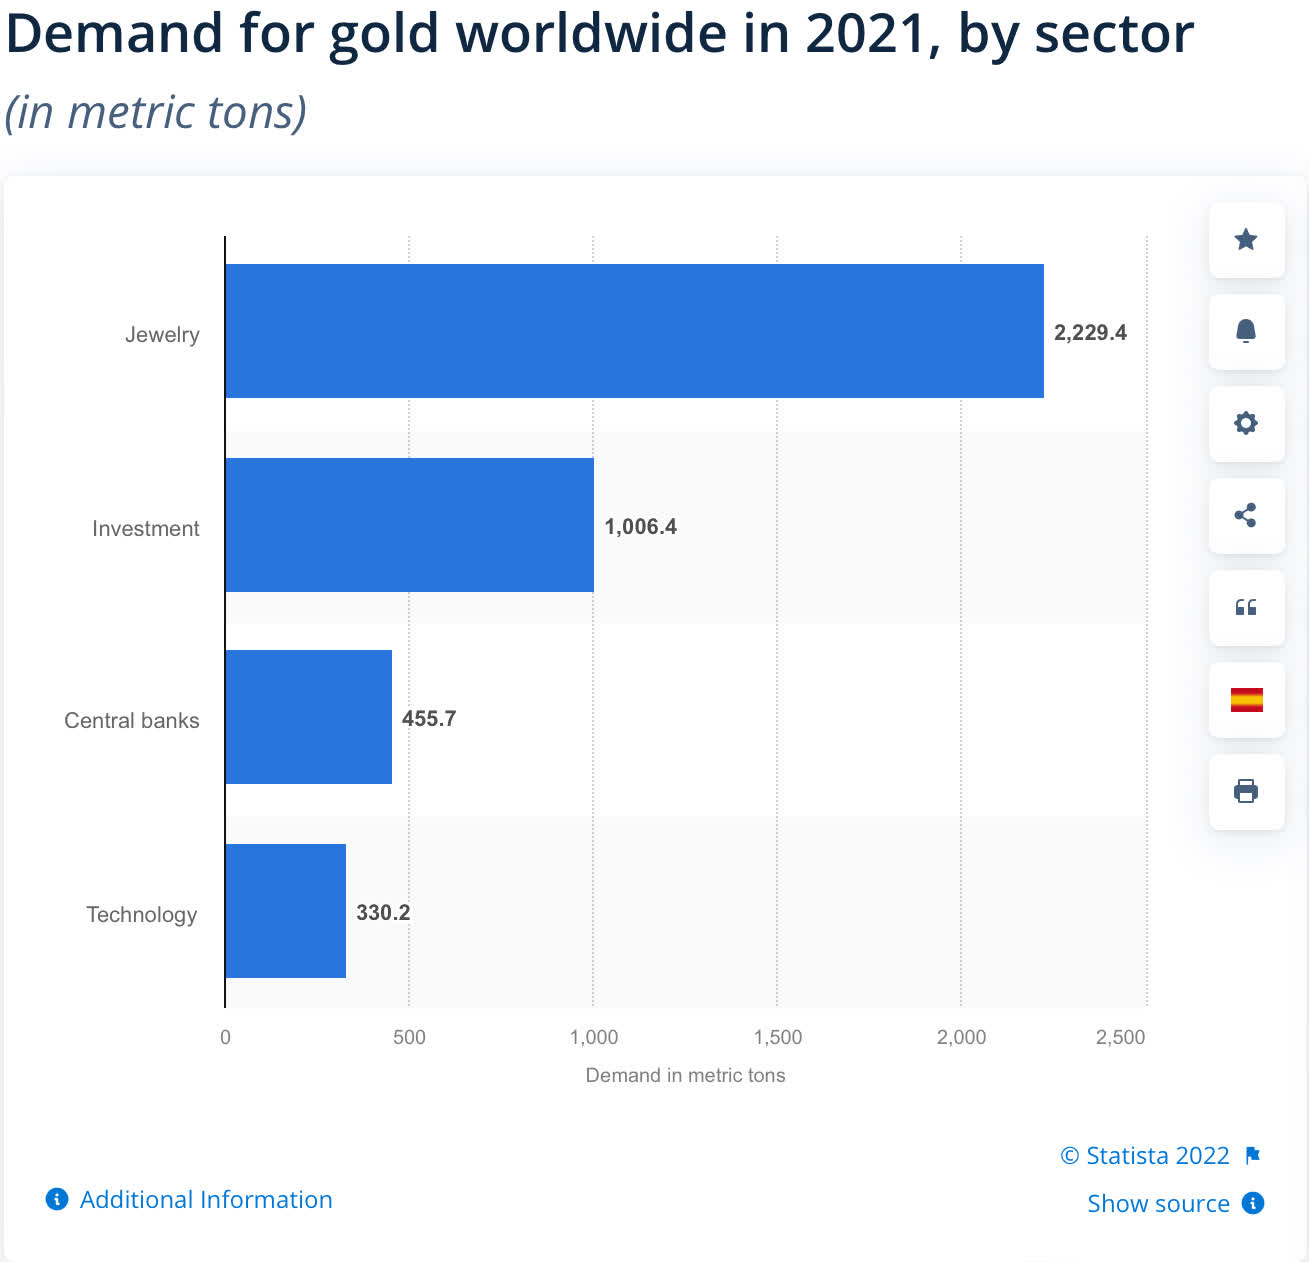
Investor Sentiment
As shown in the Bank of America survey, the highest percentage of investors consider gold to be undervalued since the Global Financial Crisis. If prices begin to rise, this will act as a tailwind.
Bank of America Fund Manager Survey (BofA Global Research)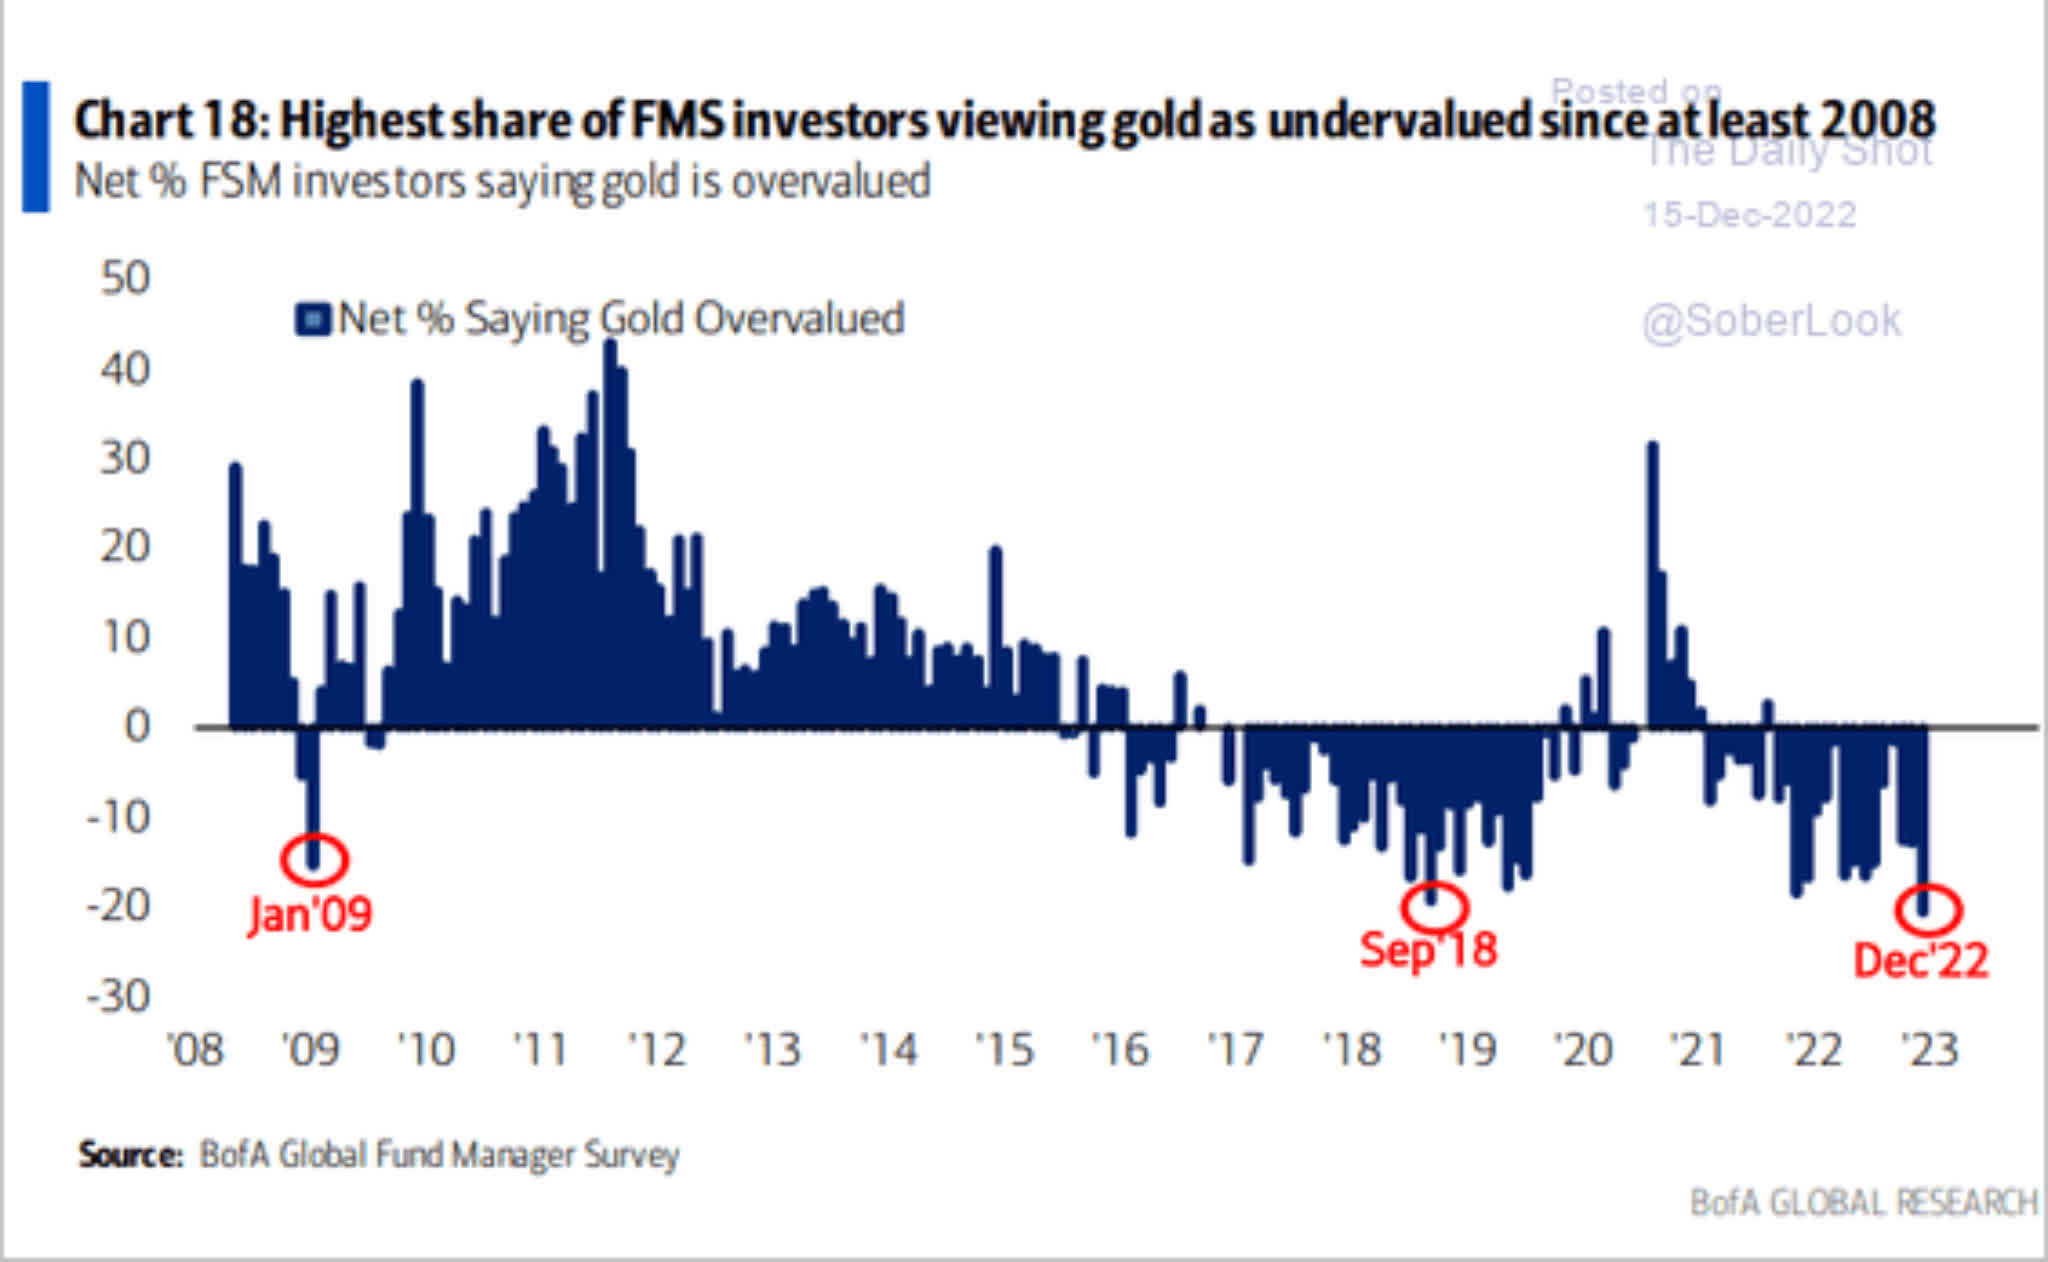
Dollars’ relationship to Gold
The U.S. Dollar Index (DXY) is presumed to have an inverse relationship to gold. However, that is not necessarily the case. The chart below has gold and the U.S. Dollar Index on the top portion of the chart, and the lower portion is DXY divided by gold. The chart with the ratio of DXY to gold is meant to capture the strength of the relationship. When the ratio shows a high number, then the inverse relationship is strong and closer to zero percent, and both DXY and gold are moving in the same direction.
Gold DXY 2000-2012 (Author )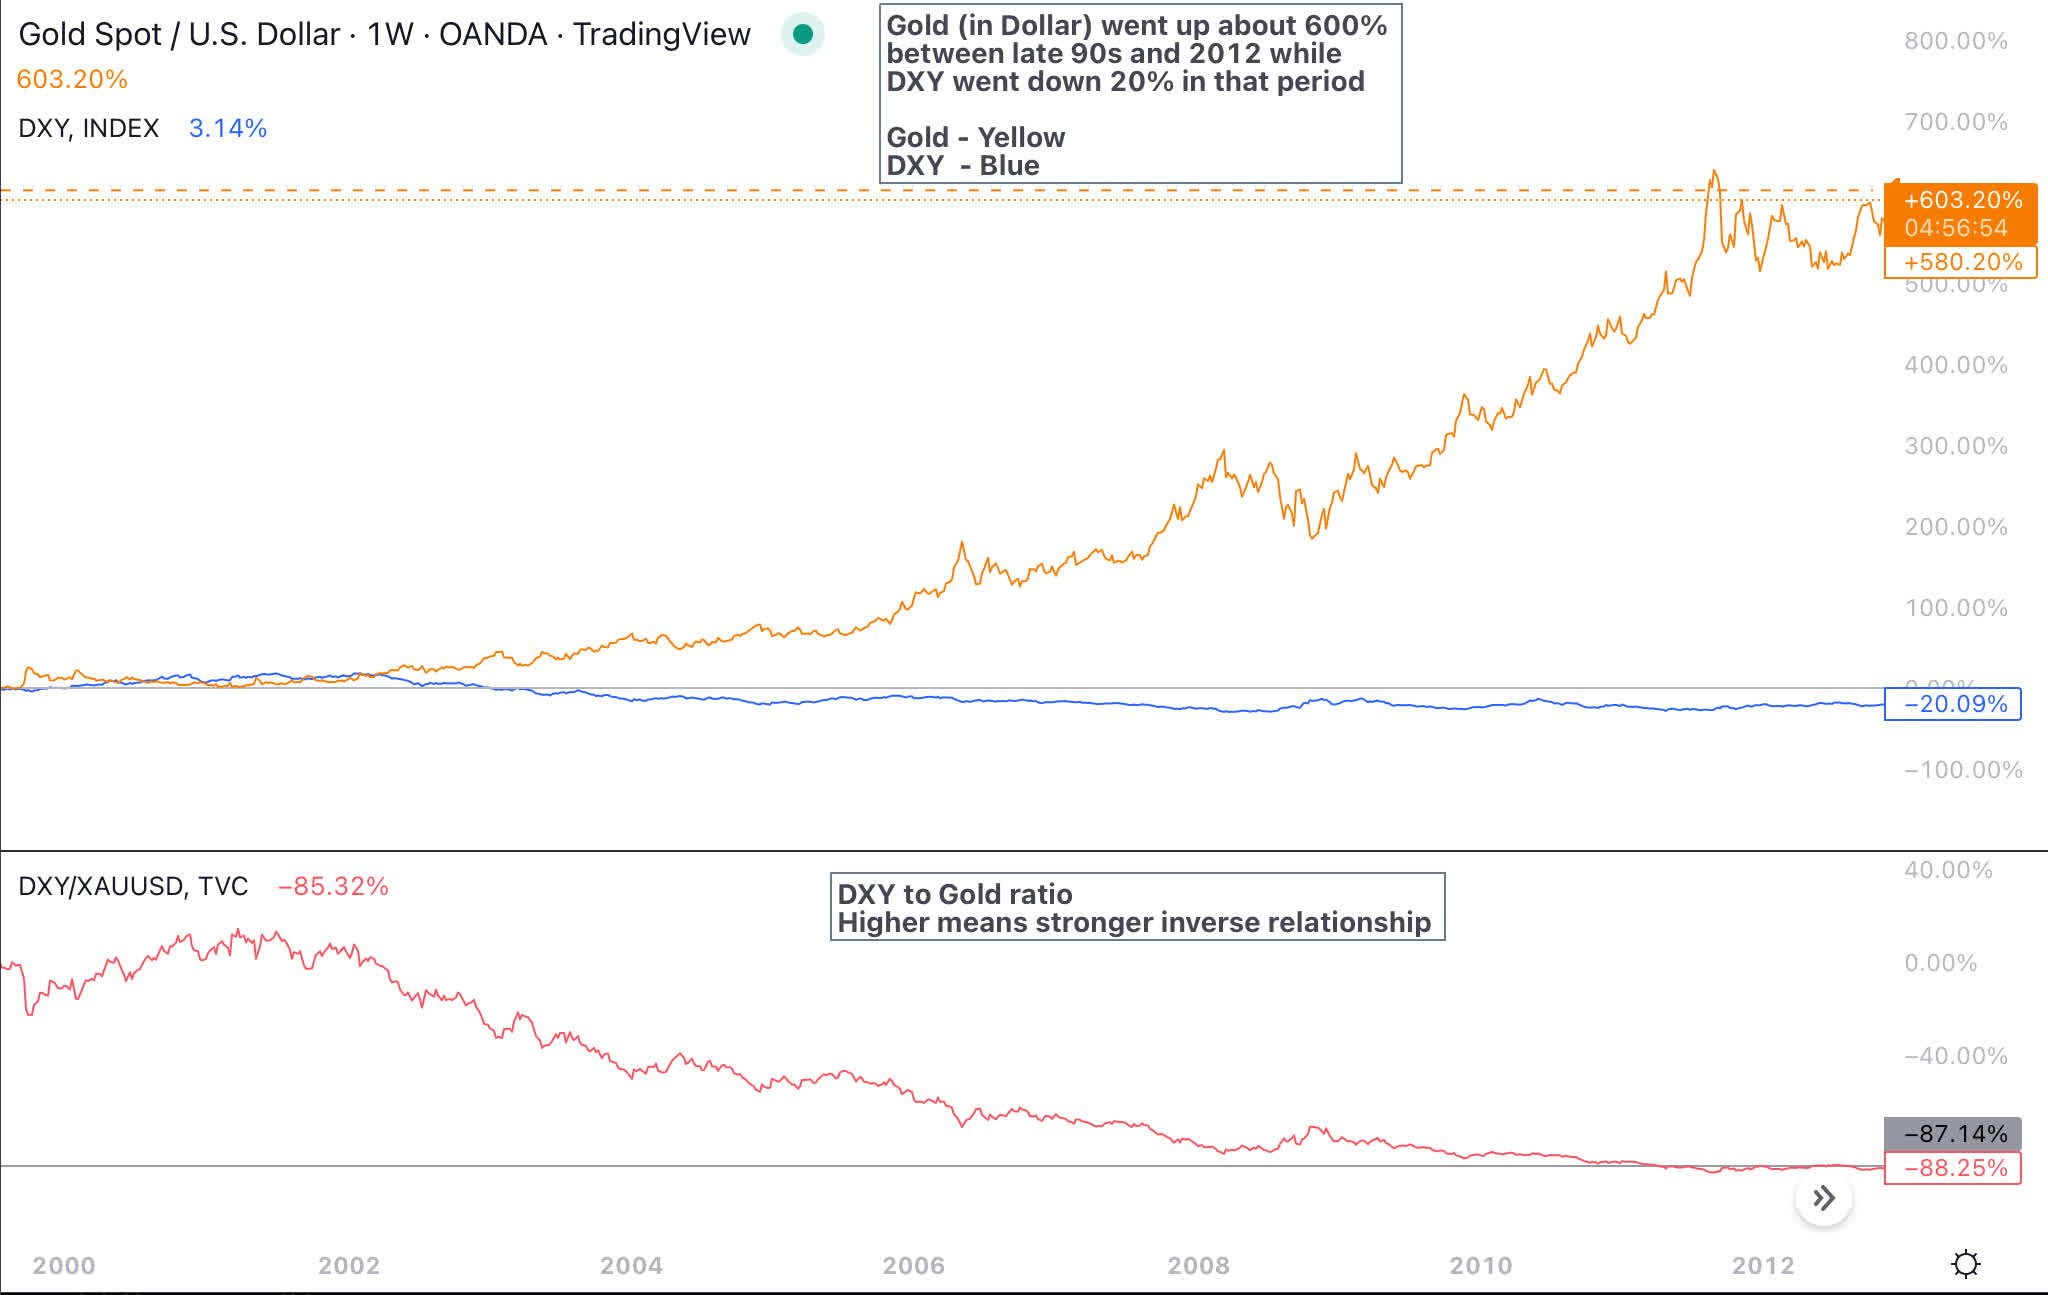
The chart below shows the strength of the inverse relationship between DXY and gold from 2012 to 2022. Also included in the chart is the ratio of DXY to gold in the lower portion of the chart. If DXY were to remain range-bound or weaken, then gold could get a tailwind.
DXY Gold Correlation (Author )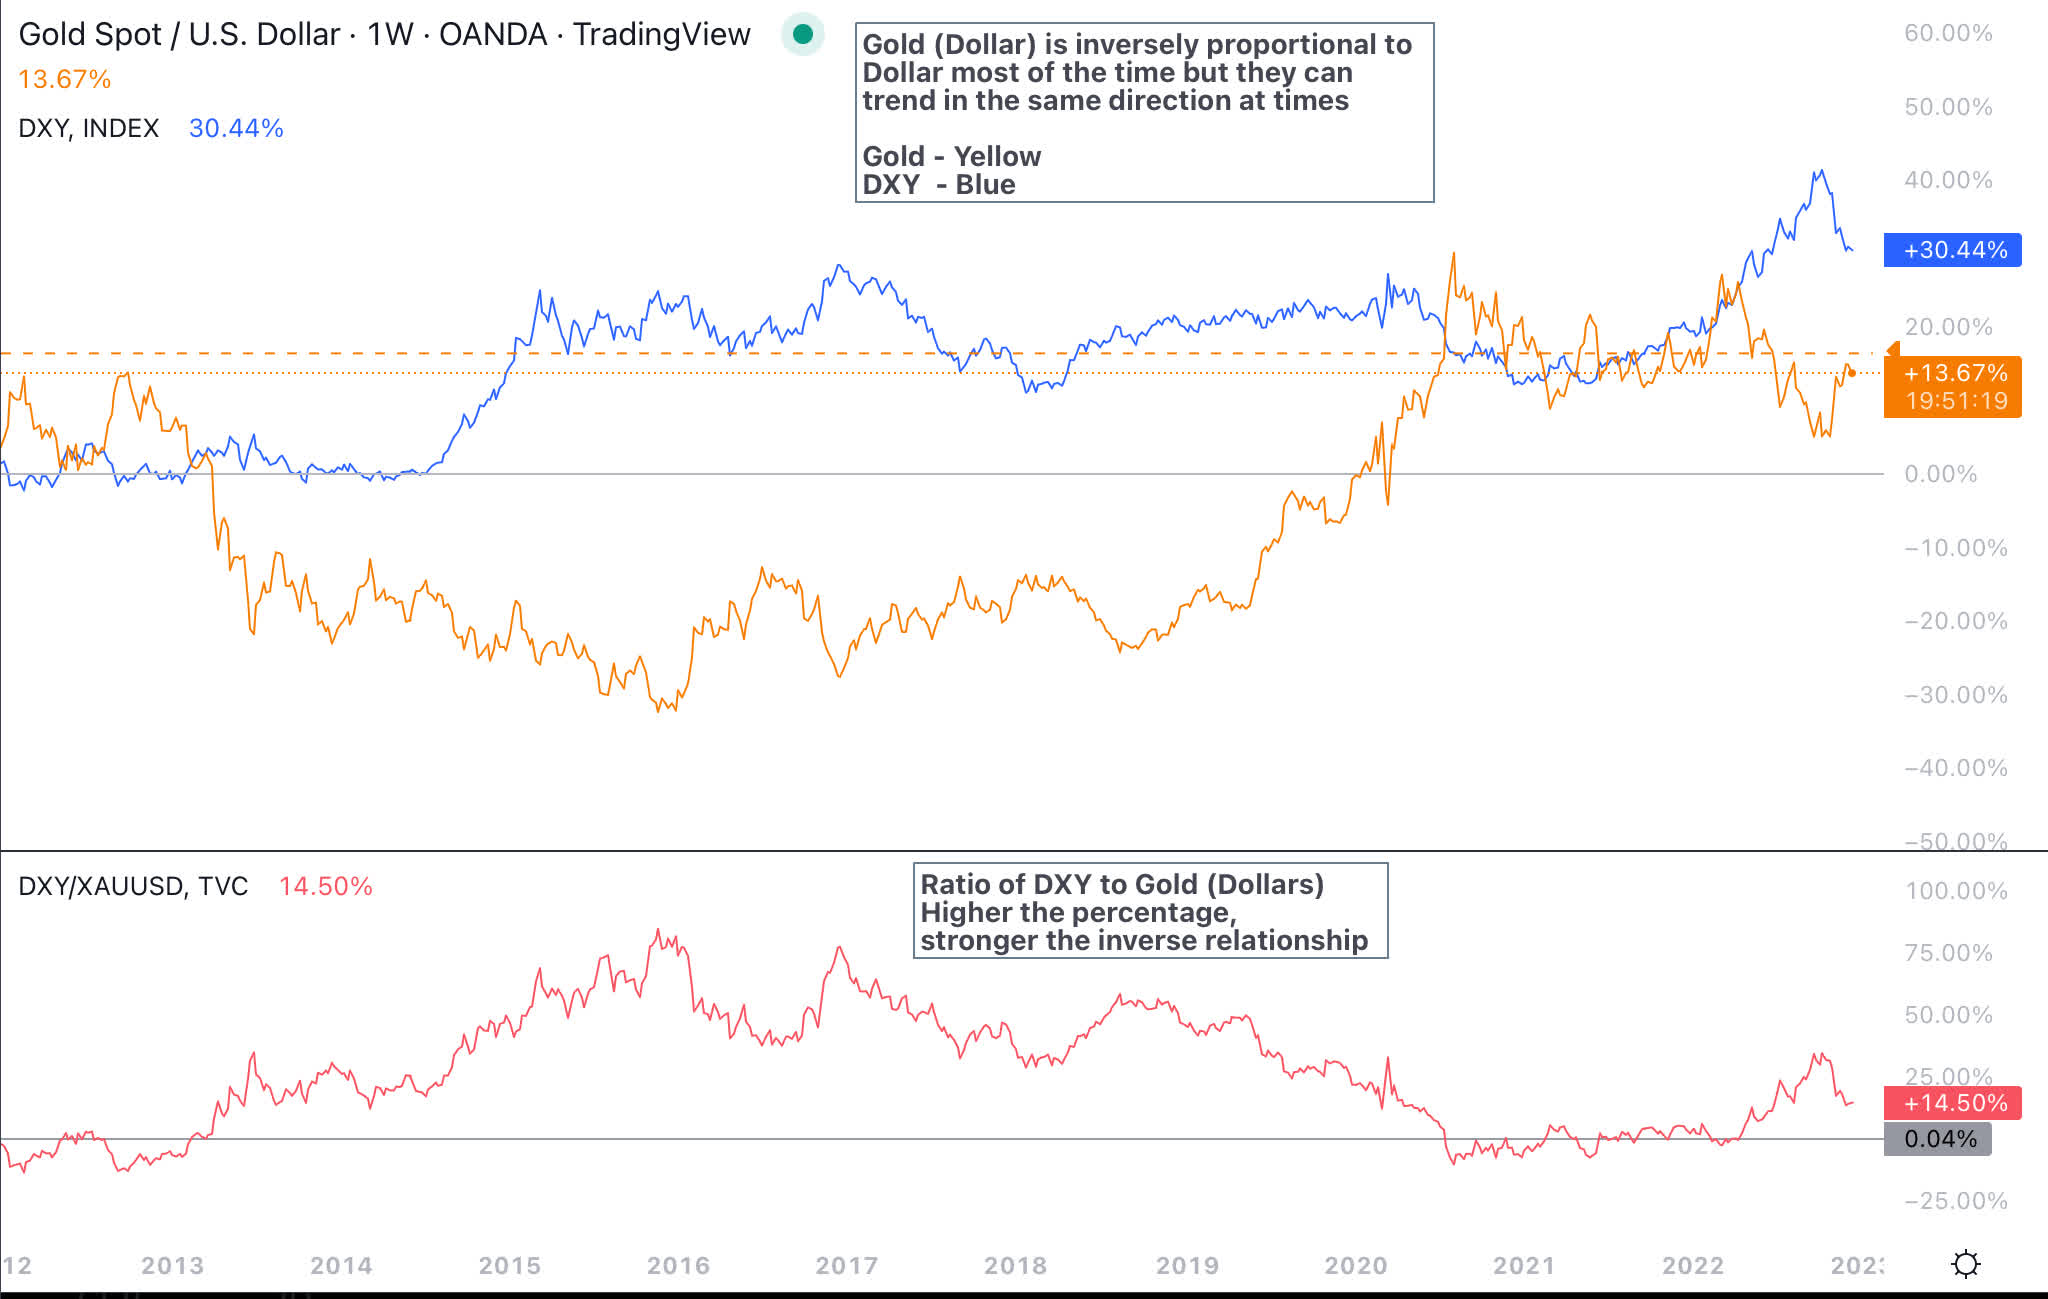
Gold in different currencies
If there is going to be an uptrend in 2023, gold priced in U.S. dollars needs to breakout above $1,920 per ounce. The price of gold on the monthly chart has been going sideways despite a money supply increase in 2020 and 2021, inflation in 2021 and 2022, and geopolitical events like the war in Ukraine.
Gold Chart in US Dollar (Author )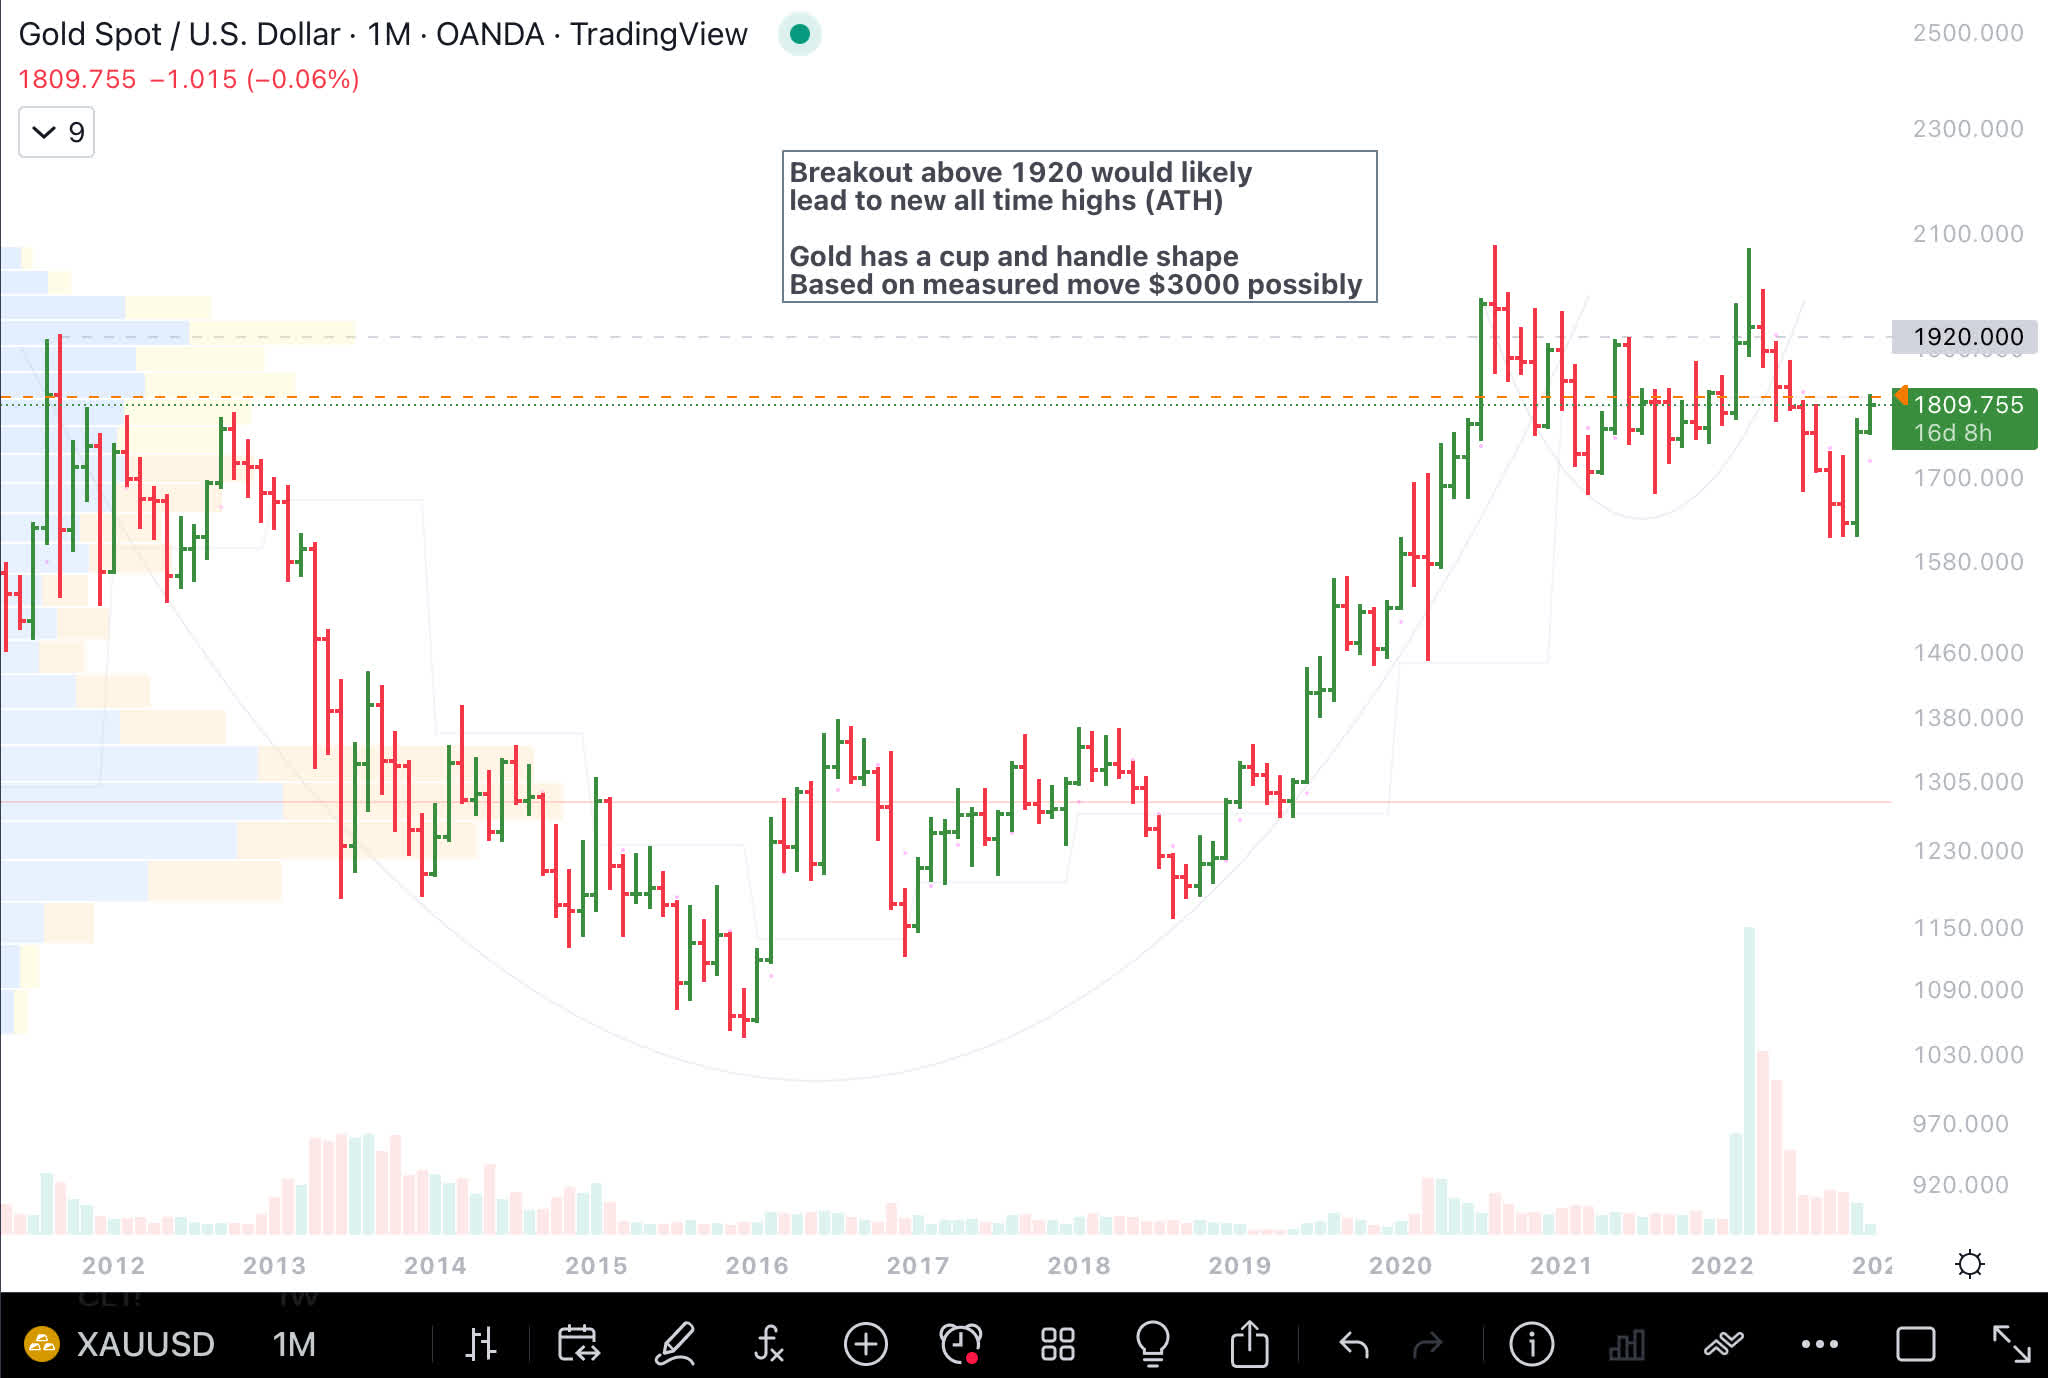
Gold’s value in Yen has risen from 141,000 per ounce in 2019 to 250,000 per ounce in 2022. Based on volume, it looks like there was consistent buying of the precious metal. A breakout over 250,000 per ounce would continue the uptrend since 2019.
Gold in Yen (Author )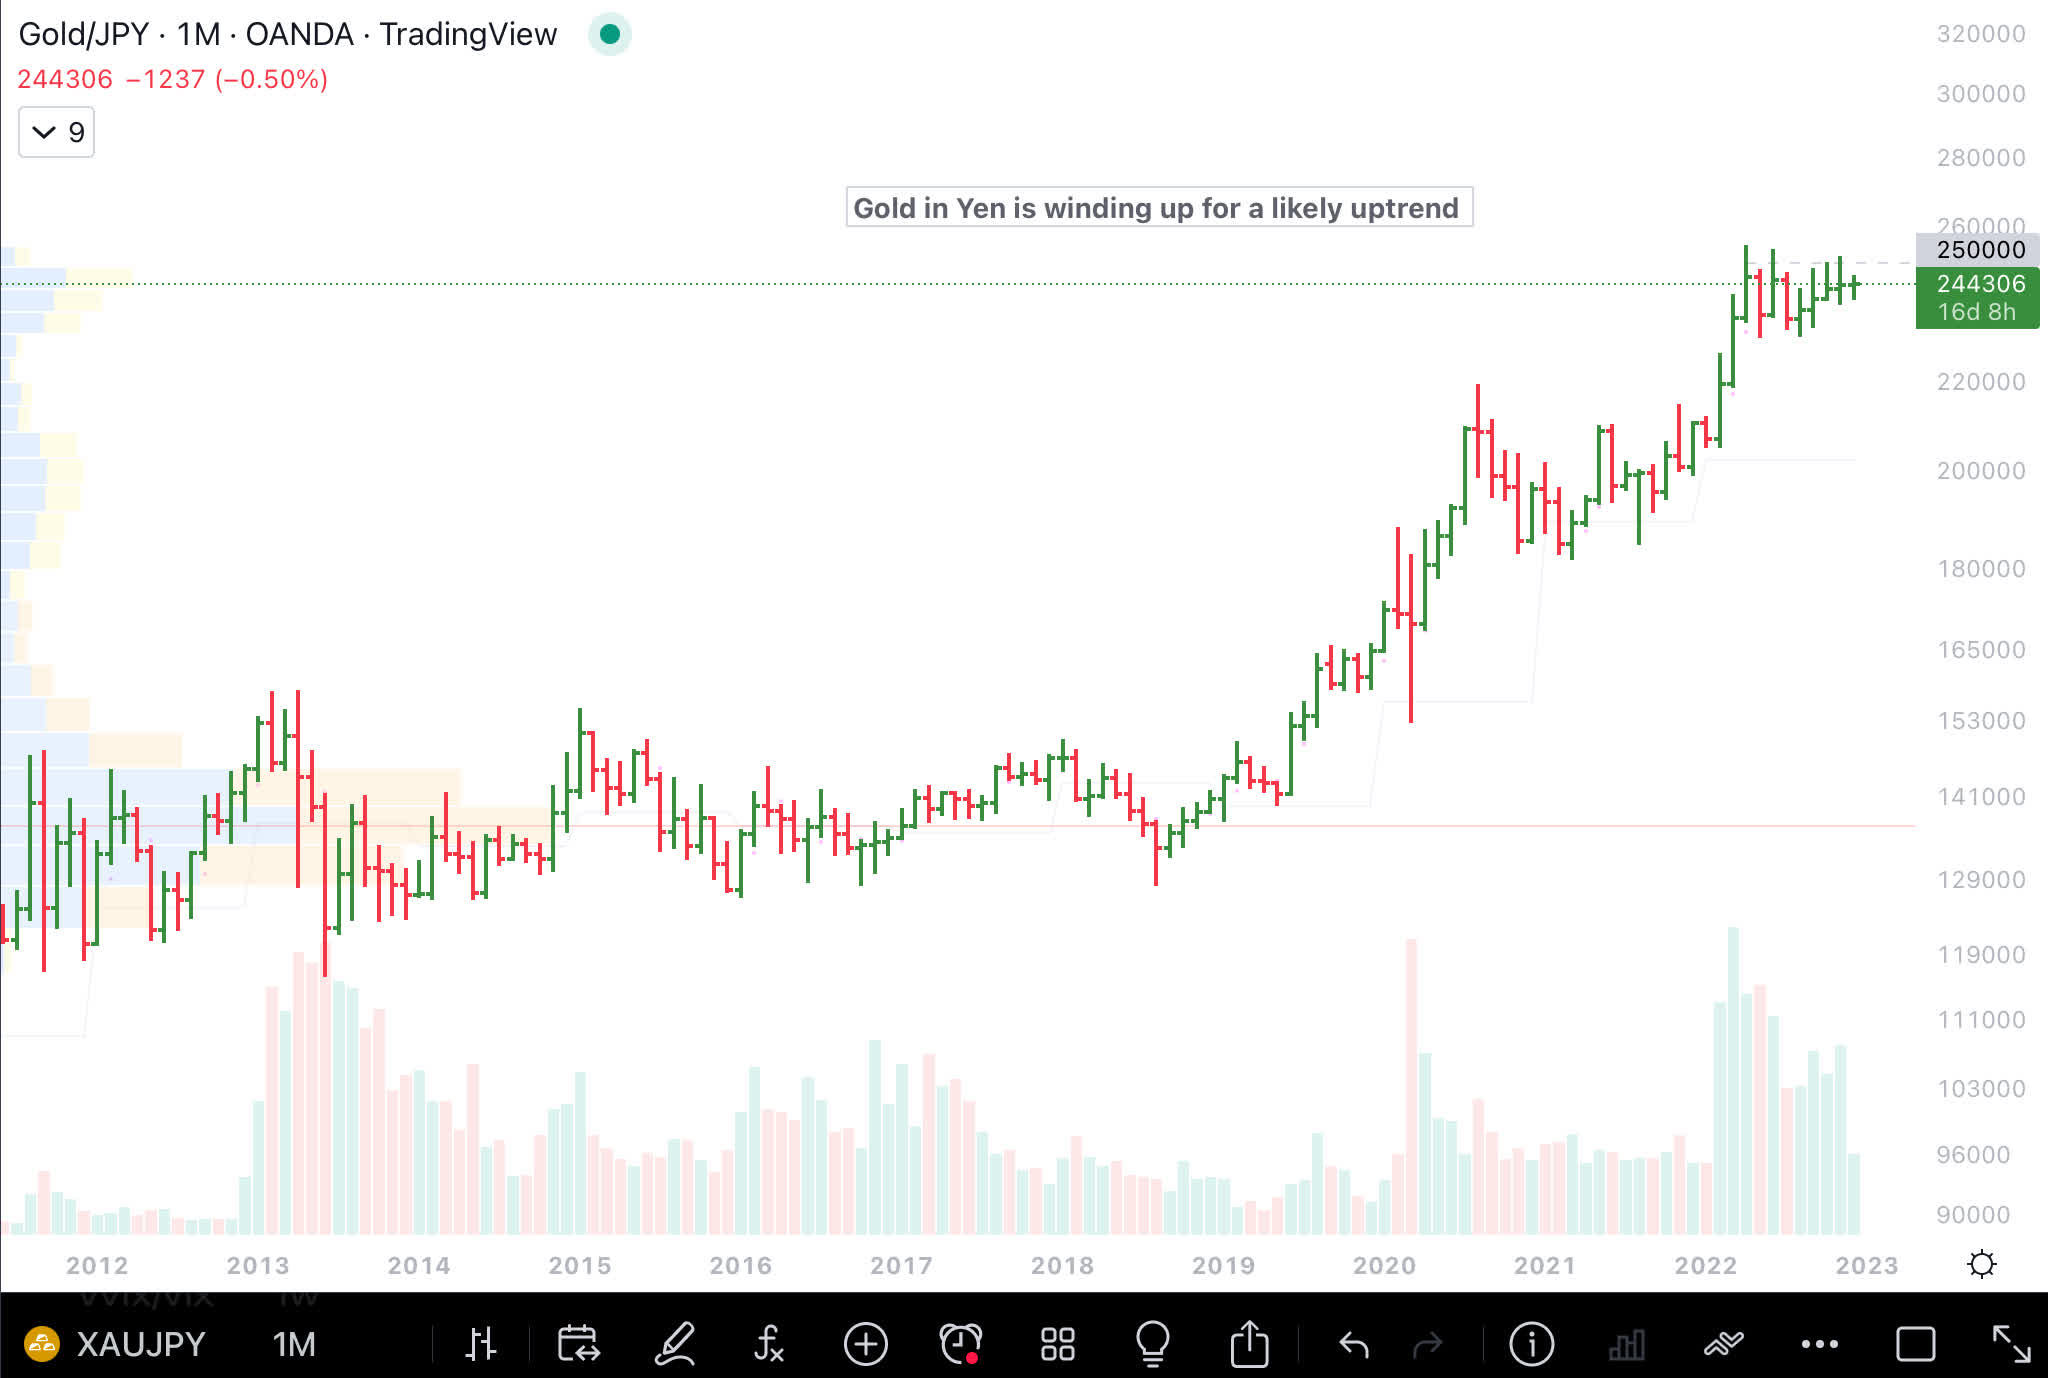
Gold in Turkish Lira
An example of why gold is considered valuable, is when we look at the price of gold in Turkish Lira. In less than 10 years, gold is up 10 times when priced in Turkish Lira.
Gold in Turkish Lira (Author )
Gold and US 10 year
The chart below has gold (in U.S. dollars) and the 10-year interest rate on an inverted scale. The chart is meant to capture the relationship between lower 10-year interest rates and higher gold prices. Depending on where 10-year interest rates go, this is likely to influence gold prices.
Gold &10 year charts (Author )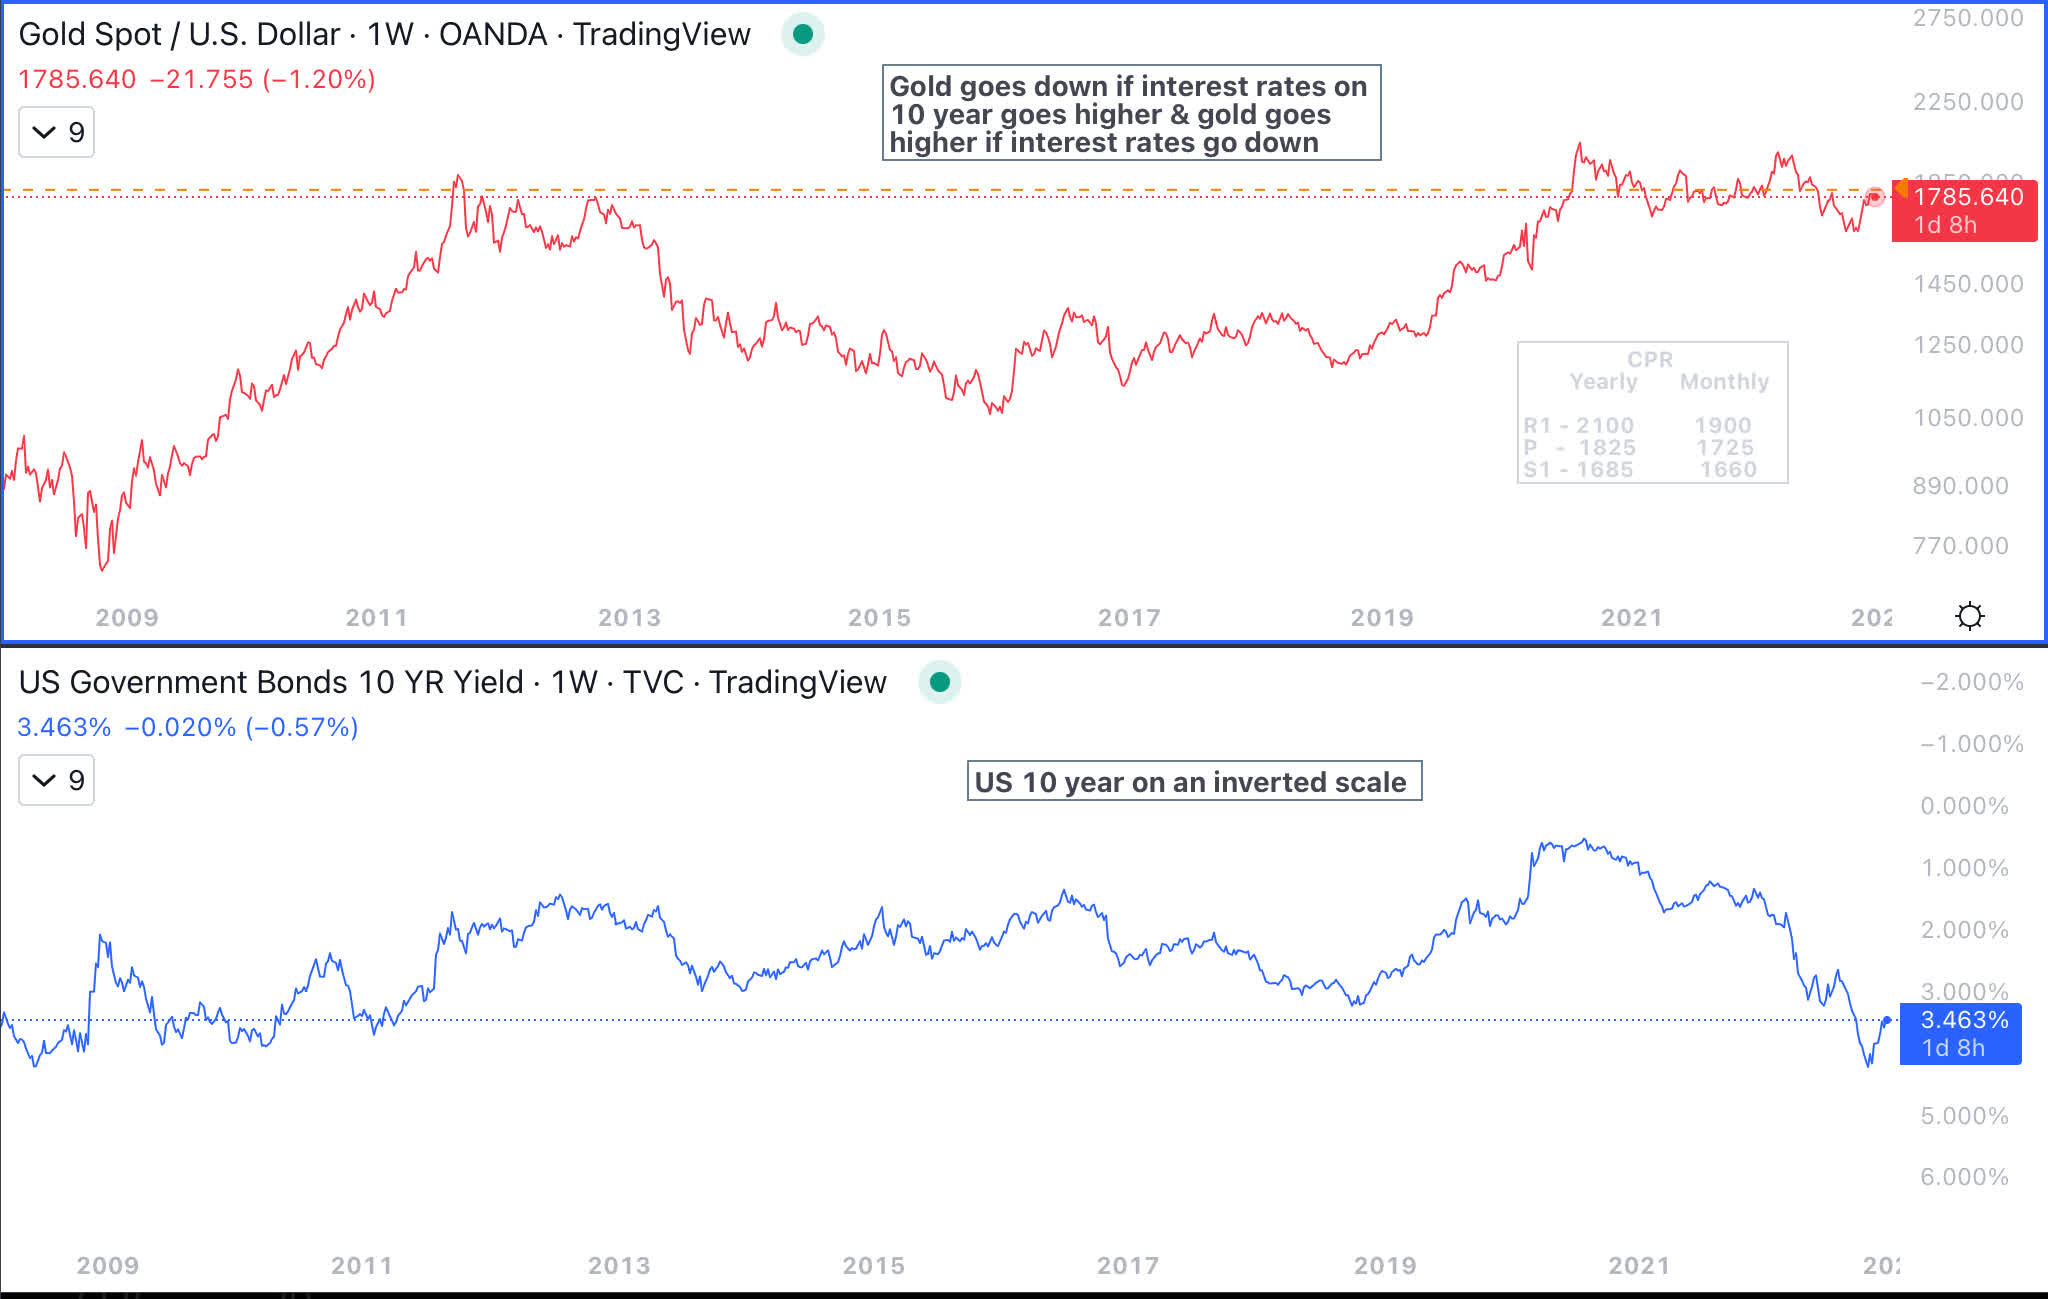
NUGT ETF Information
“The Direxion Daily Gold Miners Index Bull (NYSEARCA:NUGT) seeks to perform 200% of the daily investment results of the NYSE Arca Gold Miners Index. The fund tracks a commodity related equity index, consisting of a basket of gold mining stocks. NUGT does not invest in physical gold and is not going to track the price performance of gold” – source: Direxion website.
Holdings and Country Weighting:
NUGT Holdings (Direxion)
NUGT is rated strong sell and graded by Seeking Alpha poorly.
Ratings Summary and ETF Grade (Seeking Alpha )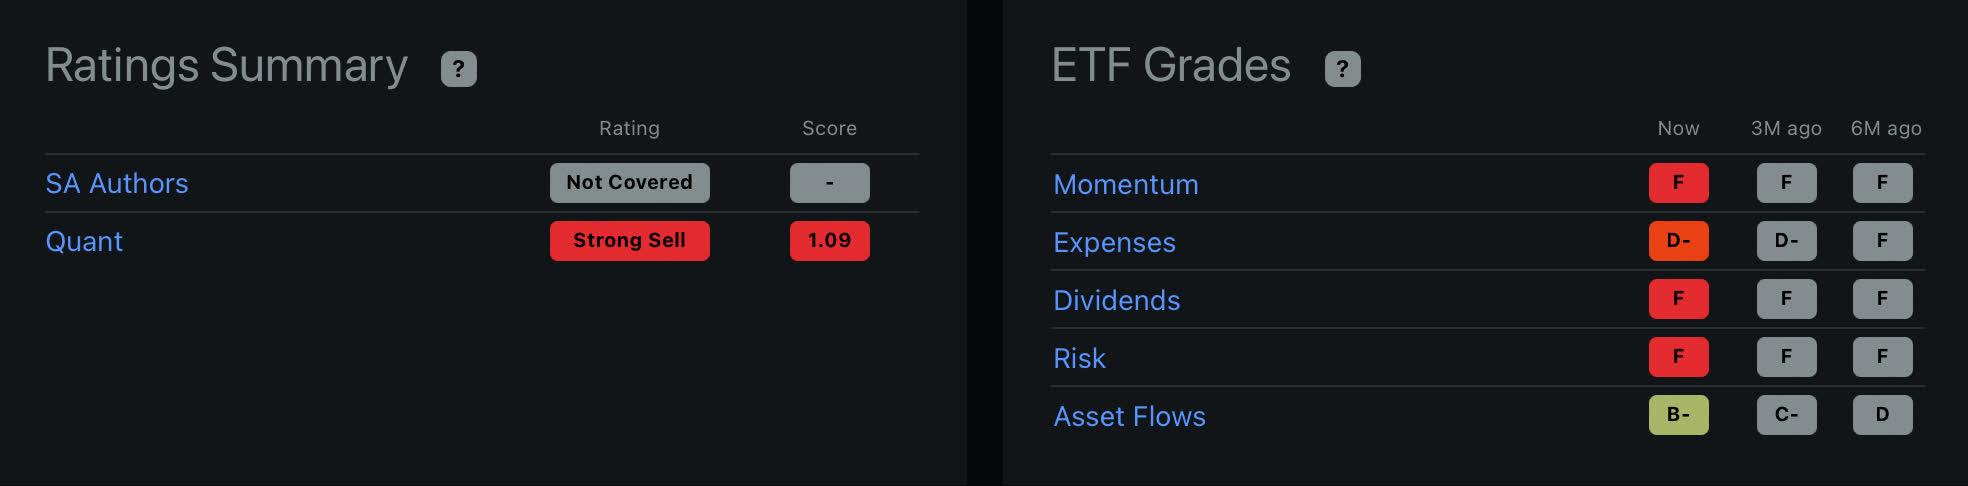
NUGT charges 0.86% fee annually, which is expensive but expected for a leveraged ETF.
Fund details and Returns (Seeking Alpha )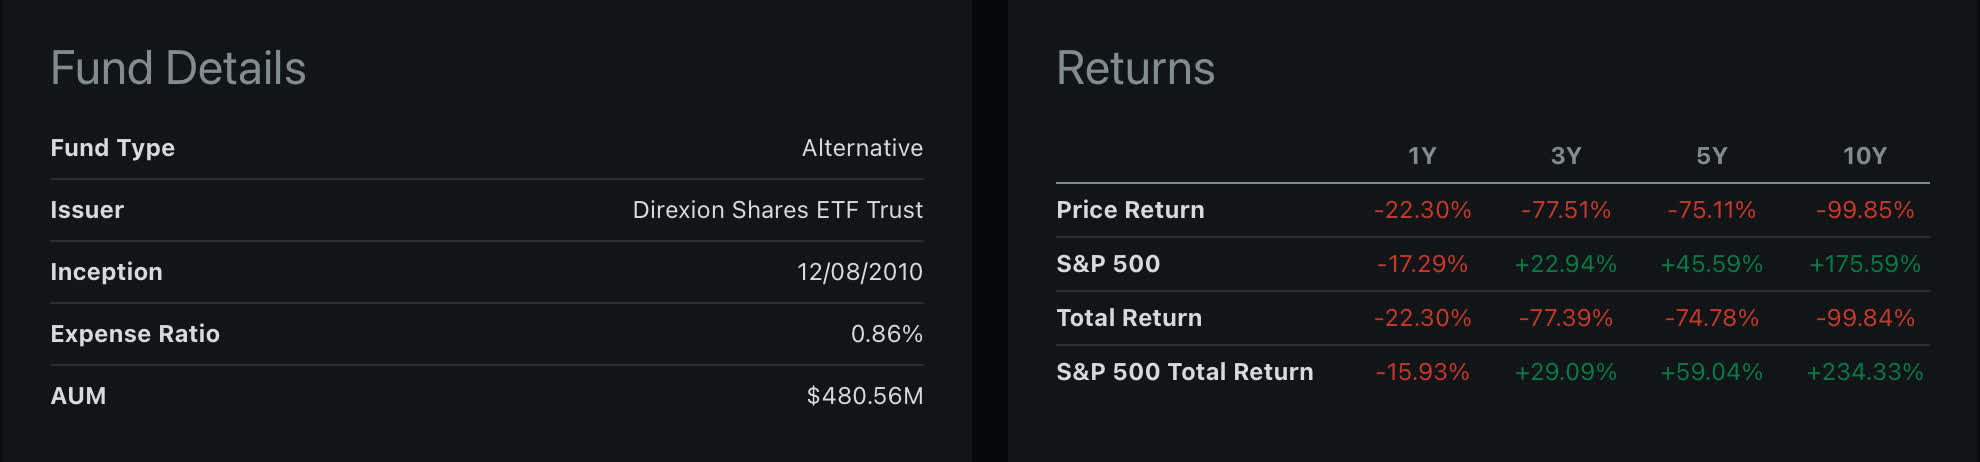
Seeking Alpha based Quant Ranking is close to the bottom.
Quant Ranking (Seeking Alpha )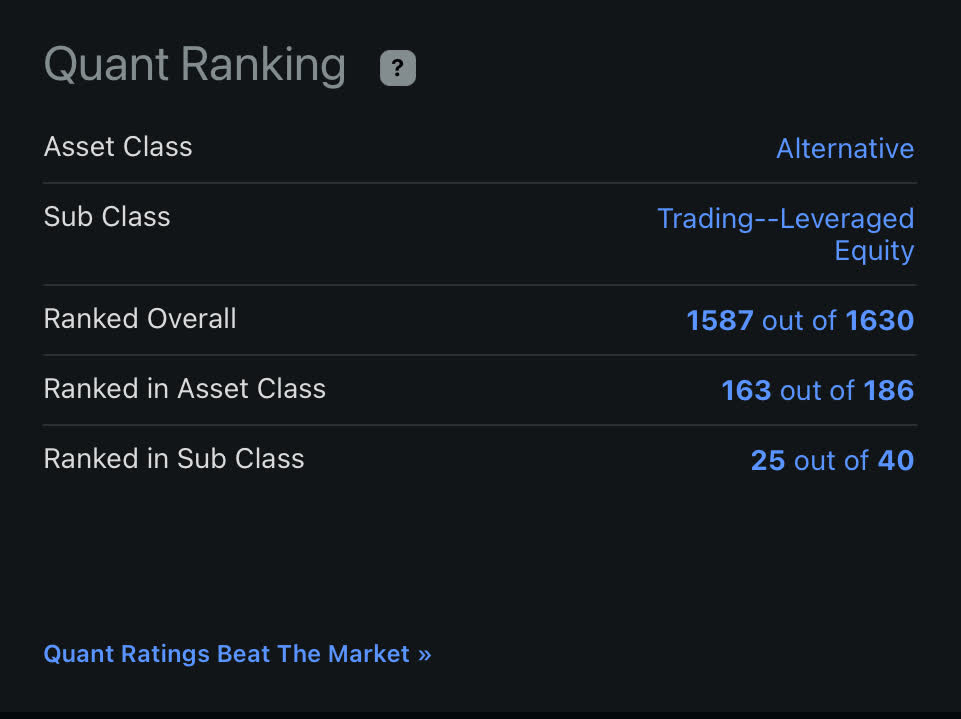
Chart of NUGT
Over the past decade, NUGT is down from 24,000 to 24. One has to be very careful, as these leveraged ETFs with their reverse splits literally become worthless if the underlying ETF has been going down. Leveraged ETFs are designed and intended to be for a short duration as they are subject to decay.
NUGT Chart (Author )
NUGT and Gold Comparison
NUGT is two times leveraged gold mining ETF. While gold prices have gone sideways for over two years, NUGT has gone down over 50%. This is due to decay and performance of the underlying gold mining index. If the underlying gold mining stocks are volatile due to the market conditions experienced in 2022 then the decay factor and negative performance compounds to the downside as shown in the chart below.
NUGT and Gold Comparison (Author )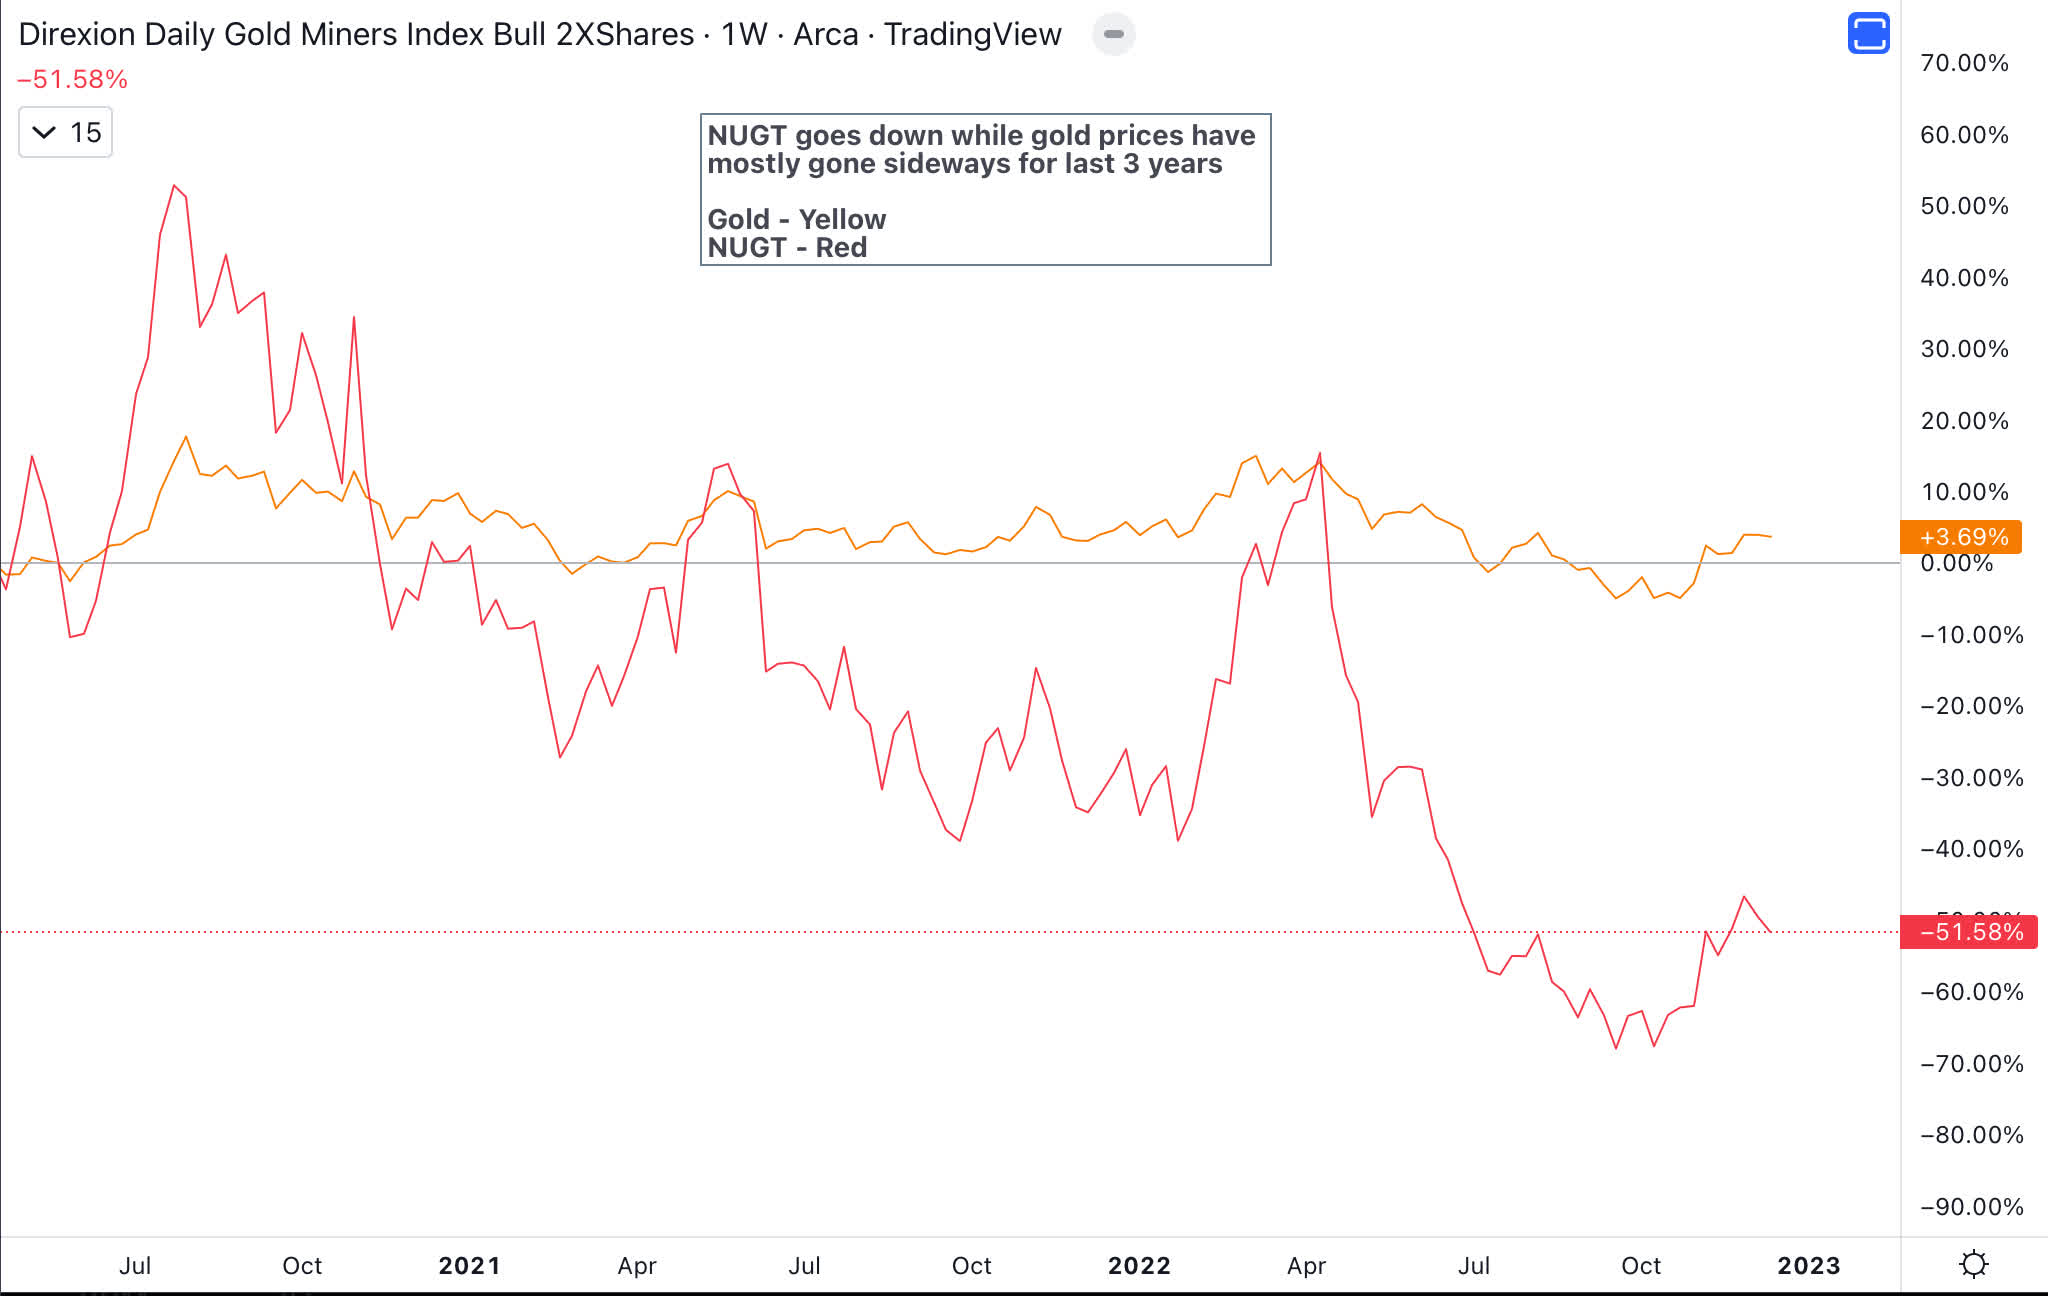
FINRA’s warning is as follows: ” Exchange-traded funds (‘ETFs’) that offer leverage or that are designed to perform inversely to the index or benchmark they track—or both—are growing in number and popularity. While such products may be useful in some sophisticated trading strategies, they are highly complex financial instruments that are typically designed to achieve their stated objectives on a daily basis. Due to the effects of compounding, their performance over longer periods of time can differ significantly from their stated daily objective. Therefore, inverse and leveraged ETFs that are reset daily typically are unsuitable for retail investors who plan to hold them for longer than one trading session, particularly in volatile markets.”
Summary
NUGT is a two-times leveraged gold mining ETF now, though it used to be a three-times leveraged ETF. There are some supportive factors, like the purchase of gold by central banks, positive sentiment, and possibly U.S. dollar weakness. Gold production is higher than gold consumption, which might keep a lid on gold prices. Gold didn’t rally despite favorable factors like inflation and war in 2021 and 2022. So I’m not confident that gold will shine in 2023. Even if gold prices go up, the question still remains if NUGT is the best way to capture higher gold prices due to the decay in a leveraged ETF. NUGT is not an investment choice I would recommend. Let me know your thoughts and the best way you invest in gold.
Be the first to comment