

NicoElNino/iStock via Getty Images
Asana, Inc. (NYSE:ASAN) is a work project management platform that’s been booming since the pandemic.
Organizing projects has become more complicated now that people are working from home. They’re all over the place. Asana makes it easier to keep track of things.
This company was on a nice run higher. Then it went through a crash.
So today, we’re going to step back, take a look at the sentiment, the fundamentals through the key stats for the company, its competitors, and of course, the price chart. All this to figure out whether or not this stock’s going to be on my Bank It list over the next couple of months (expecting it to run higher), or my Tank It list (expecting it to continue falling lower).
The first thing that we’re going to be taking a look at is the key stats.
Key Stats for ASAN
You can see that ASAN’s revenues have steadily climbed, which is something we love to see in “Bank It or Tank It” analysis…
S&P Capital IQ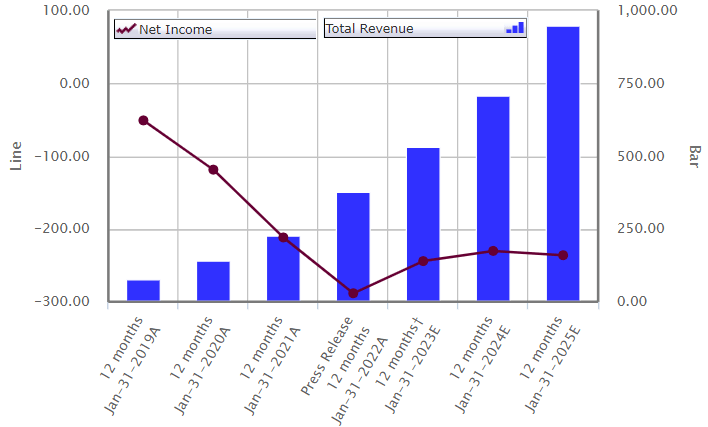
In 2019, revenues started to steadily climb up to 2020. Then, a nice jump in 2021. And then, we have actual results for 2022 as of January 31. Another big jump.
The expectations are for growth to remain steady in 2023, 2024, and 2025. But what’s interesting is the call for a reversal on net profits.
We see that net income has been going lower. You can see Asana running in the negatives, and that’s not changing anytime soon. But it’s expecting these declines to slow down, which is great to see. And the revenues are supporting that.
Revenues are a key aspect to watch. Everybody wants to see a company get back to profitability, but it can always cut costs and start to improve profits down the road.
What’s great to see is Asana’s growth and the fact that it’s still expecting that to continue, even after the pandemic. This is everything we want to see in this stock. You have to love seeing the steady revenue growth for Asana.
A Quick Look at the Competition
Let’s switch over to some quick comps, basically comparing Asana to some of its peers in the industry…
S&P Capital IQ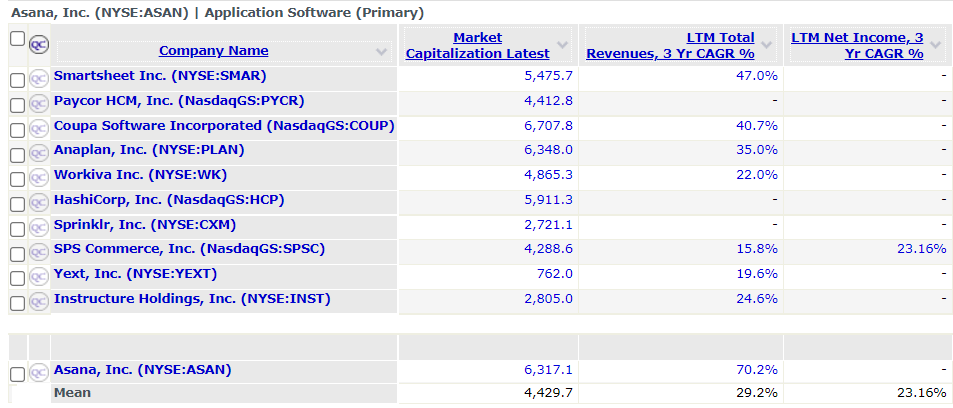
We look at market cap, and you see that Asana is relatively even with the rest of the companies on average – $6 billion market cap. About $4.5 billion is the average. So, it’s right there in the ballpark. It’s not a massive company, but that means that these are pretty good comparison companies as far as size.
When we look at the compound annual growth rate (CAGR) over the last three years, it’s 70% for Asana. Solid growth rate. That’s compounding at 70% per year over the last three years. And that’s phenomenal to see, compared to these other companies.
It’s definitely in a stronger growing phase. The average per year is 29%. Solid, too, but at 70%, Asana is more than doubling that. So, it’s definitely a company on a run for growing its revenues.
When you look at the chart, the company was losing money every year. Not even turning around net income yet. It’s been getting worse and worse. But seeing revenues grow so much, that’s why the expectations are higher going forward. We’re going to start to see that turn around. Revenues lead this stock and have been the key theme over these first couple of takes we’re looking at.
Analyst Sentiment
Now, next thing to look at is sentiment…
S&P Capital IQ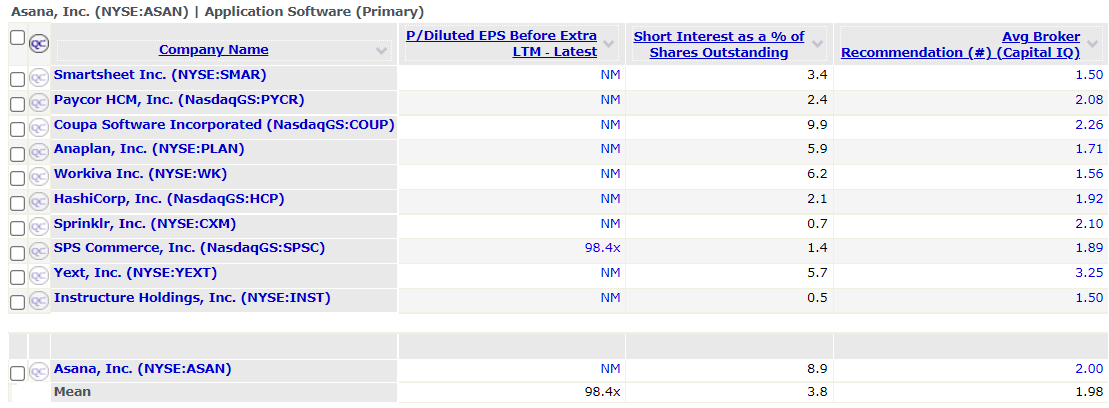
Price-to-earnings still isn’t relevant, because the earnings are negative. It’s the same for most of Asana’s peers. The one that does have earnings is 98 times earnings, which is probably not accurate. It’s probably based on the fluctuation in earnings at this time.
Short interest gives you an idea of how bearish the market is on the stock, though. Higher short interest is usually a bad sign, because it means people are making more bets for the stock to go down.
You don’t typically see short squeezes happen too often. A sentiment reading where there’s higher short interest means that investors are bearish. Lower short interest means that they’re pretty bullish on a stock, or at least afraid to short it. At 8.9%, it’s higher than the average. Out of these other companies, investors are still willing to short Asana compared to some of its competitors.
Coupa Software (COUP), at 9.9%, is the only one that’s above where Asana is. That gives perspective on the stock from the investment world. They seem a little bearish.
The next section is the average broker recommendation. The company has a 2 on a scale from 1 to 5. A 1 is a strong “Buy,” and a 5 is a strong “Sell.” So, Asana is an Outperform rating right now. Pretty solid. The analysts are not rating it that badly, but we see investors taking shots to the downside.
One of the last things – and the most important to me – that we want to look at is the price chart.
ASAN Price Chart
Asana went public back in 2020. It was trying to capitalize on what we saw from the pandemic.
Investors were hot on the stock then. We had some pullback, but it started to bounce, and then ripped higher…
Optuma.com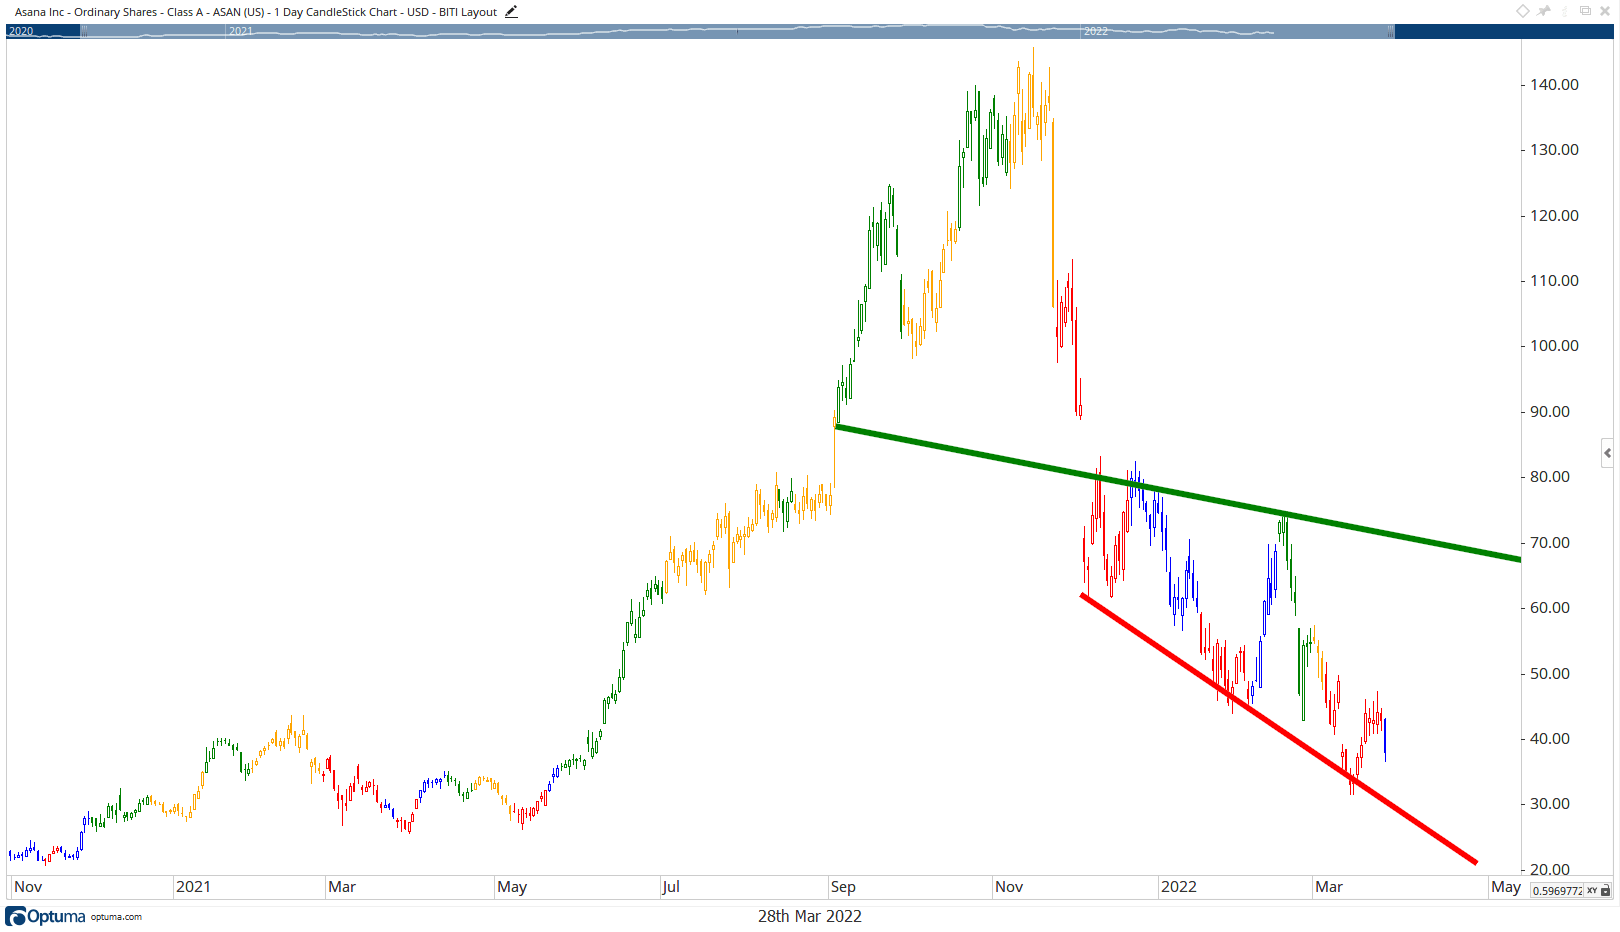
This is a massive run for the stock here in 2021, more than tripling in value. Then a pullback through a massive crash.
This is a 75% drop in just a matter of months.
This is a bear market for the stock, and this is the time when investors are fearful. It’s time to get greedy. This is blood in the streets.
This is a great company that offers a product that businesses need and want. Now, can it do that at a cost-effective method? Can it continue to grow itself and find a way to make profits over time? That’s all up in the air.
But at the end of the day, this is a quality company doing really solid things on the top end for its financials, seeing its revenues grow. Yet, investors have been crushing the stock.
You’ll notice each candlestick on the chart is shaded either red, blue, yellow or green. This is a Relative Rotation Graph, or the “Profit Radar,” as I like to call it…
Optuma.com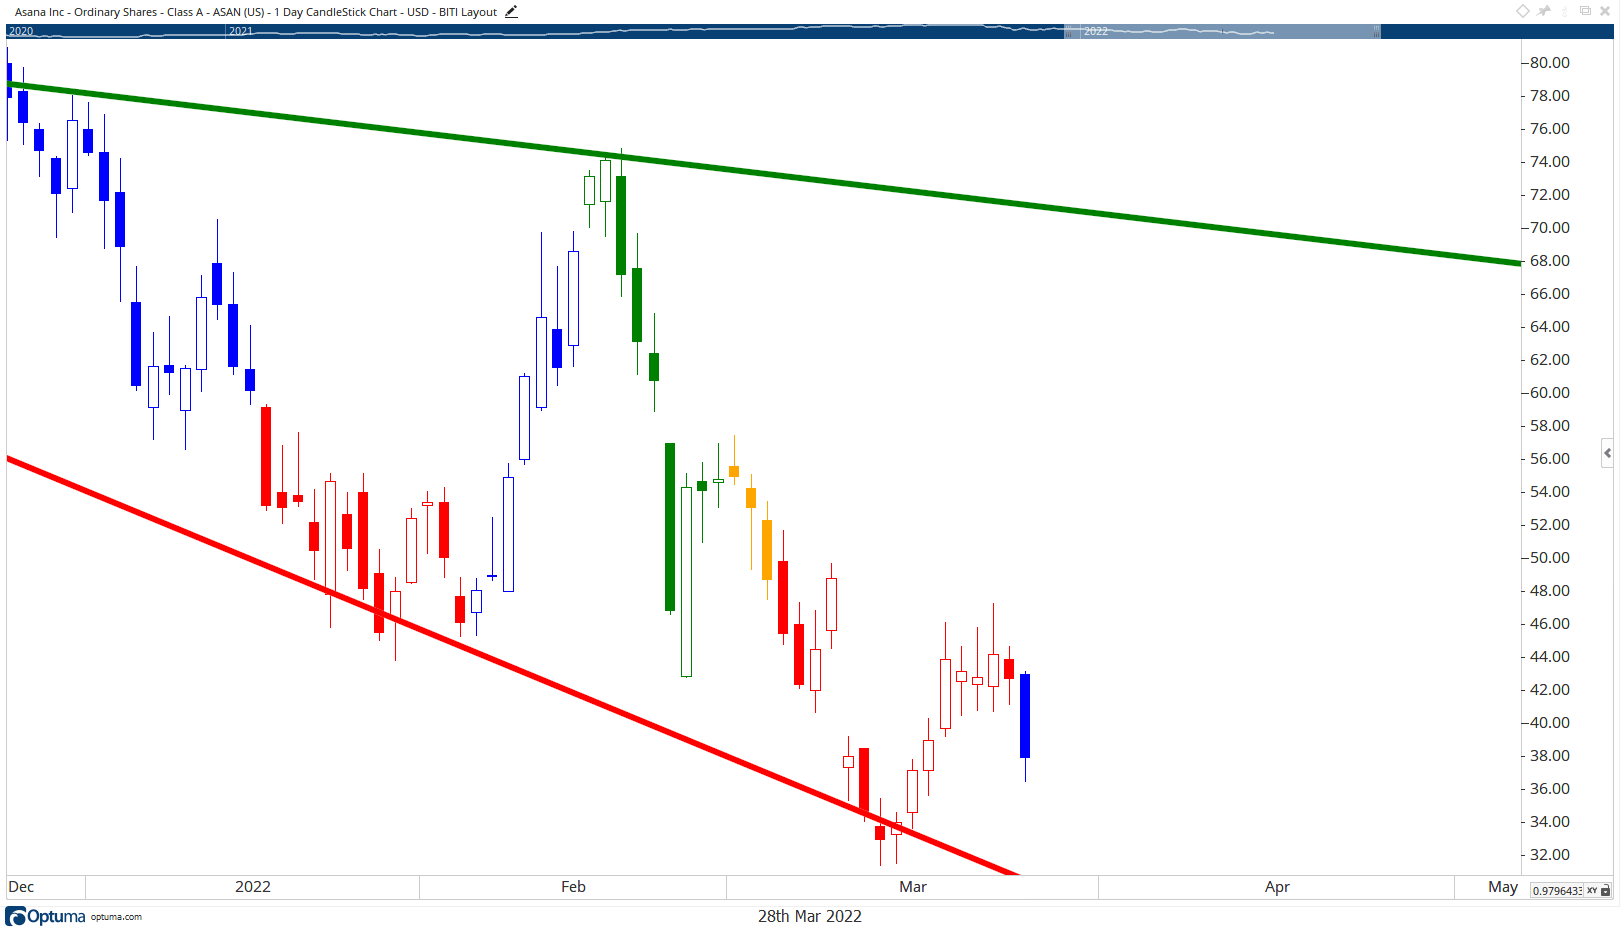
Right now, it’s blue on the chart. That means that it’s improving against the market. A stock is improving as it comes out of the lagging (red) quadrant based on my Profit Radar.
So, a lot of people were bearish on the stock. But it typically means expect a bounce, at least a quick rally higher.
When we’re talking about opportunities from the stock having just entered the improving (BLUE) quadrant on my Profit Radar, we’re talking about big 20% to 50% runs over a matter of weeks.
We’ve seen it before, where it falls into the lagging quadrant, starts to improve, like we have seen, and then, we get a nice run higher.
ASAN has been prone to seeing these kinds of moves to the upside. So, in the very short term, this is a Bank It stock.
Because ASAN has this steep slope, it has short-term bullishness. The lows for the stock is around $20 a share. It’s above $30 right now.
Here’s how I would like to trade it…
We’re going to be bullish on Asana where it’s trading at today. I’m going to stay bullish, as long as it stays above $30 a share. That’s my floor for the stock, because I know if it falls below that, it can quickly lose another third of its value.
It can fall down to $20 a share in no time. And that may not be a floor for the stock, either. It could continue falling from there. So, for being bullish right now, $30 is the key level that I’m going to watch. You can jump in. As long as ASAN stays above $30, you’re going to want to ride this to the upside.
This stock has a wide pattern that it can trade in. ASAN can make a big run higher. And that creates a lot of opportunities for bullish moves. If it were to eventually break out, that would be even better.
I’m not calling for a massive breakout from here, but I’m looking for it to steadily climb from where it’s trading at today over the next couple of months.
Be the first to comment