

RichVintage/E+ via Getty Images
“The older I get, the more I realize how many kinds of smart there are. There are a lot of kinds of smart. There are a lot of kinds of stupid, too.” – Jeff Bezos
The good
Some analysts are pointing to the true bright spot. Personal consumption, while slowing, still provided a boost of +1.4% due to strength in services spending (+2.8%). Given this set of circumstances, the economy will need to see the consumer remain a positive catalyst, and that may be a challenge in the days ahead. On the plus side, some consumers still have a cushion with healthy excess cash savings. Second, forward guidance from many service industry leaders such as airlines (i.e., United), hotels (i.e., Hilton), and rental car agencies (i.e., Hertz) suggest that demand is not fading as we approach the holiday season. However, it appears that an argument can be made that many consumers have already resorted to the old standby to keep their spending habits going.
The bad
The Fed: Due to hotter-than-expected September inflation reports, the Fed increased interest rates by 0.75% (Fed Funds now at 3.75%- 4.00%) for the fourth consecutive time this year. However, following this meeting, the Fed made it VERY clear to anyone that WANTS to listen. They will remain resolute in their fight against inflation.
Now that the folks that haven’t been listening FULLY understand what I’ve been warning about for months (the Fed isn’t going away anytime soon) there will be six weeks between the November and December meetings which means the Fed will receive not one but two releases for both inflation and jobs. This month’s inflation report was the first sign that inflation has peaked and might be slowing with Year over year CPI now at 7.7%. This and next month’s report will give the Fed more data to work with, but unless there is a violent turnaround in inflation, we can expect the Fed to ‘close’ the year with at least a 0.50% interest hike in December.
I’ve stated all along that the FED is STUCK. If they stop raising rates and inflation doesn’t subside, then starts to increase they are DEAD. If they continue to raise rates and the slowing economy starts to really fall apart early next year, they’re DEAD. Some would call that “checkmate”, GAME OVER. It should be abundantly clear why I was very concerned about the spending that brought inflation onto the scene, and here we are.
Yield curve
The 3-month/10-year and the 2-year/10-year treasury spreads have both been inverted. Unless this time is different, a recession is inevitable (if it is not already here). Q1 and Q2 posted negative GDP readings. The Q3 GDP report shows growth coming ONLY from “exports”. This is about as close to a recession as we can get without the experts calling it one.
Furthermore, the overall U.S. trade deficit reversed course in September, widening by $7.6 billion. This suggests Q3’s outsized contribution to GDP growth from trade is unlikely to carry into Q4. Unless another area of the economy can pick up the slack, Q4 is apt to be another snoozefest.
What is already ugly
Inflation expectations remain anchored. Recent signs on whether price pressures are actually easing are mixed. Futures are pricing a softening in the Fed’s hawkish stance, but my continuing message that Energy prices are still HIGH and are a factor that keeps inflation embedded has NOT changed. Wholesale gasoline futures are running at August highs, a sign retail prices may soon follow, and along with other energy costs, gas prices are critical to inflation expectations.
Ironically, the drop in home prices is coming as people are shunning homeownership, pushing them into renting, and while “rent” increases slowed recently, that new demand may keep them at high levels. That goes against the ‘consensus’ view and should keep “sticky” rents above normal levels. The stock market isn’t pricing for the scene I just presented as the crowd is still fixated on a FED “pivot”. Perhaps they are right and the market action will tell us if they are.
The Conference Board’s Leading Economic Index looks to have probably peaked earlier this year, and it’s now been several months with declines or unchanged readings. This is important because this indicator has done a good job historically of signaling when we’re likely heading for a recession. And if we look back at the kind of rollover we’ve seen so far this year, that type of action has usually resulted in a recession in the not-too-distant future afterward. That doesn’t really tell us anything about the potential magnitude or duration of any possible recession, which will be determined by how ugly the economic situation becomes.
Housing
While housing activity is weak and will weaken further, the sector has had the highest equity/assets ratio since the 1950s. While higher interest rates will make adding incremental debt less attractive for households, the vast majority of household debt is fixed rate (and therefore not vulnerable to a rate increase from a performance perspective).
In addition, existing debt coverage as a percentage of disposable income remains extremely high. That means debt service payments are a low share of disposable income relative to history. The housing sector is in trouble BUT this data makes a repeat of the Housing/Financial crisis extremely remote.
The latest mortgage purchase reading from the Mortgage Bankers Association released this week showed the lowest level of applications since the start of 2015. That would imply further significant declines in new and existing home sales data to come.
What could turn ugly
The Consumer: Credit Card Debt is back to new highs. One interesting aspect of the post-COVID stimulus bonanza was that many people did do the prudent thing by paying down credit card debt. There was a noticeable drop in the balances on revolving debt in 2020 and into 2021, but since then the total amount of credit card debt has ballooned once again to reach a new all-time high.
Consumer Credit (WWW.fred.stlouisfed.org/)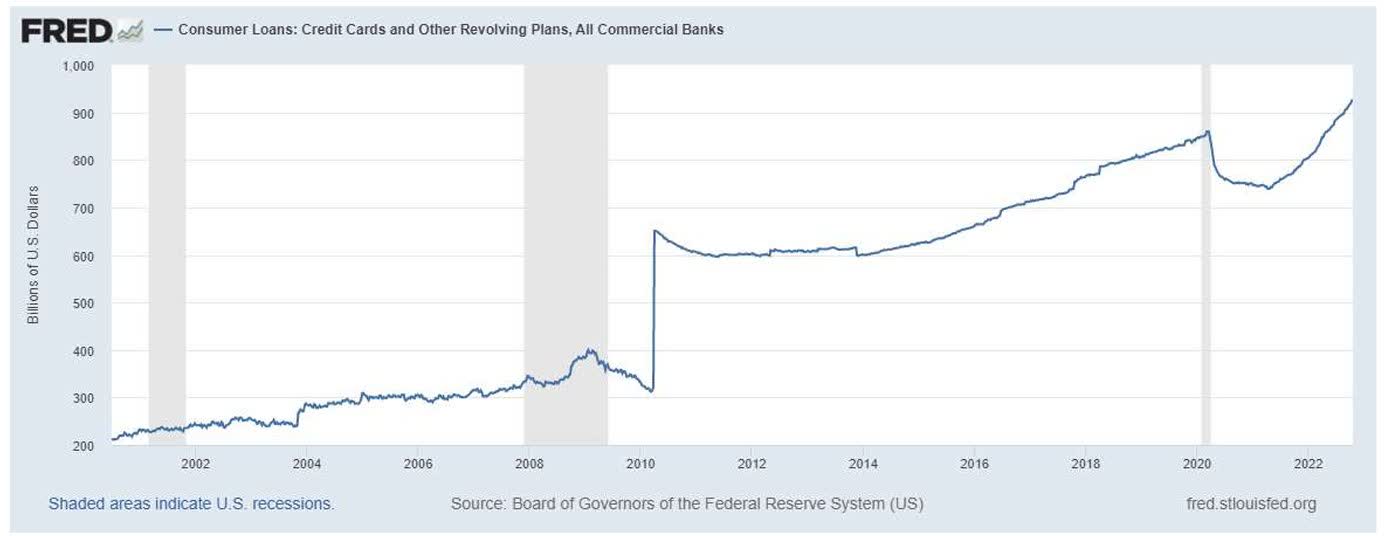
That probably indicates that more people are now having to rely on credit cards to pay for groceries, gas, and bills and they may not, therefore, be in the best position to then pay off that debt. Retail and food services card transactions remain ~12% above pre-pandemic levels. And while credit card debt always features high-interest rates on outstanding balances, higher rates, in general, are not helping, with the average rate for a new credit card hitting 21.4% in September according to Consumerreports.com.
Credit Card delinquencies are rising and likely to keep rising. Most economic data points have some sort of lag, but credit card delinquency data is exceptionally bad because it takes at least 30 days of being late to be considered “delinquent” and then it takes some time to report it as well. So the latest delinquency data we have is from way back in April, but even then it looked like it had bottomed and would now rise.
Delinquency (WWW.fred.stlouisfed.org/)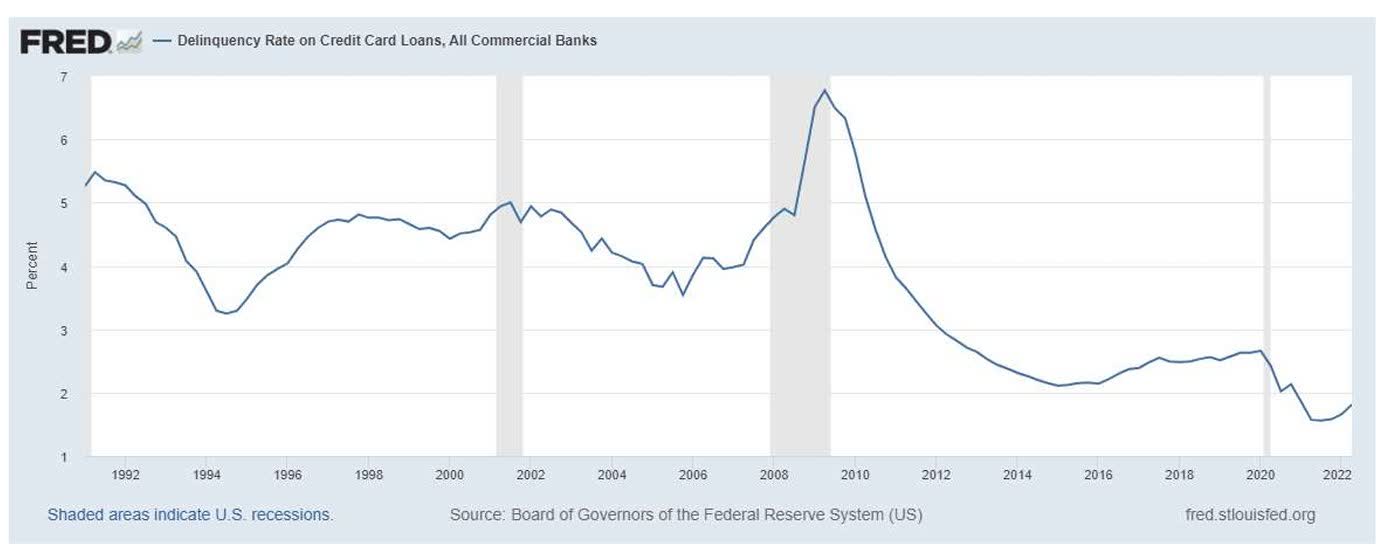
While overall the delinquency rate is rising from a low level, it is a sign that things are getting worse for the economy and consumers rather than better.
U.S. consumer is spending ~4% more than what one would predict based on income levels. In sum, they are burning through the excess savings built up during the pandemic. In sum, today’s level of spending, financed by a low savings rate, simply cannot last too much longer.
Excess Savings (www.factset.com)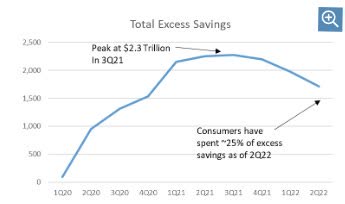
So, while the economic slowdown is progressing as expected, Credit card use can only take consumer spending so far. We know that it will be up to the consumer to keep the U.S. out of a deep recession, and that will be dependent on how Corporate America fares in the next few months. They and only they can keep the job market strong. We’ve seen the first cracks in labor market conditions as reflected by multiple companies either slowing (e.g., Microsoft, Alphabet), freezing (e.g., Amazon, FedEx), or cutting (e.g., Meta, Intel) jobs.
To the surprise of likely no one, the “Quit Rate” in the United States is now dropping after hitting a new high almost one year ago in November 2021. People tend to project the recent past into the future, so if times are good and confidence is high, more people feel good enough about their job prospects to quit their jobs since they feel they can always get a new, better job. This metric tends to peak in advance of recessions, and the magnitude of the drop over the past year has really only been seen in the past 20 years around recessions (gray-shaded areas).
Quit rates (WWW.fred.stlouisfed.org/)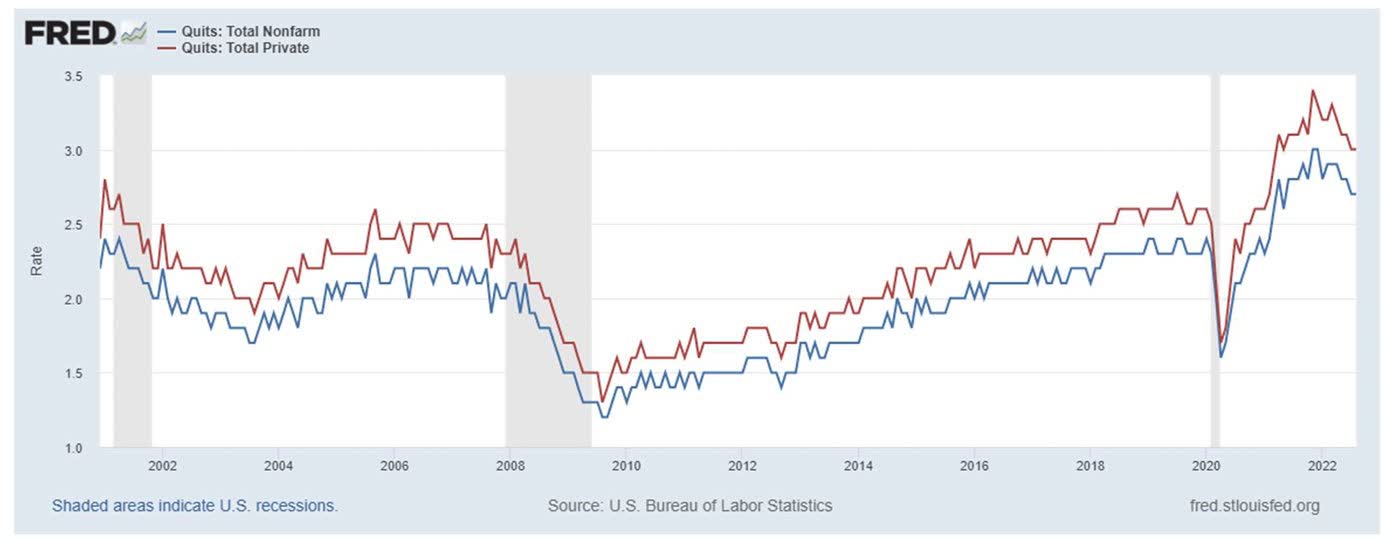
The bottom line:
Unquestionably, the longer-term MACRO outlook for the US equity market is based upon the macroeconomic fundamentals, earnings growth, valuations, etc. While not statistically significant, sometimes investors want to ride the wave of historical market trends and renewed positive sentiment on inflation. It should be common knowledge by now that mid-term election years often produce above-average returns. That historical pattern and the fact that November is one of the strongest periods for equities can keep the indices resilient until year-end. Beyond that, we’ll just have to wait and see how the MACRO Inflation/Interest Rate trends play out.
While the MACRO fundamentals paint the background, I always turn to the technical picture (the foreground) to finalize my near-term strategy. My latest report on the technical view of the markets is updated daily for members of my investment service here on Seeking Alpha. I issued a NEW SHORT TERM ALERT to members this week.
The Week on Wallstreet
Coming off a losing week investors faced the prospect of dealing with plenty of headline risk. The Mid-Term elections and another CPI report were on tap as market-moving catalysts. The S&P 500 started off on a positive note adding 1% on Monday and following that up with a 0.50% gain on Tuesday that pushed the winning streak to 3 days.
All of that and more was given back on Wednesday when every index was down more than 2+%. The CPI data was released and Treasury yields tumbled with the 10-year finishing at 3.81%, and the U S. Dollar suffered its biggest one-day loss in seven years. The imposing Headwinds became strong Tailwinds for stocks, as sentiment changed before the opening bell was rung.
The S&P 500 posted its best day in over two years as the index rose 5.5%. The NASDAQ was even more impressive rallying 7.35%. Technology outperformed with an 8.33% gain while Real Estate and Consumer Discretionary also rose over 7%.
Global Markets
International Market Indices have gotten off to a strong start in November. Valuations among emerging-market countries outside of China are trading at cheap multiples, and their return on equity is at the highest level in decades. Many are benefitting from the run-up in energy and commodity prices and to broad central bank tightening a year before the Fed stepped in, helping ease the sting of a strong dollar in many EM countries.
The six-month charts of the MSCI All-World ex-US ETF (CWI) and the MSCI Emerging Markets ETF (EEM) are starting to turn. While these two ETFs remain in long-term downtrends, they’re showing signs of life over the last month or so. Both appear to be in a bottom-forming process, with CWI taking out early October highs and EEM moving above the top of a shorter-term downtrend channel.
The economy
The NFIB Small Business Survey declined 0.8 points in October to 91.3, which is the 10th consecutive month below the 49-year average of 98. NFIB Chief Economist Bill Dunkelberg;
“Owners continue to show a dismal view about future sales growth and business conditions, but are still looking to hire new workers. Inflation, supply chain disruptions, and labor shortages continue to limit the ability of many small businesses to meet the demand for their products and services.”
NFIB (www.bespokepremium.com)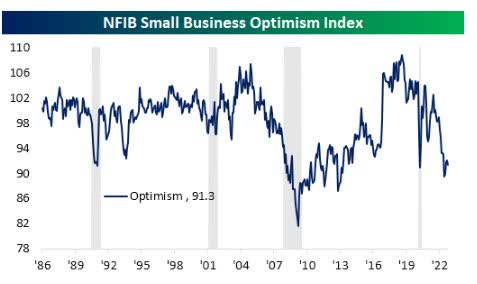
Inflation
Welcome relief in this week’s CPI report as both headline and core CPI came in below expectations. The all-important CORE CPI increased +0.3% vs. +0.5% expected and +0.5% prior. That rise is the slowest core M/M increase since September 2021.
The year-over-year CPI measure fell to 7.7% (8% expected) from 8.2%. That represents the smallest 12-month increase since January. The CORE year-over-year gain fell to 6.3% from a 40-year high of 6.6% in September.
There is no doubt that this is a positive step in the inflation fight. Keeping the situation in perspective suggests we now need to see more prints run at or below this month’s reading of 0.4% before victory is declared.
Job scene
While today’s CPI print took the spotlight of positively received economic data, jobless claims have continued to rise a bit. Seasonally adjusted initial claims rose to 225K from last week’s 1K upwardly revised level of 217K. However, continuing claims have been more consistently climbing in recent weeks. Now at 1.49 million, claims have risen in each of the past four weeks, bringing the reading to the highest level since the end of March. With more and more corporations announcing layoffs, this is a data point to keep an eye on. I do expect to see the Employment picture get sloppy as the economy slows.
Political scene
It is natural for investors to question the influence that elections have on the market’s performance. In the past, it wasn’t such an influence because of the offsetting nature leading to a backdrop with “moderate” policies in place. Over time, moderation in anything leads to stability. There has been a sea change recently and the debate over the influence of policy will now rage on. The mid-term elections are over, so at the very least investors might get a reprieve from the incessant political rhetoric.
However, there is no debate that long-term investors should focus on the fundamentals. While it is important to look at the political composition of Congress, there are more important factors such as the state of the economy, the Fed’s intended policy path, the trajectory of inflation, and the resiliency of earnings growth when it comes to determining an equity outlook.
On the latter, investors have a lot to be concerned about. On the fundamental side, nothing has changed. The Fed is still aggressively hiking rates, the economy is weakening, and the stock and bond markets are at the tail end of one of their worst years in history. There has been plenty of rhetoric covering many topics leading up to the election. However, the stock market isn’t concerned about “talk and opinion”. It has a focus on economic priorities such as taxes, regulatory issues, and inflation as the CORE political issues. Whether there can be any change in the trajectory of the economy due to the results of the election remains to be seen.
Mid-term election votes are still being counted
It’s a scene from a third-world country but as of this writing, there is still DOUBT if the House has swung to the Republicans. The following commentary is predicated on the Democrats losing control of the House, if they do not then this commentary is meaningless and a complete reassessment of the situation will be necessary. If the Republicans fail, then in reality nothing has changed.
The results of the mid-term elections have set a backdrop where it is unlikely to be much in the way of changes legislatively, so get ready for two years of gridlock. That equates to “moderation”, but not “change”. As mentioned in past missives, gridlock is not so good when the economy is poor and struggling. Growth incentives are needed to initiate “change” and it appears the path to the slightest hope for that remains blocked.
There was a time when politics didn’t matter when it came to investing. However, times have changed. When ANY political entity in ANY part of the global economy decides to focus on extremes when dictating policy it can have an extreme impact on the entire global economy. This year will serve as a poster child of the extreme mistakes that are leading the globe into recession.
The bottom line
There is reason to add a very small dose of optimism to the MACRO backdrop. The moderation I referred to will come in the form of “what is not going to be done” versus “what is going to be done”. Instead of trying to micro-manage the impact of this situation and review every minor detail, let’s start with just TWO themes that have the ability to usher in “change”. This is a desperate change the economy needs and the equity market is looking for.
Elections do have impacts and given the results of mid-term results this week the era of fiscal policy in the form of stimulus spending working against the Fed’s efforts to rein in inflation comes to an end. We can expect the word “austerity” to become part of the economic scene. That effectively removes a speedbump for the Fed.
In addition, the threat of the Oil Industry windfall profit tax proposals, and every other type of concocted “tax” is now off the table. The anti-fossil fuel regulatory actions will at the very least be stifled. While that is positive news for the overall business climate, we have to remember the damage that has been done and the inflationary environment that still exists. I repeat, nothing has changed.
Therefore when we add it all up, the handcuffs on growth remain in place while the threat of adding leg irons is gone. It will be some time before the handcuffs are finally removed so we shouldn’t expect to see any significant impacts for a while. Since the economy and the markets can be classified as POOR and struggling, that is not a positive backdrop for both.
Earnings
Earnings season is not over as there are still many companies representing ~15% of the S&P 500’s market capitalization left to report. On a positive note, the percentage of companies beating sales estimates is trending back near the historical average (65% versus the previous 20-quarter average of 69%), and the percentage of companies beating earnings estimates have been steadily improving (70% versus the previous 20-quarter average of 77%).
It is important to note that these averages were inflated by the record-setting earnings seasons experienced coming out of the pandemic. Overall, the earnings season has not been stellar but better than feared. However, the market has gotten more discerning reacting to the results. Companies beating on both the top and bottom line are outperforming the S&P 500 by 1.2%, on average, in the three days after reporting as companies missing both are underperforming the index by 6.8%, on average, over the same period.
It’s no surprise that companies are starting to mention rising utility costs affecting margins. I’ve mentioned it for a while, Energy costs affect everyone and everything, and will keep higher-than-normal inflation cemented in place. When companies start mentioning this while explaining expenses, it’s a meaningful data point.
Consensus 2022E EPS for the S&P 500 is now $219, down $3 since September, while consensus 2023E EPS is now $233, down $7 from September. Overall consensus EPS has been coming down since June, but I suspect any bottoming in EPS expectations will occur in a calendar Q1 when full-year guidance is given.
There is an interesting skew where small/mid-cap index EPS expectations are holding up better than large-cap, while EPS expectations in value indexes are holding up better than growth indexes. That has been reflected in the price action.
Investors can expect this trend will continue as the substantial weakening in international economies seems increasingly evident, even as U.S. consumer spending and the overall U.S. economy remained strong through 3Q, and the greater international exposure of larger caps and growth as a style is becoming evident.
Food for thought
In the days before the midterm elections, the “agenda” was reinforced again. In fact, the administration is ready to double down on its ill-fated, inflationary energy policy.
We are shutting down coal plants”,
“there will be no more drilling”,
“we are going to use Wind and Solar to provide power.”
The Eurozone uttered the same words and has paid the price ever since.
The US energy policy is like watching a train wreck in slow motion. We know (well some of us know) what the end result will be, but somehow hope someone turns off the movie before the ending.
Unfortunately, the present energy policy won’t allow anyone to locate the switch to end this bad movie. Utility bills have already increased and it’s about to get worse, as the average consumer is looking at a 15-30% increase in their bills.
Here is a response from someone that was duped into believing something had changed in D.C.
“President Biden’s comments are not only outrageous and divorced from reality, they ignore the severe economic pain the American people are feeling because of rising energy costs. Comments like these are the reason the American people are losing trust in President Biden and instead believes he does not understand the need to have an all in energy policy that would keep our nation totally energy independent and secure.”
Nothing has changed. Whether it be here in the US or in the EU, NO one is changing the ill-fated mindset and policy decisions, and therefore the train wreck will continue.
The Daily chart of the S&P 500 (SPY)
Deja Vu all over again, as we watch the S&P 500 come off the recent new low and is making a run back to the resistance trend lines that have capped the index since April.
S&P 500 Nov 11th (www.FreeStockCharts.com)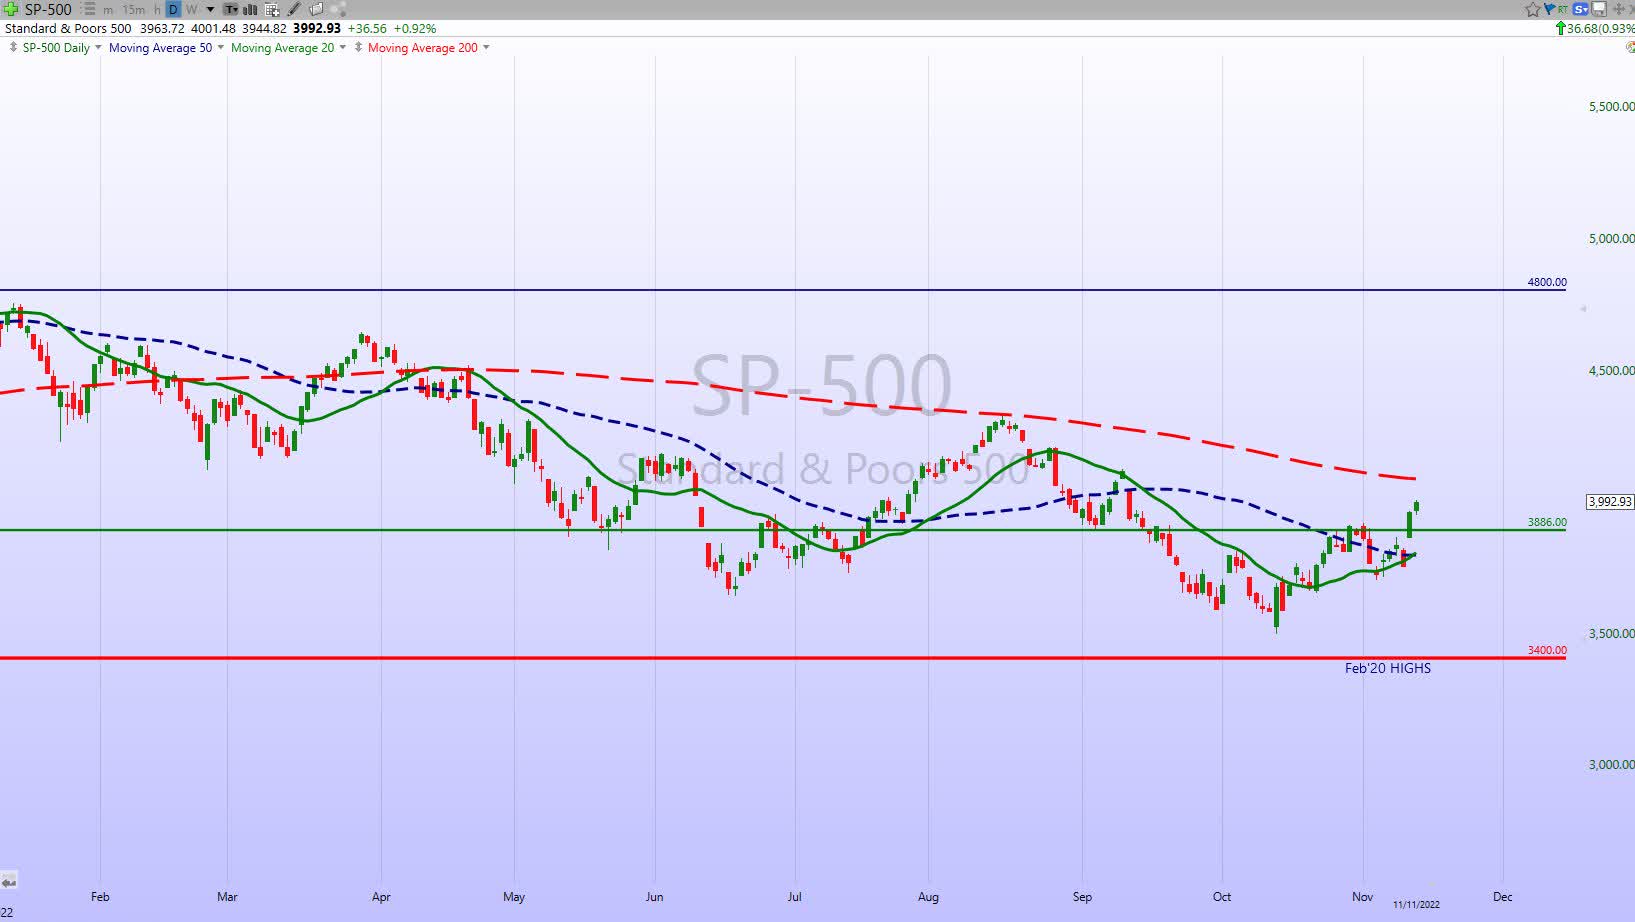
Investors now have to wonder if this time will be different. Can the S&P 500 break above resistance in a decisive fashion that could signal the very early beginning of a new BULL trend? OR will this once again be another failed BEAR market rally? The internal indicators are also giving signals and the combined results from ALL of the data will answer that question.
Investment backdrop
As noted last week, the month of October was quite rewarding for the BULLS. According to Bespoke Investment Group, only nine other months saw the Dow gain more than its 13.96% last month. Curiously, though, when I looked at the other months that were higher on that list, all but one took place during what is now commonly considered “BEAR markets,” and the lone exception was in November 1928, near the peak of the “roaring 20s” secular bull market (which wasn’t exactly a great long-term buying opportunity).
Six of the nine months with higher Dow gains than this October occurred during the Great Depression from 1931 to 1938. The remaining two occurrences were in the middle of the 1970s when stagflation ruled. The fact is that all of these previous stellar months for the Dow were bad long-term buying opportunities. Incredible months like these tend to happen only in and around bear markets when volatility is high.
The BULLS will need to see follow-through for it to actually mean anything. If we stall out here soon it will become another failed BEAR market rally. Another caveat to the October DJIA outperformance is that the other major indices didn’t see the same type of gains, and that ushered in the start of this bifurcated market scene. They still rose, but considering the NASDAQ 100 just pushed above its October 6 high, it’s not accurate to say that “everything” has been working well lately.
This will remain a SELECTIVE “stock picker’s market” rather than the “passive” indexing market that rewarded investors for so long. An investor either stays with stocks in a BULL trend that is working OR gets churned into submission by the volatility. For most, it is a difficult transition. Focus on the new leading sectors and industries rather than the ones that carried the indices for so long during the bull market of the past few years.
Oil & Gas Drilling stocks are up 80%. The entire Energy complex is up ~60% and selective Agricultural names are up 16% even after suffering deeper pullbacks since earlier in the year. All of these are areas I’ve talked about several times in past reports and all play into what I’ve said all year – that we need to use a different playbook than the one that worked in the past.
Thank you for reading this analysis. If you enjoyed this article so far, this next section provides a quick taste of what members of my marketplace service receive in DAILY updates. If you find these weekly articles useful, you may want to join a community of SAVVY Investors that have discovered “how the market works”.
The 2022 Playbook is now “Lean and Mean”
If a stock isn’t in the Energy, or Healthcare sector, then it is in a BEAR market trend. That leaves investors looking for near-term “long” opportunities with a very limited playing field.
Bifurcated market
We’ve seen how the indices have diverged with the DJIA and the NASDAQ the two bookends. The DJIA and the IWM look more positive, while the NASDAQ has a more negative look. The S&P sits in the middle of these two bookends that have a very wide discrepancy. I can see this environment remaining in place until at least the end of the year as the Growth/Value repositioning take place.
Sectors
Energy
Energy (XLE) continues to rally and is now at a critical juncture, as it encounters the old highs. The XLE can take one of two paths now. Consolidate this recent rally just below the old highs, then breakout to new highs, OR pull back to support. Either way, I wouldn’t be too aggressive by indiscriminately adding energy names now.
I do have an exception to that. Coterra Energy (CTRA) was sold off hard on the news of a solid EPS report that announced an increase in its dividend. That new dividend is payable Nov. 30; for shareholders of record Nov. 16; ex-div Nov. 15. The annualized yield is 9%.
Whichever way this near-term technical situation is resolved, Energy remains the sector to be involved in with an overweight positioning.
Energy fundamentals
For energy markets, the recent weakness in Chinese demand for crude and products has been a huge story, but as shown in the chart below, import volumes have ramped back up over the course of the fall.
China oil imports (www.bespokepremium.com)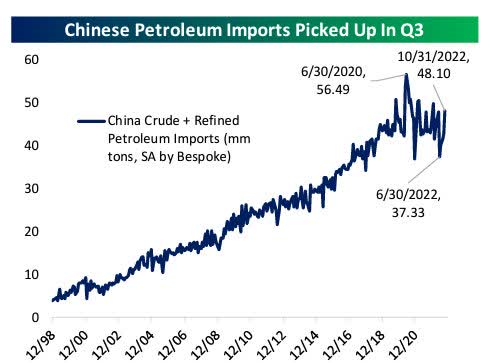
A return to steady demand growth from China would be a major oil market catalyst. I also do not see any cracks in the stance policymakers around the world have taken toward fossil fuels. As long as that mindset remains energy prices and costs for consumers will remain high.
Natural gas
The Nat Gas ETF (UNG) (19) continues to give me gray hairs. The volatility has been amazing BUT it appears support in the $18 range has held. That also means the longer-term trendline has not been violated and the ETF remains in BULL mode.
There is heavy resistance overhead in the $23-$24 range and if the ETF can get back to that level it could be a struggle to get above that in the near term. I continue to HOLD my overweight positioning.
Financials
The Financials (XLF) posted a nice 5.8% rally this week. After underperforming for a long time, the ETF has now started to outperform as rates move higher. IF the group can break out it might be just enough to take the major indices with it. With the ETF at $35.90 on Friday, a move and DECISIVE close above $36 would be the first sign that the BEAR market in Financials might be coming to an end.
Stay tuned and keep an eye on this important signal.
Commodities
It wasn’t too long ago that I mentioned what I believed was a positive setup for the Silver ETF (SLV). My entry into a position in early October turned out to be premature. The ETF dipped back for another test of support right after I bought SLV. There appears to be a decent base formed in the $16.50-$17 range, and now SLV has to contend with overhead resistance at $20. It is an intermediate /long-term hold for me now and if the ETF can get past resistance, the $23-$24 range is possible. SLV closed at $20 on Friday.
Healthcare
More sideways action recently and that is a win. The Healthcare group (XLV) has shifted between BEAR and BULL trends in the last 6 months but currently finds itself back in BULL mode. I continue to find selective opportunities in this sector, and I like the group in a slow economic backdrop. People aren’t going to stop taking medications or completely avoid trips to seek medical care.
In addition, medical device companies are on fire as the COVID headwind that impeded medical procedures is all but gone.
Biotech
I continue to like and recommend taking positions in the Biotechs (XBI). There is no need to be overly aggressive here, but this promising trend that was identified in June is still looking very interesting. Since I identified this reversal in June, the ETF is up 32%, while the S&P is up 9% in the same time period.
Technology
The beaten down Tech sector rallied the most after the cooler Inflation report. The NASDAQ and the Technology ETF (XLK) still have the poorest technical patterns around, but this could turn out to be a nice relief rally in the making. Make no mistake the BEAR trend is firmly entrenched.
Semiconductors – Sub-Sector
Coming into the week, a true short/intermediate and long Term BEAR trend continued to plague the semiconductor sector (SOXX). The 14% two-day rally to end the week changed the short-term view and that bodes well for any year-end rally in stocks to continue. Savvy investors were treated to a “trade” in the group that has now gained 29% Some profits were taken on Friday. It is all about being in the right place at the right time and that doesn’t occur by accident.
Ark Innovation ETF
The Ark Innovation ETF (ARKK) continues to struggle. The ETF dropped from resistance at the $40 level in late October and this week established another new 52-week low at $32.50. Given the sharp 13% rally on Thursday, followed by another 8% move, that break below the support might definitely looks like a false move.
With the ARKK at $40, the risk/reward is defined. The recent low was ~$32.50 and that is a mental stop for any LONG “trade” that is put on now. Those that aren’t convinced that the rally is for real can add a position in SARK the Inverse ETF that shorts ARKK. I have had a LONG trade in place since June.
Cryptocurrency
Liquidations after the FTX regional brokerage firm implosion drops Bitcoin to 2-year lows.
Crypto Market Cap (www.bespokepremium.com)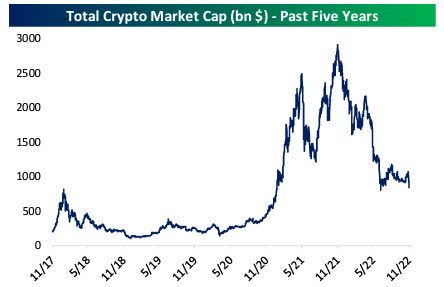
As the pain in the wake of FTX’s collapse continues, bitcoin prices have set new cycle lows, falling below $17K intraday. Prices bounced off those lows but in my view, this “event” casts doubt on the entire industry and has set the “credibility” of this “asset” class back years.
The total crypto market cap is down significantly but any fears over contagion are unfounded. The entire crypto space was about equal to one-third the value of Apple (AAPL), an insignificant amount. While there is no contagion to fear in the stock market there is plenty of “contagion” that will ripple through the Bitcoin-related community for quite some time.
Applying margin to an asset as volatile as Cryptocurrency is a recipe for disaster and this could make the Enron debacle look like a walk in the park. The FTX bankruptcy shows the company had 134 affiliates spread across the globe and may have liabilities of up to $50 billion. Enron had liabilities of $23 billion. Institutional and High profile investors that looked to Bitcoin as a “Store” of Value” may have to reassess the situation as they respond to margin calls. I initiated a short position in Bitcoin using the (BITI) ETF on Tuesday.
Bitcoin classified as an “asset”, is now declared “DEAD”
Final thoughts
November is supposed to be a good month for stocks. After a poor start to this mid-term election year, isn’t this the time we are supposed to be gearing up for a year-end rally?
Midterm Elections (www.factset.com)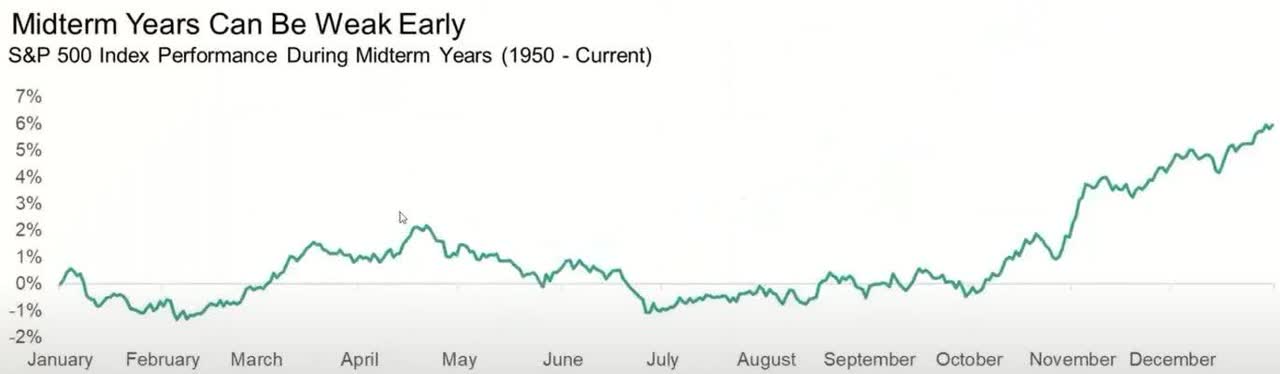
The first few trading days didn’t impress the BULLS as the S&P 500 closed down ~3% in what ranks as the worst three-day start to a month for the index since August 2019 and the 11th worst start since late 1952 (when the five-trading day week on the NYSE began). The NASDAQ lost 4.6% in the first four trading days.
So just when it looked bleak, the equity markets reversed course once again and all of these losses were wiped out with this week’s rally. Investors now wonder what comes next. I’ve already noted there isn’t much to highlight as “GOOD”. The “BAD” is a poor backdrop for stocks. The “UGLY” is well known and what COULD TURN UGLY has a HIGH probability of occurring.
Whether or not a change in policy can affect a change in the economic backdrop is unknown. Some will say it’s highly doubtful. I intend to proceed with an OPEN mind. The stock market will provide all of us with the answers. It’s just a matter of interpreting the encrypted messages.
A salute to our Veterans and a moment of silence for those that made the supreme sacrifice for this country.
“Honor to the soldier and sailor everywhere, who bravely bears his country’s cause. Honor, also, to the citizen who cares for his brother in the field and serves, as he best can, the same cause.” – Abraham Lincoln
A salute to our Veterans and a moment of silence for those that made the supreme sacrifice for this country.
Postscript
Please allow me to take a moment and remind all of the readers of an important issue. I provide investment advice to clients and members of my marketplace service. Each week I strive to provide an investment backdrop that helps investors make their own decisions. In these types of forums, readers bring a host of situations and variables to the table when visiting these articles. Therefore it is impossible to pinpoint what may be right for each situation.
In different circumstances, I can determine each client’s personal situation/requirements and discuss issues with them when needed. That is impossible for readers of these articles. Therefore I will attempt to help form an opinion without crossing the line into specific advice. Please keep that in mind when forming your investment strategy.
THANKS to all of the readers that contribute to this forum to make these articles a better experience for everyone.
Best of Luck to Everyone!
Be the first to comment