

bojanstory/E+ via Getty Images
“It’s a recession when your neighbor loses his job; it’s a depression when you lose yours.” – Harry Truman
The stock market has muddled thru another rate hike and more HOT inflation numbers. The talk of recession has been everywhere with the only issue being debated being the length and severity of the event. As of Friday’s close, the S&P was at 3962 about 8.5% off the June intraday lows.
Equities have discounted a lot of negative news (at one point down ~24% from prior highs), and the predominant market trend remains downward. At this point, equity investors can take small consolation about a pending recession: the losses from here are almost certain to be smaller through a recession low than they would have been from the top at the end of last year. With inflation still running too hot in June, the Fed’s only tool for reducing inflation is slowing demand through higher rates. Until signs are clear that the peak Fed Funds rate of the cycle is in sight, real rates will continue rising and put further pressure on valuations. However, we now have to acknowledge the fact that much of the current poor fundamental backdrop is priced in.
That brings us to an earnings season that is in full swing now and we can expect these corporate reports to dominate the headlines. With investor sentiment at depressed levels, market reactions to earnings beats and misses will likely be magnified. In the weeks ahead, the ‘punishment’ or selloff post an earnings miss is likely to be harsh. On the flip side, we have seen earnings that are not as bad as feared provide sharp spikes to those companies that were being priced for the worst. Guidance provided will surely be parsed and scrutinized.
The torrid pace of economic growth benefitted all sectors last year, but the challenging environment and difficult-to-beat comparisons will cause dispersion in earnings growth and margins. Here again, most of this is expected and already priced in. The Energy sector is expected to be the standout, with healthy margins and earnings forecasted to grow more than 260%.In comparison, S&P 500 earnings ex-energy are expected to be down ~3% and four sectors are expected to have negative EPS growth—the most since 4Q20. Margins of those sectors are expected to modestly contract. Here again, most of that has already been priced into this market.
Yield Curve Inversions
The yield curve is often used as a good indicator of economic conditions, given its history of inversion (where short-term rates rise above long-term rates) before economic contractions and bear markets. The FED and many economists put the most credence on the 10-year vs 3-month spread for a gauge of economic conditions, but the 2-year Treasury spread offers an indication of where the Fed is likely heading. With the Fed becoming increasingly transparent and the 10-2yr spread inverted, the odds of economic contraction are high in my view. That said, inversions typically occur before or near bull market peaks. With the S&P 500 already down ~24% at the lows, it sure seems a ‘mild” recession has been accounted for.
I’m not sure we should place too much emphasis on this, but there is at least historical precedent for the 10yr-3mo yield spread inverting near bear market lows (1957 and 1966). With the S&P 500 already recording a loss of 24% at the lows, the current bear market lows may come near inversion in the 10yr-3mo spread. The 10yr-3mo spread has been narrowing quickly. Since early May the spread has gone from around 225 basis points to 19 basis points today. Assuming the present pace continues we could see an inversion very soon.
COVID-19
I honestly believed I wouldn’t have to mention this topic again, but there we are in July 2022, and there are still “issues”. The world is on the cusp of reaching a point where two-thirds of the population is at least partially vaccinated. As of this week, the number is 66.5%. For some perspective, the US is at 78.4%, though that still puts it near the bottom among industrialized countries.
Despite the progress in vaccination, new variants continue to emerge, exacerbating the risk of reinfection, i.e., people getting COVID a second or even third time. The focal point now is the BA.5 subvariant of Omicron. The CDC considers it to be 20% more transmissible than the ‘original’ Omicron that had caused a severe wave last winter. In absolute terms, cases are highest in France, Italy, the US, Germany, Brazil, and Japan – notice the broad geographic footprint.
Daily cases in China are less than one-third compared to France, but China’s zero COVID policy means that the spread of BA.5 will lead to more lockdowns – it is purely a question of in which cities and for how long. Macau’s casinos were shut down recently and Q2 GDP came in lower than expected primarily due to ‘lockdowns” Of much greater concern for global supply chains is Shanghai – which, already had been in and out of lockdowns since April.
The U.S. Dollar
I have often discussed the strength of the US dollar and its negative effect on corporate earnings. The Bloomberg USD Index traded above its record highs from the peak of the COVID shock recently. For the market as a whole, dollar surges these days are generally consistent with a declining market; a higher dollar is a signal of risk aversion as much as it is a reflection of a stronger US economy relative to the rest of the world. We finally got a “pause” in what has been a parabolic move in the dollar in the last few days. That helped keep the commodity and technology sectors rallying. If we have seen an intermediate-term top in the USD, that would be welcome news on the earnings front.
Bottom Line
It has been nearly impossible to forecast this market in the short term. No matter how many data points we want to use to make short-term forecasts the path of inflation will be a large factor. It will determine the magnitude and duration of market weakness OR a potential turnaround. Of course, another factor that drives stock prices is corporate earnings. Unfortunately on that front, the pro-growth initiatives are nowhere to be found. With the emphasis in D.C. still focused on spending, heightened regulations, and raising taxes, it is going to be a difficult road ahead for corporations. To that end “policy” out of Washington will become a “KEY” to where the economy and market go in the months ahead.
Regrettably, combining spending and raising taxes in an anti-business climate while the Fed is raising rates is the recipe for a no-growth economy.
The Week On Wall Street
Monday produced a back-and-forth session where neither the buyers nor sellers could gain control. What was notable was the absence of follow-through to the selling that finished the prior week’s trading. This unsure market continued by sending mixed messages. A 1.4% loss for the S&P on Tuesday where all the indices were lower, was followed by a 2.5% gain on Wednesday where all the indices posted gains. It was “risk on” after the FOMC announcement as the NASDAQ celebrated its best day in over two years.
That strength continued into the end of the week wrapping up a positive month of July.
The Fed
FOMC announced a well-expected 75 basis point hike in rates. Also as anticipated, the policy statement said the Committee;
Anticipates that ongoing increases in the target range will be appropriate. The Fed is strongly committed to returning inflation to its 2% objective, and is highly attentive to inflation.”
The FOMC will be looking for compelling evidence that inflation is indeed coming down.
Recent indicators of spending and production have softened, in contrast to June which said overall economic activity appears to have picked up.”
It was also indicated that the balance sheet will continue to be reduced.
We are still in the early stages of this rate hiking cycle and it is my view these initial rate increases are NOT the reason the economy is slowing. Rate increases typically take at least 6-9 months before the economy reacts. The weak data reports we are seeing today are the effects of 8-9% across-the-board inflation that is being driven by energy costs which affect EVERYONE.
The ONLY weak data point that is an immediate result of higher rates today is mortgage rates. So the issue is going to be how the economy is acting and what inflation looks like when these rate hikes do hit. That is where the long-drawn-out recession scene could take root.
However, there is a host of issues that can take place down the road which can change the inflation and interest rate story. Therefore, I don’t see much sense to lay out all of the “what ifs” and attempt to build a strategy without facts. The data will tell the story and assuming the FED follows the data, the path of the economy will follow.
Flexibility in any approach is the key.
The Political Scene
The Inflation reduction act took a step forward this week. The new agreement aims to “reduce carbon emissions by roughly 40 percent by 2030” and address inflation. The full text of the bill is not yet available. Schumer plans to submit the bill to the Senate parliamentarian for review tonight to start votes on the bill next week. As with any proposed legislation, this will be open to interpretation and scrutiny to see if the issues that need to be fixed will indeed be addressed.
From a concrete perspective, this legislation is positive news for EV makers and green energy names while possibly bad news for companies in the prescription drug value chain, while having only marginal impacts on aggregate supply and demand given its modest size relative to that of the US economy.
No matter how this bill is labeled it is still “spending” ($700 billion) and it contains increases in taxes. It’s easy to make an argument this economy doesn’t need either.
When you tax something you get “less” of it. Corporations will simply pull back, especially in this economic backdrop.
The Economy
Q2 GDP declined by -0.9% quarter over quarter. Personal income growth slowed to 1.0% from 1.8%, the GDP price index jumped to 8.7% from 8.2% and core PCE came in at 4.4% – versus 5.2% previously.
We now have seen two straight quarters of negative GDP, and while that may not meet the ‘official’ definition of a recession for some, it still doesn’t change the facts – the US economy shrank in the first half. It’s interesting to note that since 1947 (when quarterly GDP data became available) there has only been one prior instance of consecutive quarterly GDP declines without recession: 1947 itself.
Let me remind everyone that interest rate hikes haven’t impacted the economy yet. Impacts will be felt 6- 9 months from the start of this cycle.
Inflation
If anyone was looking for relief in the June PCE inflation (Fed’s preferred measure) data they were disappointed.
- The y/y PCE chain price metric rose to a 40-year high of 6.8% from May’s 6.3%, versus a prior high of 6.6% in March. The core measure rose to 4.8% from 4.7%, versus a 39-year high of 5.3% in February.
- ECI (employment cost index) came in higher than expected at 1.3% q/q in Q2 – versus 1.0% expected and just a tad below the 1.4% Q1 jump that marked a 38-year high.
- U.S. personal income rose 0.6% in June, a tad better than anticipated and with the previous reading revised up to 0.6% from 0.5%.
Employment Scene
Initial jobless claims continue to disappoint. Although this week’s release technically fell to 256K, it was from a 10K upwardly revised number of 261K last week. Both this week’s and last’s readings are the highest since the fall and would also mark the highest readings since the fall of 2017 outside of the historically elevated readings of the pandemic.
Consumer
Conference Board’s consumer confidence dropped to a 17-month low of 95.7 from a prior low of 98.4 in June leaving the measure at its lowest level since February of 2021. Expectations fell to a 9-year low of 65.3 from a prior low of 65.8 in June, while the present situation index fell to a 15-month low of 141.3 from 147.2 in June. The job strength diffusion index fell to a 14-month low of 37.8 from 39.9 in June.
This consumer confidence drop joins a Michigan sentiment level of 51.1 which is well below the early pandemic bottom of 71.8 in April of 2020.
They all have one thing in common. All of the measures have deteriorated sharply since early 2021.
Housing
New home sales fell 8.1% to a 590k pace in June, the slowest since April 2020. This follows the 6.3% bounce to 642k in May. The month’s supply of homes rose to 9.3 from 8.4. It ties for the highest since May 2010 and compares to an all-time low of 3.3 in August 2020. The median sales price dropped 9.5% to $402,400 after falling 2.7% in May to $444,500.
Pending home sales tumbled by 8.6% to 91.0 in June, much weaker than expected, after the surprising 0.4% bounce to 99.6 in May that broke a string of six consecutive monthly declines. It is the largest drop since April 2020 and the pandemic. The index was at 113.7 last June. Excluding the months around the pandemic, this is the fastest pace of erosion since 2011. The jump in mortgage rates amid the Fed’s rate hikes and the decline in affordability have been weighing measurably on sales, but that is in line with the FOMC’s strategy as it looks to tamp down demand to bring inflation under control.
Manufacturing
Perhaps these negative reports are signaling a bottom BUT until we start to see a rebound, like the markets the trend is down.
Dallas Fed index drop to a 26-month low of -22.6 extended the June plunge to a prior low of -17.7. That is three negative prints that mark the only sub-zero figures since July of 2020. Analysts saw an ISM-adjusted Dallas Fed drop to a 25-month low of 51.5 from prior lows of 54.0 in June. Chicago National Fed Activity index was unchanged at –0.19 in June. Two of the four broad categories of indicators used to construct the index made negative contributions in June, and two categories deteriorated from May. The index’s three-month moving average, CFNAI-MA3, moved down to –0.04 in June from +0.09 in May.
Chicago National Fed Activity index was unchanged at –0.19 in June. Two of the four broad categories of indicators used to construct the index made negative contributions in June, and two categories deteriorated from May. The index’s three-month moving average, CFNAI-MA3, moved down to –0.04 in June from +0.09 in May.
Chicago PMI tumbled 3.9 points to 52.1 in July following the 4.3-point drop to 56.0 in June. It remains above the 50 expansion/contraction level going back to July 2020, but it is the lowest since August 2020, which is a 23-month low. It was at 71.8 a year ago. The 3-month moving average dipped to 56.1 from 57.6 previously.
The Durables Goods report beat estimates, with orders gains with and without transportation, and a bigger than expected transportation orders rise that reflected a bounce in Boeing orders.
The Global Scene
Europe breathed a collective sigh of relief when the Nord Stream 1 pipeline – which in 2021 supplied one-eighth of Europe’s natural gas – came back online after maintenance. Few would have been shocked if Russia had decided to use this as a pretext to cut off the gas supply to Europe altogether. Even without that escalation, though, the Kremlin is already blackmailing numerous countries with supply cut-offs. The good news was short-lived. It was announced on Monday that supply to the region would be limited to 20% capacity.
This blackmail and the risk of more to come – not to mention record-high prices – are rapidly accelerating Europe’s push to disentangle its economy from imports of Russian gas. This is now become an “all of the above” story, with distinct strategies over near-term and long-term timeframes. For the next several years, existing power plants and other infrastructure cannot change much, which means LNG will need to play the central role in displacing Russian gas.
Business as usual in the EU is now completely off the table. It’s not a matter of whether there will be government interventions in Europe’s gas markets, but rather how forceful they will need to be. As with anything about gas demand, the answer will hinge in part on the weather. All of the most affected countries (Germany, Italy, and eastern Europe’s frontline states) have backup plans in place, and preparations are well underway to ensure a safe winter.
While there are regulatory nuances in how the various governments are approaching this issue, these are the steps that are being taken now and into the winter.
1. Coal-fired and nuclear power plants that were due to be decommissioned are allowed to continue operating. This is a common response in countries that are implementing coal phase-outs (which is most EU members) and nuclear phase-outs (Belgium and Germany).
2. Consumers are being encouraged to use less air conditioning (this summer) and less heating (in the winter) by adjusting their thermostats accordingly. Businesses are being incentivized to reduce gas usage via auction-based demand response programs, building on longstanding precedents in the electricity markets.
3. If gas storage in any given country falls below certain thresholds, some categories of businesses may face mandatory gas usage curtailments. These are typically heavy industrial operations, such as steel mills (e.g., ArcelorMittal) and chemical plants (e.g., Air Liquide, BASF, Linde, and LyondellBasell). To be crystal clear, there is no plausible scenario of gas rationing for homes
When an economy is forced to ration energy use, it’s being placed on life support. Looking toward 2030, energy diversification and the climate agenda point toward a sustained and massive buildout of renewable generation.
We witnessed the initial negative impact of the failed green agenda, and in chapter two of this saga, we will witness more pain from a self-inflicted energy crisis that will cement a recession in place for the EU.
Global GDP
IMF cuts their global forecast. The Fund cut its 2023 growth forecast to 2.9% from the April estimate of 3.6%, citing the impact of tighter monetary policy. World growth rebounded in 2021 to 6.1% after the COVID-19 pandemic crushed global output in 2020 with a 3.1% contraction. IMF Chief Economist Pierre-Olivier Gourinchas said in a statement.
“The outlook has darkened significantly since April. The world may soon be teetering on the edge of a global recession, only two years after the last one.”
I haven’t been in the ‘optimistic’ camp for GDP since Q4 ’22. Now with the EU almost certain to enter recession, and the US following the same path, that will leave China as the KEY to the global economy. A stronger than anticipated rebound in China will help avoid a protracted global slowdown. However, IF they continue on a path that handcuffs their economy and keeps growth muted in the 3-4% range then it will be extremely difficult for the globe to avoid a downturn.
China could not have written a better script to achieve leadership in the World’s economy.
Eurozone GDP
The Eurozone surprised everyone with a report their economy grew 0.7% in the second quarter despite the gas crisis and inflation surge.
European Economics Commissioner Paolo Gentiloni;
The latest growth figures were good news. Uncertainty remains high for the coming quarters: [we] need to maintain unity and be ready to respond to an evolving situation as necessary.”
The road ahead will continue to be challenged as Germany, the region’s largest economy was flat in Q2.
Earnings
Nearly 90 S&P 500 companies representing ~20% of the index’s market capitalization have already reported earnings, and it has admittedly been a lackluster start to the 2Q22 earnings season. Only 68% of companies have beaten their earnings estimates, well below the historical average of 77%, and the average magnitude of beats (+3.3%) is the lowest since 1Q20.
While none of this is shocking, the results have been better than feared, dampening the concerns that this quarter’s earnings and guidance would lead to significant downward revisions to earnings estimates. 2Q earnings and revenue growth have remained resilient at 6% and 11% respectively. Thus far, major banks have suggested consumer spending and borrowing remain healthy, transportation and delivery companies suggest healthy volumes, and healthcare providers continue to see robust activity—all signs reinforcing a better-than-feared earnings backdrop.
This past week was a big test yet for the markets as it was the busiest week of the 2Q22 earnings season. Nearly 170 S&P 500 companies representing almost half of the index’s market capitalization reported results. The focus was on the key sector constituents, such as Apple and Microsoft, which account for ~40% of the Tech sector’s earnings, and Alphabet, which accounts for ~37% of Communication Services earnings. While Alphabet and Microsoft both missed analyst estimates, they fell into the camp of better than feared. Both stocks rallied hard after their reports.
Over the next week, there will be days where more than 200 US companies will issue earnings reports, including one day with more than 300. So the earnings drama will continue.
Food for Thought
Energy Costs and Inflation
Get out the fireworks, strike up the band.
After one of the sharpest YTD surges on record, US consumers have seen a bit of relief at the pump over the last month as gasoline prices, as tracked by AAA, have seen a sharp pullback. The national average price of a gallon of gas dropped below $4.50 recently for the first time since mid-May. At any other point in history levels, this high would have been astronomical but compared to mid-June when the national average briefly topped $5, current prices seem downright cheap – at least on a relative basis. Welcome to the war on fossil fuels.
Oh, but wait. Despite the celebratory parties in D.C., there is no joy in Mudville. At ~$4.40 the national average has never been higher at this time of year, and the only year it was above $4 per gallon on 7/21 was in 2008. On a YTD basis, the average price is still up 34.3%, which is well above the average and median YTD gain at this point in the year, but 2021 (40.5%), 2009 (52.2%), and 2006 (35.3%) saw larger YTD increases.
The transition to “green” has now produced two of the worst years for gas increases in history.
While we have that welcome dip in gasoline prices that D.C. is crowing about let’s not forget what the “green movement” has wrought on the price of natural gas. Prices increased 62% in 2021 and so far this year have increased 78%. Consumers that are saving pennies as gasoline has receded from all-time highs, will now be paying a lot more dollars for their utility bills.
Ladies and Gentlemen let me remind everyone that energy costs feed inflation. Until energy policy changes, inflation has a HIGH probability of remaining elevated for quite some time. The “questionable” energy policy that is responsible for high energy costs across the board is more curious than ever.
More than 5 million barrels of oil that were part of a historic U.S. emergency reserves release to lower domestic fuel prices were exported to Europe and Asia last month, according to data and sources, even as U.S. gasoline and diesel prices hit record highs.
Some will say these are independent decisions by individual companies and not policy. I say if that is so, where is the “oversight ” during this energy crisis? Another example of how U.S. energy independence is not a priority here in the U.S.
All of this leads to a simple conclusion. From an investment viewpoint, a continuation of these policy mistakes will keep the energy sector in a BULL market trend.
Sentiment
Last week over 25% of respondents to the AAII sentiment survey reported bullish sentiment for the first time in over a month. As the S&P 500 has made a considerable move to the upside, bulls have continued to come back this week rising to 29.6%.
However, the bull-bear spread has risen to -12.6. That is the highest reading since the first week of June and is the 16th consecutive week with bears outnumbering bulls. That is now the third longest streak on record behind the 22 and 34-week-long streaks ending in December 1990 and October 2020, respectively.
The Daily chart of the S&P 500 (SPY)
The BULLS responded to a quick test of support and extended the rally off the June lows to 12%.
S&P 500 July 29th (www.FreeStockCharts.com)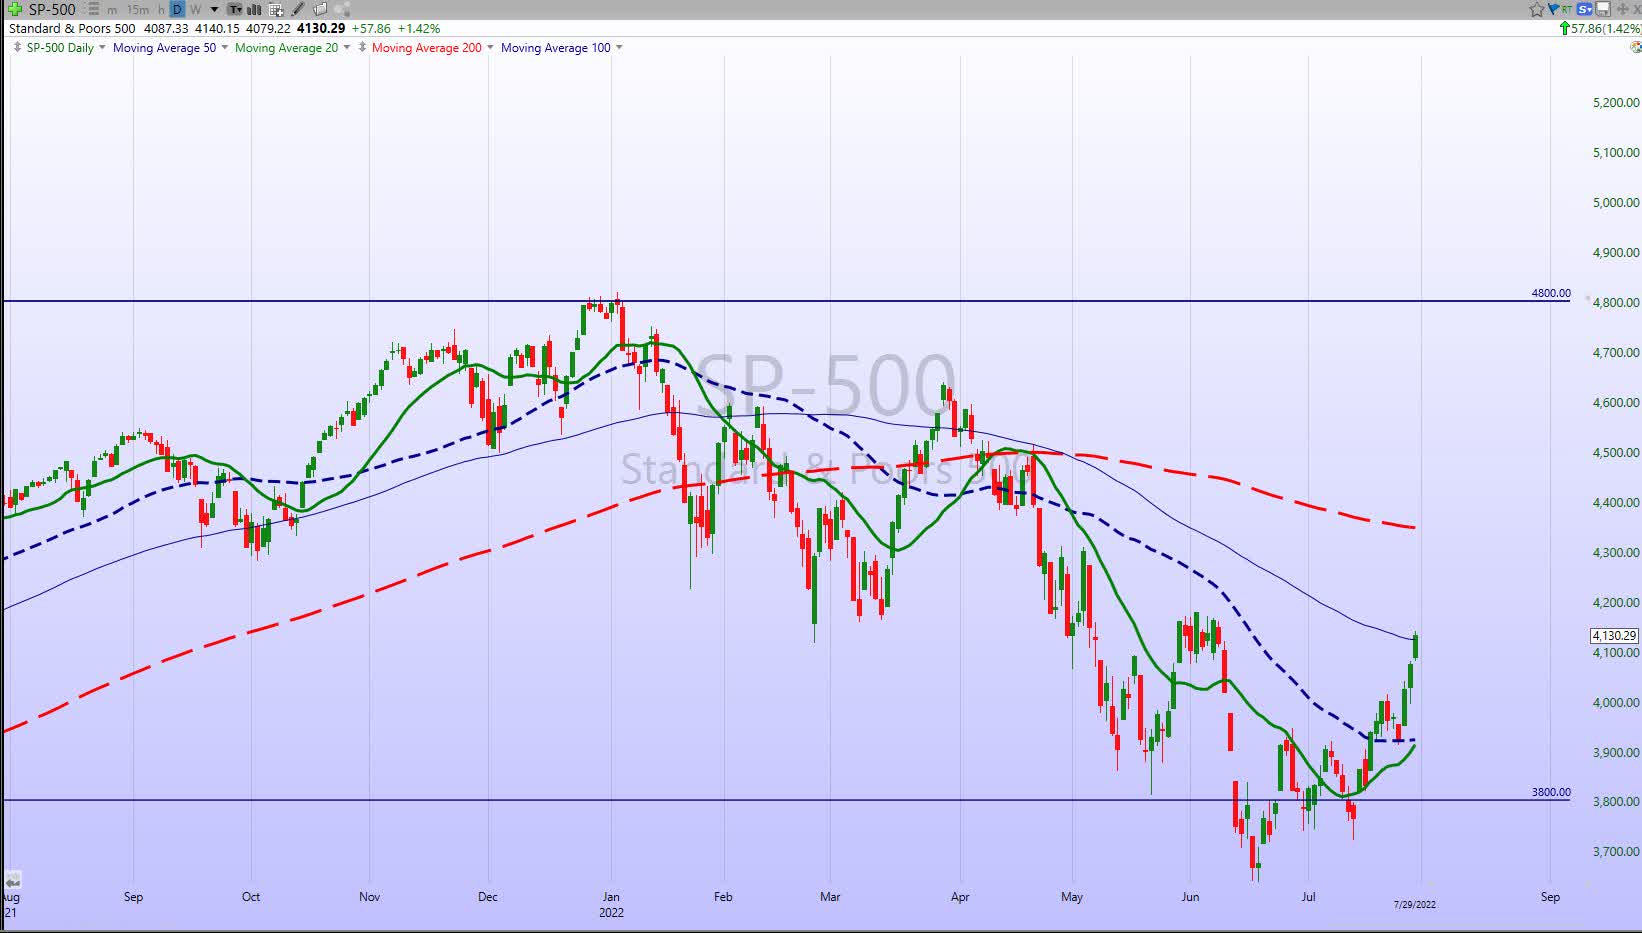
Overhead resistance looms as another test for this rally is on the way. The June highs are the next hurdle to overcome and will give investors another clue as to what lies ahead.
Investment Backdrop
JULY is in the books
After watching four of the first six months of the year turn in negative performances, July added a big positive to the ledger.
At the index level, the NASDAQ and the Russell led the way gaining 12% and 11% respectively. The S&P added 9% while the DJIA gained 6.6%. Consumer Discretionary (XLY) and Technology (XLK) scored wins of 18% and 13%. The semiconductors assisted the gains in tech with a 17% rally. Healthcare (XLV) was the laggard rising only 3%.
Small cap “growth” and “value” were just about even this month with a gain of ~10% each.
However, the year-to-date results still show plenty of RED. Every index is down double digits except the DJIA which has lost 9.6%. That pales in comparison to the NASDAQ’s loss of just over 20% in ’22.
August is upon us
We are now in the heart of the “dog days” of summer trading. That means trading desks operate with a skeleton crew. Many experienced traders already know it’s easy to press too hard and get whipsawed into losses during this typically slower period.
The S&P 500 is in the midst of its fourth ~10% oversold relief rally this year, up 12% from its mid-June lows. A positive development in the current bounce that differs from the previous ones is the selling doesn’t seem to have the same follow-through as it was earlier in the year.
While this is progress, there remain a multitude of headwinds for the market to move sustainably higher and the predominant trend is still downward for now. Technically, there have been some positives in the recent rally- but overall, I still need to see more positives before raising conviction that the recent lows can prove durable.
It’s interesting how similar the patterns of the major averages all look. We’ll soon find out if they will stay in sync and what direction they take next. The price action has been more constructive lately, but we have seen plenty of fakeouts during this BEAR market. Traders/investors may still, understandably, be a little tentative and quick to cut positions at the first sign of trouble.
I do see many stocks now finding some buyers on declines rather than entering free fall anytime selling emerges. That is consistent with my current thinking — that the market looks to want to test higher levels here in the near to-intermediate-term, but that we still need to be very vigilant for signs that stocks are fizzling out and the bear market trend is resuming.
Traders can play a bounce in any stock now, BUT it’s hard to recommend aggressively buying any stock in a Long Term downtrend. Aggressive investors/traders also have to be nimble if they play ANY short-term momentum situations.
This DIP, (some call it a recession) in economic activity is already priced in and LONG TERM investors (multi-year timeframes) should start to be more interested in slowly building positions. The trajectory of inflation and the economy will dictate what comes next for the markets. At the moment stocks are signaling a pause in the “negative” news.
Thank you for reading this analysis. If you enjoyed this article so far, this next section provides a quick taste of what members of my marketplace service receive in DAILY updates. If you find these weekly articles useful, you may want to join a community of SAVVY Investors that have discovered “how the market works”.
The 2022 Playbook is now “Lean and Mean”
Opportunities are condensed in Energy, Commodities, and Healthcare. Along with that I’ve defined Bearish to Bullish reversals in three other areas of the market that have led to massive gains (30+%) in the last 6 weeks. The message to clients and members of my service has been the same. Stay with what is working.
Each week I revisit the “canary message” which served as a warning for the economy. The focus was on the Financials, Transports, Semiconductors, and Small Caps. I used them as a “tell” for what direction the economy was headed to help forge a near-term strategy. With the major indices showing some signs of stabilization, it might be a signal that is now lining up with the “consensus” view of a “mild recession”.
I’m not there yet but if the price action tells me that, I will gladly reconsider my forecast.
Small Caps
The Russell 200 small cap index as measured by the IWM continues its sideways trading pattern, hovering just above key support levels. As the July results have shown this group outperformed the other indices. Another “potential” signal suggests the economy may stop sliding lower.
Sectors
Energy
Last week I highlighted what I deemed an overreaction that took place in the energy stocks.
Cash is King, and the ENERGY companies, especially the Majors (CVX, XOM, etc.) are flush with it. They are in excellent shape for any expected downturn.
With regulatory risk and recession concerns, the large integrated Energy companies have seen a steep ~20% sell-off since early June — performing just a tad better than the whole energy sector (as should be expected).
The administration and Congress continue to call for windfall profit taxes, export limits, a gas tax holiday, and activation of the Defense Production Act — all while asking for increased production. The uncertain backdrop continues to get worse with the ever-present probability of more policy mistakes. Additionally, commentary from economists and Federal Reserve members have raised concerns over a ‘hard-landing’ and a global recession. While the whole energy sector trades with sensitivity to the economic cycle, this industry has taken significant steps to vastly improve balance sheets from the depths of COVID. Their business models are resilient showing their ability to return cash through the cycle.
Both Net Debt to Capital and Debt/EBITDA ratios are lower than pre-COVID levels, and there has been a material shift in reducing operating costs, generating cash, increasing cash reserves, paying down debt, and returning excess cash to shareholders. With the way 2022 is shaping up, so far, balance sheets will be meaningfully under-levered by year-end which will allow for shareholder returns to ramp even more in 2023+, all while valuations are at/below cyclical bottoms.
With energy stocks down ~20% or more since early June, while oil & nat gas prices staying firm given the political uncertainty in Europe and the lack of OPEC spare capacity, the risk/reward looks quite attractive.
The US Majors are trading at 4x ‘23 EBITDA estimates (vs. historical EBITDA multiples of 5-6x). While there has undoubtedly been a knee-jerk reaction in recent weeks to regulatory and recession concerns, I believe the major players and the cash-rich E&P companies in this sector are ready to persist through an economic downturn. During this period they will continue to increase shareholder returns and as I screen current valuations they are very attractive.
Natural Gas
Drought could reduce California hydrogeneration by ~50% vs. the 10-year average. Given the current dynamics, unless we see a drastic reversal in drought conditions, California’s hydroelectric generation is unlikely to recover much, if at all, from 2021’s depressed levels. What will fill in the gap? We can use historical trends as a guide, which compares a robust 2019 generation mix to the 2021 drought year. While renewables like wind/solar methodically take share in applications where it makes sense (i.e., those that tolerate intermittency and/or have adequate storage backup), the bulk of the decline in hydro was generally made up for with natural gas.
Like hydro, natural gas is dispatchable (i.e., it can be turned “on” and “off” so to speak). As such, when we consider changes to hydroelectric generation, natural gas is assumed to be the replacement fuel.
Oregon is potentially the bigger wildcard for U.S. natural gas since its hydro generation is twice as large as that of California. While the overall severity of this past year’s Oregon drought is perhaps the worst of the past decade, it has not been geographically uniform. That adds a wild card to the situation, BUT Oregon’s hydroelectric generation for 2022 is well below normal levels
Connecting this to the broader discussion of U.S. gas prices and gas-related equities, I’m not suggesting buying stocks because of U.S. drought risks, but it adds to the overall U.S. natural gas price risk/reward remaining compelling, especially after the recent selloff. Any drought risk only adds to that story.
When I add this to the story being presented by the global energy crisis, it’s a compelling situation, on which I have recommended being overweight this year. I recently highlighted the Liquefied natural gas industry and the opportunities presented there. Numerous companies remain in long-term uptrends and are a way to get exposure to the natural gas sector.
Financials
It has been a long time since there was any real interest in the Financials. The sector hasn’t been overbought in well over 110+ trading days which is the longest streak since the Financial Crisis and ranks as the sixth longest since 1989.
That streak has now been broken as the Financial ETF (XLF) followed the general market and like the indices closed above the first resistance levels.
Once the market turned, the “SHORT” position (using PUT options) that was added recently in select Fintech names was closed out with a decent gain.
Homebuilders
With rates rising and affordability increasingly becoming an issue, housing has already started to weaken, and recent data reports on the sector weren’t encouraging. June’s report on Building Permits and Housing Starts was more of a mixed bag with the former slightly beating forecasts while the latter slightly missed. While Housing Starts were weaker than expected. Housing Starts are a key metric to track in terms of gauging the health of the overall economy. Before every recession since the late 1960s, Housing Starts started to roll over well in advance of upcoming recessions.
At this point in the cycle, we have yet to see a meaningful pullback in the moving average. So that is encouraging, and as noted recently, negative reports in the sector didn’t affect the Homebuilder ETF (XHB). Its rally continued and it stands at 20% off the June lows. That indicates two things. BAD data is now being dismissed, as most of this situation is “known”, and BEAR market rallies can occur at any time in any sector.
Trying to time and play these rallies is next to impossible, and why BEAR markets are so tough to navigate. I’m inclined to stay away from the sector and let others do some bottom fishing.
Commodities
I’m still holding my positions in Uranium. URA, URNM, and SII all have been disappointing lately but I continue to own and buy more during weakness. If anything, the investment case for this commodity has gotten even better in the past few months as nuclear power has started to become a more viable option once again to help solve the global energy crisis.
Along with other commodities, it has pulled back in recent months. However, the Sprott Physical Uranium Trust (OTCPK:SRUUF) products that an investor can use to play the Uranium theme have been trading at heavy discounts to spot Uranium prices, often double-digit discounts.
Uranium became a very popular trade late last year and early this year, but the poor performance lately has hopefully resulted in most of the “Uranium Speculators” moving on to greener pastures. If that’s the case, it may finally be the time for these instruments to rally again. For me, though, this is a long-term investment that I am willing to give time and space to “work”. Also, note that both URA and URNM pay an annual special dividend that is well above the average market payout.
Healthcare
Not much of a change in the technical picture for the Healthcare ETF (XLV). The sideways trading pattern continues with the ETF in the middle of its recent range. Healthcare took a breather in July and underperformed the general market. The Sector remains a favorite using select pharma names that are paying dividends and possess good growth potential.
Biotech
This reversal pattern in the Biotech ETF (XBI) is still in play. The ETF ($81) held support and rallied 2% on Tuesday when the general market sold off. While there is still a lot of work to be done to make this BEAR to BULL pattern complete, a move above $96 would be another positive sign. A drop to the secondary support range at $74-75 is certainly possible after the big rally A break there would be a strong negative. The position is up 30% since mid-June.
Technology
Interest rates as measured by the 10-year treasury traded at 3.09% three weeks ago and closed at 2.67% on Friday. The headwind became a tailwind in the short term, and that added to the newfound enthusiasm for technology.
I continue to HOLD and selectively add to my CORE tech holdings during weakness. Alphabet (GOOG) is one of the most inexpensive stocks in the S&P and is recession-proof.
Semiconductors
I still consider semiconductors to be one of the most important groups in the market, and like the major averages, the Philadelphia Semiconductor Index (SOXX) managed to trade above its 50-Day moving average recently. However, breaks above the 50-Day MA for the ETF haven’t been a particularly bullish development so far in 2022.
Since the peak in late 2021, the SOX has staged three different rallies where it traded above its 50-Day MA, and in each of the prior two cases, it quickly reversed course to make new lows. This particular rally has lasted longer than the prior false moves. For now, the burden of proof is still on the bulls to break this trend of fake-out rallies. On a relative strength basis, semis have outperformed during the rally off the June lows, but the starting point of that rally was a 52-week low.
This is a “watch and wait” scenario now, and a good area to selectively sell upside calls against positions to collect some income.
ARK Innovation ETF (ARKK)
The ARK Innovation ETF (ARKK) is the other “BEAR to BULL” reversal that has worked out well. Resistance loomed “large” but so has support. At the moment it’s a narrow trading range and when that range is broken it will determine the next larger move.
This is also a good situation to sell upside calls against, as the premiums will bring in plenty of income to help offset any downside now.
Cryptocurrency
Equities were not the only assets to make a move back above their 50-Day moving averages this week. Major cryptos have also joined that club. Bitcoin (BTC-USD) ended a 99-day long streak below its 50-DMA; the longest such streak on record. Bitcoin traded up to the 24K range and teeters on the cusp of a ‘breakout’.
Final Thoughts
Remember all of the GDP forecasts for ’22 last December that called for 2-3% growth in the first half, followed by a robust rebound in the 3rd and 4th quarters? Remember the revised outlook that called for a slower economy in the first half of’22 followed by a return to a normal growth pattern in the second half?
I certainly remember, and I opined that all of those forecasts were wildly optimistic. The clues were there, but most analysts were buying into the “spin” and rhetoric. It was apparent in Q4 ’22 that the probability for a change in the anti-business backdrop in place since early ’21 was extremely LOW. During Q1 ’22 the handwriting was on the wall, as it was made very clear that this policy was cemented in place.
Therefore, it doesn’t take a Ph.D. in economics to figure out that the probability of a change in the trajectory of the economy is also extremely LOW. Fast forward to the start of this quarter, and lo and behold we have back-to-back quarters of negative GDP.
I don’t need to get into a debate as to whether this is a recession or not but the GDP results in the last 2 quarters were miserable. Especially when we see the precipitous drop-off in growth in such a short period. There is simply no way to sugarcoat the performance of the economy this year and it’s why the S&P and other indices are in BEAR markets. As it often does the stock market predicts the trajectory of the economy. We’ve seen a robust economy turn into a deficit in 18 months, and a BULL market high turned into a BEAR market in the same time frame.
The stock market will bottom before the economy and fundamentals, and IF this price action develops into a true bottoming process the economy should also follow and stumble along the bottom at depressed growth levels.
I cannot say it enough, this market setup is extremely difficult. There is NO BULL trend as a tailwind. Solid BULL setups are few and far between. These days, finding them is the difference between a GOOD year and a BAD year for an investor. The real trick is uncovering the setups that are in the process of “turning”.
I’ve made that a priority in the last 3 months and the returns have been excellent. Last February, the handwriting was on the wall and I labeled 2022 “A New Era of Investing”. As I write this, the equity market is trying to stabilize. The backdrop we are working with is a “Tax and Spend” mentality in a receding economy, with no change in energy policy forthcoming while interest rates are being raised due to high inflation.
It’s your move.
Postscript
Please allow me to take a moment and remind all of the readers of an important issue. I provide investment advice to clients and members of my marketplace service. Each week I strive to provide an investment backdrop that helps investors make their own decisions. In these types of forums, readers bring a host of situations and variables to the table when visiting these articles. Therefore it is impossible to pinpoint what may be right for each situation.
In different circumstances, I can determine each client’s situation/requirements and discuss issues with them when needed. That is impossible with readers of these articles. Therefore I will attempt to help form an opinion without crossing the line into specific advice. Please keep that in mind when forming your investment strategy.
Thanks to all of the readers that contribute to this forum to make these articles a better experience for everyone.
Best of Luck to Everyone!
Be the first to comment