

One moment it’s sunny. The next moment, storm clouds appear.. leolintang
“Investing is the intersection of economics and psychology.” – Seth Klarman
I’ve discussed the reasons why the global economy has gone from a growth pattern to the edge of a recession in record time. Since late last year, there has been plenty of pushback to those views.
Wolfe Research came out with their view of the global situation recently. They dint’ mince words as they feel the blame lies with;
“policymakers pursuing confusing, irrational and/or just plain bad economic policies.”
Anyone that wishes to lose their bias that was loaded with preconceived notions and be honest with themselves, can now see what I was referring to MONTHS ago.
Record Wealth Destruction
The Economic policies and associated Fed crusade against inflation this year have resulted in record destruction of wealth in dollar terms and an extremely large drawdown in percentage terms. From their peak, high-grade bonds have seen almost $3 trillion in market value erased which is a record in terms of both dollars and percentages. Equities, meanwhile have erased nearly $13 trillion in market cap which exceeds any other drawdown in dollar terms, but in percentage terms is well short of the declines seen during the COVID crash, the Financial Crisis, the dotcom bust, and the 1987 crash. The S&P 500 has now experienced three consecutive quarters of losses for the first time since 2008-2009.
On a combined basis, the total drawdown in the market value of the bond and stock markets comes in at just shy of $16 trillion or just over 20%. Declines of this magnitude are of course associated with economic downturns and they are confirming the state of the poor economy today.
As if equity market returns weren’t dismal, keep in mind that once you take the impact of inflation into account, investors are actually now solidly in the red. The charts below show the performance of the S&P 500 and Nasdaq on an inflation-adjusted basis by adjusting historical prices based on headline CPI.
Inflation Adjusted Stock returns (www.bespokepremium.com)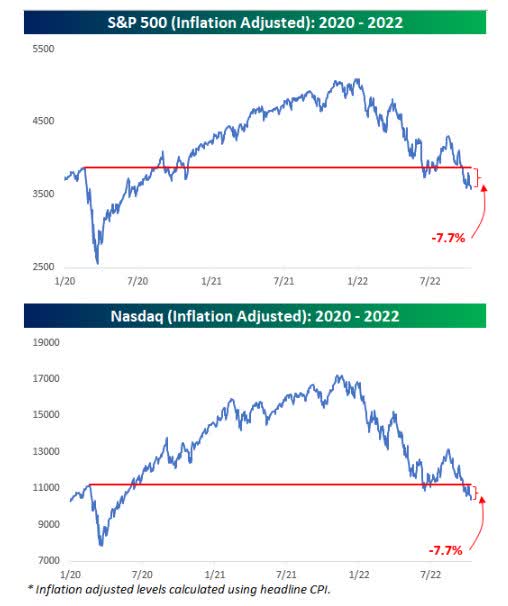
After adjustments, the S&P 500 and Nasdaq are both down 7.7% from their February 2020 highs. As bad as the investing backdrop has been for equities, long-term US Treasuries have fared much worse than that. On a nominal basis, long-term US Treasuries have declined 28%, and after adjusting for inflation, the declines have been well over 30%. What’s worse is that these numbers only take into account the bond and stock markets.
Residential housing prices have only just started to roll over, and for many Americans, their home makes up the largest percentage of their wealth. The wealth destruction will continue to have far-reaching effects as the economy remains in a slow/no growth mode.
The Fed
The increase in the terminal rate (e.g., peak rate) forecasts for 2022 and 2023 from 3.4% and 3.8% to 4.4% and 4.6% respectively have startled investors. However, the folks that are so surprised have not been listening to the message that has been part of the commentary since the beginning of the year. As long as inflation remains relatively high the FED stays involved in the economy. These adjustments not only signaled that rates will move well into restrictive territory, but that they would remain higher for longer. Currently, the futures market shows a slight probability (7%) of the peak rate approaching5%—a level not seen since 2007. If inflation stays elevated that view remains on the table.
The latest news on Inflation continues to show a troubling situation. It seems to be surprising for some, but I’ve forecast this situation correctly. Inflation stays elevated for MUCH longer than analysts and pundits are suggesting. I’m hearing analysts using the “peak inflation” slogan. Let me repeat the message. It’s not about “peak”, it’s about how long Inflation stays elevated at higher than normal levels.
The Market
The equity market is forward-looking, but this backdrop is like a bowl of jello, and it’s tough to figure out what issue emerges next to change the scene. We’ve seen rallies with strong breadth turn into a selloff in a matter of days. One day the sun is shining and the next day it is a torrential downpour. Therefore, the recent weakness is largely driven by the realization that the economy was not already but will soon be in the midst of a recession. What could lead to a turnaround? Beyond inflation decelerating and allowing the Fed to ease hikes, the market needs better-than-feared earnings for the upcoming third-quarter earnings season. There is also the chance that positive seasonal trends that revolve around the Mid-term elections will be a catalyst for a rebound rally.
At the moment there is not enough evidence to believe any of these items will cause a complete reversal in the BEAR trend. As I’ve mentioned in past missives we cannot HOPE that the scene will improve, we have to actually see results. We have to see “policy change”. The stock market will start to show signs of a bottoming well before the economy does and will turn before economic data improves. Since the market is still searching for a bottom we are a long way from any turning point, just as we are a long way from seeing any change in policy.
In the interim, with yields at multi-year highs, investors are no longer in an environment where “there is no alternative” to equities. Yields are at attractive levels for the first time in years and that is going to keep investors on the sidelines to avoid risk. I’ve added more money to short-term income instruments in the last two months than I have in the last 7-8 years. I’m not looking to be a HERO. Instead, it’s about taking advantage of this development with short-dated maturities that will add some income and keep your liquidity high.
The Bears are still in Control
We’ve discussed this fact before, but it’s worth repeating. On average, recessionary bear markets have historically contracted 33%. The S&P is already declined ~24%. Timing an absolute bottom is extremely difficult when uncertainty and volatility run high.
Strategas Research;
“The flush in breadth recently is as bad as anything has seen since the fall of 2009 and August 2011. Neither marked the final low, with short-term bounces giving way to lower lows in following months.
However, there are positives that tell me the situation may not morph into a complete debacle.
U.S. corporate balance sheets are in excellent shape. Corporate cash flow to GDP is at 13.5%—only slightly below its post-war high of 14%. The ratio of U.S. corporate debt to after-tax profits is as low today as it was in the 1960s. We will soon get more clues as to how well margins—and guidance—fare.
We have discussed this point many times. Households are in good shape, too. The household debt to personal-income ratio is at early 2000s levels, and the debt-service ratio is lower than at any time prior to the pandemic. Right now, cash represents about 25% of total household debt—the highest level since 1970.
Those stats should help corporations and households survive a “typical” recession. It is the “atypical”, Long and Deep recession that I fear remains a distinct probability. In a BEAR market, positives are thrown to the side while the negatives are highlighted. Investors need to understand and get familiar with this backdrop, it may be here for a while.
The Week On Wall Street
Investors entered the week looking at a landscape filled with headline uncertainty (CPI and the start of EPS season). The indices started Monday looking to break a 3-day losing streak. Unfortunately, that wasn’t to be as the S&P fell for the fourth straight day losing 0.76%. All of the other indices felt what was a Tech-led selloff. At the closing bell, the NASDAQ and the Tech ETF (XLK) set new intraday and CLOSING lows. Semiconductors as measured by (SOXX) broke to new CLOSING lows as well.
More back-and-forth trading in the next two days left the S&P and NASDAQ mired in a six-day losing streak. The S&P, NASDAQ, the Tech ETF, and the NASDAQ 100 all set new closing lows on Wednesday.
At the open on Thursday the selloff took off like a rocket and then exploded as soon as it reached light speed. The sellers became exhausted and the BULLS returned to the pits and took the S&P from a 70+ point loss to a 100+ point gain. As trading on Friday rolled around, the overnight sleep refreshed the BEARS as they returned in force to take the S&P down 85 points.
It was a wild week. On Tuesday the S&P closed at 3588, when the dust settled on Friday the S&P was at 3583. In the interim, the index traded as low as 3491 and as high as 3712. Investors that weren’t buckled in got jettisoned off this roller coaster and found themselves on the ground looking up wondering what the heck happened. All of the major indices set new BEAR market lows this week. The S&P 500 and the NASDAQ Composite have now lost ground in seven of the last nine weeks, as the BEAR market rolls on.
The Economy
The monthly look at small business sentiment from the NFIB came in slightly higher than expected (92.1 vs 91.6) and increased slightly relative to August’s reading. This was the ninth consecutive month below the 48-year average of 98. Thirty percent of owners reported that inflation was their single most important problem in operating their business.
Inflation
Headline PPI (Producer Price Index) came in at 0.4% versus forecasts for an increase of 0.2%. Core PPI was in line with forecasts at 0.3%. On a y/y basis, the headline reading came in at 8.5% versus forecasts for an increase of 8.4%. Y/Y Core PPI was actually slightly weaker than expected at 7.2% versus forecasts for 7.3%.
Inflation – Part Two
September CPI increased 0.4% and the core rose 0.6%, again stronger than expected results. Consumer prices were up 0.1% and 0.6%, respectively, in August. The 12-month headline rate dipped fractionally to 8.2% y/y versus 8.3% y/y previously and compares to the 9.1% y/y four-decade high from June. The core rate picked up to 6.6% y/y from August’s 6.3% y/y and makes a new high 40-year peak, beating the prior high of 6.5% seen in March.
My message has been clear. Inflation will remain an issue because of ENERGY costs. How is inflation going to moderate to a point of being considered normal with ENERGY costs at these levels? Energy input in everyday costs is EVERYWHERE. No matter what one wants to believe, this situation doesn’t turn around until energy policy does. Period, end of the debate.
Investors need to lose their political views and their green energy views and realize what is a fact. This FACT is going to impact economies and markets for a VERY long time. The longer the word Green is in “policy”, the longer the word recession remains in the narrative. I am not anti-green energy, I am anti-recession, and the way this “change” has been carried out, the two can’t be separated.
The US Dollar
The US dollar is a significant influence on underlying equity market performance. Through global volatility, the US dollar has experienced strong appreciation this year. While it can certainly continue higher, everyone can see that its slope is becoming very steep as the currency gets stretched to the upside.
US Dollar (www.tradingview.com/symbols/TVC-DXY/)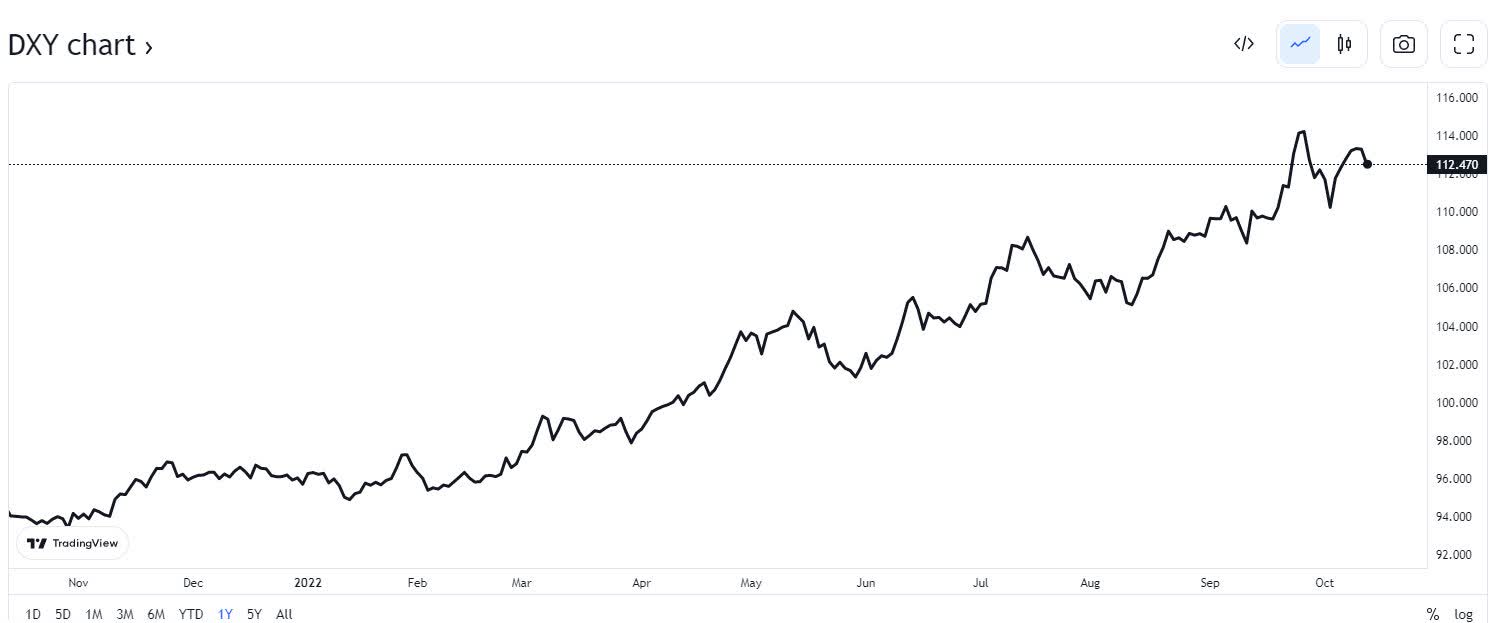
Investor positioning has become very “Long” the Dollar. While many contrarian signals have not worked as well this year, this rally looks ready for a pause. If the US dollar does start to pull back, it has the ability to add support to equity markets and ease some of the pressure on companies operating globally. It is just one factor that can help stabilize the markets. We witnessed a quick drop on Thursday and that could have been a catalyst for the big reversal we witnessed.
Consumer
Retail sales were unchanged in September 2022, missing market expectations of a 0.2 percent advance, as high inflation, and rising borrowing costs hit consumer demand.
October Michigan consumer sentiment index comes in at 59.8, versus a consensus expectation of 58.8.
Univ. Michigan Sentiment (www.sca.isr.umich.edu/)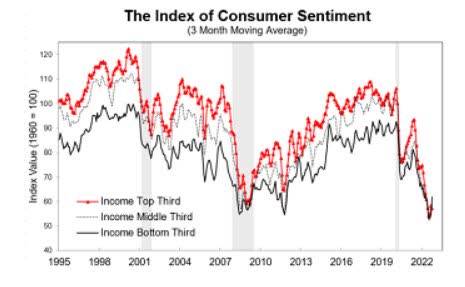
Despite the small bump in sentiment, the chart reflects the poor mood that remains near historic lows.
The Global Scene
The IMF cut its global forecast to 2.7% for 2023 and says “it will feel like a recession” for some. If China cannot rebound from its COVID malaise, this forecast is way too optimistic.
S&P Global’s Purchasing Manager Index for the Chinese Services industry was released over the weekend. The results were poor, driven almost entirely by disruptions and demand pattern shifts driven by COVID and the Chinese government’s response to the virus. As shown below, the result was a decline into contraction for the Services index as well as a drop in the output-weighted measure of total sales across goods and services.
CHINA services PMI (www.bespokepremium.com)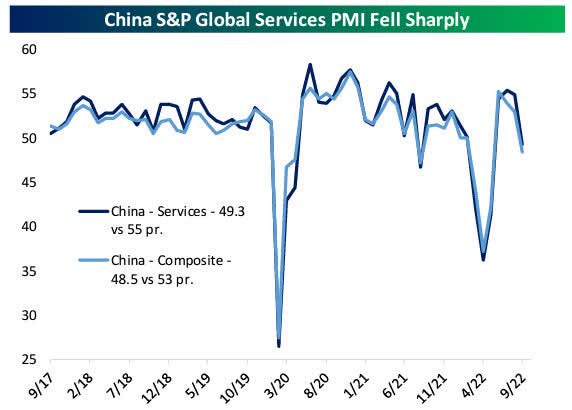
This is another data point adding more uncertainty to the Global economic picture. If China can’t stabilize and help boost the Global economy then it’s going to be a difficult road ahead for the EU and the US.
Political Scene
With a month to go until the midterm elections, races have tightened, and the uncertainty of the outcome has increased. Our expectations remain that Republicans are well-positioned to win a majority in the House. In the Senate, the majority likely comes down to the outcomes in PA, NV, and GA—with the winner of at least two of these three seats likely to win the majority. Overall, the national mood (as measured by ‘right track vs. wrong track’) continues to show high levels of voters viewing the country on the ‘wrong track,’ which historically has been a drag on the party in power (Democrats).
However, recent special elections (where Democrats have done better than expected) and the nomination of several untested candidates for Republicans in Senate races adds to the uncertainty of the outcome. From a market perspective, history shows a positive post-election period. This is a pattern EVERYONE is expecting to see repeated, especially if the elections produce a divided government.
If that does indeed occur there is a possibility for a relief rally. The stock market will likely celebrate any hint of relief from the anti-business jihad that has been waged in the last 18 months.
Earnings
In the chart below we see the number of US earnings reports per day over the next few months. As shown, the number of stocks reporting results starts rising over this week before peaking in the first week of November.
EARNINGS Season (www.bespokepremium.com)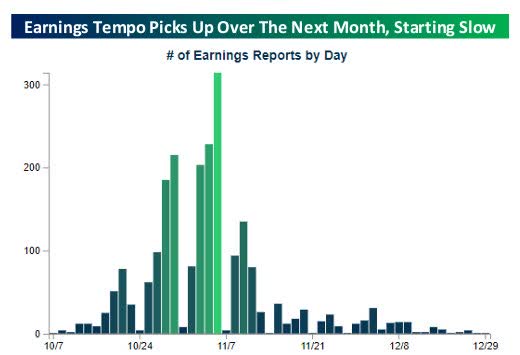
This week only a few companies per day were set to report, but at the peak, it will exceed 300. In the table below we see the S&P 500 members scheduled to report this week. Banks are always among the first major companies to report, and that’s true this season as well.
The initial Financial EPS reports were basically better than expected across the board.
Bespoke Investment Group;
The rolling 3-month EPS beat rates for all US companies stand at 66%. EPS beat rates have slowed markedly from their strongest post-COVID recession levels, but they’re still very high relative to the long-term average of 59%.
The same is true for sales, which is actually delivering a higher beat rate (68% vs. an average of 56%) than earnings thanks to the inflationary environment.
Similar to last quarter the focus will be on guidance and the commentary offered on the earnings calls.
Buckle Up.
Food For Thought
It’s very obvious. Every individual stepping up to a microphone and promoting the green agenda is oblivious to the issues. These individuals wreak hypocrisy. Unfortunately, their hypocrisy is the root cause of the upcoming global recession. The economies of major developed nations are about to feel the wrath of absent-minded absurd politics that refuse to acknowledge reality.
Renewable energy advocates generally believe the United States and others should use renewable energy sources like wind and solar to generate electricity and stop using fossil fuels like coal and natural gas for our energy needs.
A single wind turbine can contain 335 tons of steel, 4.7 tons of copper, 3 tons of aluminum, and 700-plus pounds of rare earth minerals. In fact, wind and solar energy use more copper than conventional forms of energy, such as coal, natural gas, and nuclear power plants.
Many of these same people also oppose the proposed copper and nickel mines in Northern Minnesota. This isn’t the ONLY example. This hypocrisy is found in EVERY aspect of the green movement. The people who champion renewable energy, but oppose “mining” the natural resources in Minnesota or elsewhere need to reconcile the inherent contradictions in their positions.
The cost of wind power today is not competitive as it costs nearly 6 cents more per KWH. To put that in context, a new wind plant could at least cost 50 percent more per KWH to produce electricity. As the demand for more and more copper increases the cost, Wind power becomes less competitive than conventional power sources. The greenies sigh and say we simply will have to bear the cost. Really? Then sit back and think what that does to economies around the world.
Green has Consequences
Another warning regarding energy supply, this time from the UK. As winter rolls in they are forecasting 3-hour blackouts. Similar to the U.S. the UK has vast untapped reserves that go unused because of a failed energy policy. This self-inflicted problem isn’t going away, it will only exacerbate economic pain. Economies won’t turn around until we see a radical change in energy policies. This isn’t about politics. It isn’t about Green vs Fossil fuels. It’s all about the economic destruction that will play out until an ALL inclusive energy policy is adopted.
Sentiment
The Daily chart of the S&P 500 (SPY)
Another decline this week set more new lows for the S&P and the other major indices. Perhaps the S&P found some solid footing this week when it barely dipped below the 3500 level before rebounding.
Investment Backdrop
Investor sentiment has been pretty negative all year and stocks kept going lower. Sentiment readings were also on the bearish side for much of the prior bear markets in the early 2000s and then in 2007-2009. Bear markets don’t typically end just because everyone is negative; they end when everyone is apathetic. Major lows in bear markets often form only when most have stopped looking for them after being burned to try to bottom pick unsuccessfully time after time.
Therefore, I don’t like the fact that at the moment so many people still seem to be trying to call a bottom. There are a couple of catalysts that can change the scene such as a better-than-expected EPS season, and as mentioned the Midterm elections. Those issues combined with stretched oversold conditions may help produce a bounce. But in a BEAR market, positioning for a bounce is playing against the trend. That said, one sign that maybe we have entered the more mature stage of this downturn is that the former “generals” (AAPL), (AMZN), (GOOG), (MSFT), (NVDA), etc. are now taking their turn getting hit hard and leading the market lower.
There are many technical and fundamental crosscurrents that will have an impact on where the stock market goes in the near term. I review this data in my DAILY updates to members of my service in an effort to stay one step ahead during these turbulent markets.
Thank you for reading this analysis. If you enjoyed this article so far, this next section provides a quick taste of what members of my marketplace service receive in DAILY updates. If you find these weekly articles useful, you may want to join a community of SAVVY Investors that have discovered “how the market works”.
The 2022 Playbook is now “Lean and Mean”
If a stock isn’t in the Energy, sector, then it is in a BEAR market trend. That leaves investors looking for near-term “long” opportunities with a very limited playing field.
Savvy investors have expanded the playing field. They benefited from the use of the Index and select sector Inverse ETFs during the recent decline, piling up double-digit gains in the last 2 weeks ranging from 15%-30%.
Growth vs. Value
Analysts are happy to tell investors that “Value” has led “Growth stocks” coming out of bear markets. It happened both in the early 2000s and then again in the early days of 2009-2010 after the Global Financial Crisis. That’s wonderful but there are NO signs anywhere that we are coming out of a BEAR market.
It is a sign that the speculative excesses which always mark the end of bull markets are beginning to heal. Investors may finally start to put a premium on fundamentals and valuation, particularly based on free cash flow rather than “questionable” earnings. There are a lot of stocks that are now very “cheap” on a Free Cash Flow basis. That doesn’t mean they have to go higher, but these are the kinds of companies (Energy stocks) I would rather own going forward than the unprofitable high-growth names that were reliant on perpetual 0% interest rates to have any value.
“Value” areas should ultimately lead us out of this quagmire before “Growth” eventually takes back the lead well into the next bull market. I’ll remind everyone that could be a LONG winding road before that destination is eventually reached. Another aspect of this “new environment” is what we have seen this year. Sentiment readings may not be as helpful as they have been. That takes another tool out of the contrarian’s toolbox, adding more difficulty to this market environment.
Sectors
During the trading day on Friday, I noted that Consumer Discretionary is leading all sectors to the downside in October with a 5% loss. Energy show an 11.5% gain for the month followed by Financials (XLF) and Healthcare (XLV) with gains of 2% and 2.3% respectively.
Energy
The decision by OPEC+ to cut production by 2 million BPD marks easily the strongest such move since the earliest days of the COVID pandemic in the spring of 2020. In practical terms, because of how quotas are calculated, the “real” cut is about half as much, or 1% of global supply. However, the move strengthens the case for energy “projects” permitting reforms in the U.S. to advance “energy independence” objectives. The examples are everywhere and the lesson should have been learned (again). Energy security needs to become a more urgent topic in the U.S. and Europe. Instead, it has taken a back seat here in the U.S.
The Biden administration has also signaled it will continue to release oil reserves from the Strategic Petroleum Reserve (SPR) to combat the expected increase in gas prices from a cut to the global oil supply. SPR levels already being the lowest in decades should further drive focus on domestic energy reforms to boost production and counter price increases, especially with sensitivity on energy prices rising ahead of midterm elections. Potential purchases to refill the SPR should also be watched as a factor that could boost oil prices if the Biden administration moves to replenish the stockpile after its volumes fell last month to the lowest level since 1984. It’s apparent the administration is aware that “supply” is a factor in energy pricing with their decisions to use the SPR to boost supply. However, the New Green Deal dictates that fossil fuel production needs to be phased out leaving higher energy costs in place for the foreseeable future.
Bottom line: There are catalysts that could drive oil prices in the near term. Perhaps the midterm elections will have an impact on the present anti-fossil fuels mindset. However, I doubt we see a complete reversal and the fact that at some point the SPR has to be replenished will take more supply off the market. But the biggest impact will be felt if a long-drawn-out global recession occurs. Ironically, cheap energy will arrive, but it will come at a HIGH cost to the economy.
I believe the Saudis have recognized the implications of a deep global recession, and do not want to enter that scene with the world awash in oil. Energy (XLE) has led all year and it entered trading this week after posting a 13.6% rally in the prior week. The ETF finished down 1.9% for the week.
The XLE is at resistance as it now encounters the August/September highs which could mean it is due for a pause. Energy has carved out a nice trading range and as long as the near-term uptrend isn’t broken, it’s a sector where weakness should be bought. My message hasn’t changed. If you stay with the large cash flow dividend names, it will help cushion any downside and add income along the way.
Natural Gas
The Nat Gas ETF (UNG) is tight roping the support trend line represented by its 200-day Moving average. It will be important for this level to HOLD so that the intermediate uptrend is not disturbed. Like the oil group, the ETF is still in a long-term BULL trend.
Financials
Other than a late-week bounce that left the Sector (XLF) at a resistance level, the Bearish downtrend remains. I continue to hold the long-term CORE banks, but don’t see any reason to add to them at this point.
Commodities
The sector (BCI) has been struggling to hang on to its BULL trend and with the dollar declining and inflation entrenched, the group rallied for the second week in a row.
Healthcare
Healthcare (XLV) is back at the bottom of a trading range that has been in place all year. With this recent weakness, the sector has broken back into a long-term BEAR market trend. A small consolation for owners of the sector in September. The group did “outperform” last month as it lost less ground than the major averages and most of the other sectors.
Big Cap dividend-paying Pharma continues to be the place to be. The majority of these names remain in a BULL market trend.
Biotech
This group (XBI) ($80) has outperformed the major indices since May, but the dominant trend is still down. The BEAR to BULL reversal is still an active pattern and we will soon know if this short-term reversal continues.
XBI has put in a series of higher lows since mid-year, but it is now facing a contingent of resistance levels that will tell us what is next for the group. A break below the September low at $75 would be a sign that resistance is formidable and a complete retest of the May lows might come next. On the flip side renewed interest in this group could bring it back to test the old highs at $90+.
Technology
The NASDAQ, NASDAQ 100, and The Tech sector ETF (XLK) all posted new BEAR market lows this week before staging a reflex rally. It remains to be seen if these are durable lows or if there is more to come on the downside.
Semiconductors Sub-Sector
Similar to the major indices it’s in a BEAR market trend and forged new lows before Thursday’s reversal halted that decline. It has been one of the best “shorts”, using inverse ETFs, producing the largest gains for members of my service. I am currently re-assessing the short-term situation for the group and will update members on Sunday during my weekend chart review.
Utilities
It’s official, another sector has succumbed to the BEAR and left the ranks of sectors in a Bull market trend. You know when conditions are starting to get worse when the most defensive sectors (former leaders) of the market start to fall apart. Less than a month ago, the S&P 500 Utility (XLU) sector hit a record high. That makes this recent selloff so amazing. On Friday, October 7th it was close to a 52-week low. In doing so the Utility sector is no longer in a Bull trend. That leaves Energy as the only sector in an uptrend.
ARK Innovation ETF
I’ve said it quite a few times during the recent outperformance trend of the ARK Innovation ETF (ARKK), It’s make-or-break time. What was once a series of higher lows since May has now turned to a series of lower highs since ARKK peaked in August. More importantly, the ETF dropped to new lows this past week. If this breakdown is genuine it could signal that yet another leg of this Bear trend is underway and the reversal pattern is nullified.
Cryptocurrency
Bitcoin is little changed in the past week as risk assets have erased a large portion of earlier gains. Bitcoin’s decline in the past few sessions has resulted in a rejection of its 50-Day moving average.
Bitcoin (www.bespokepremium.com)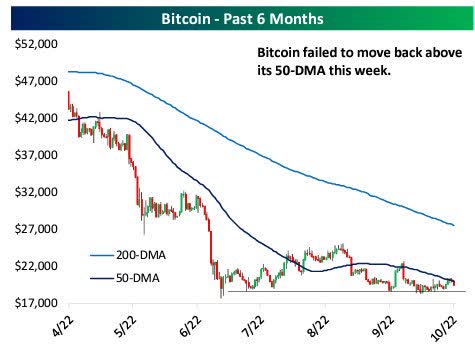
While the S&P 500 has gone on to make new lows recently, Bitcoin has been remarkably flat (in a range between roughly $17.5K and $25K) following the collapse in prices this past spring. So like everything else, mixed signals on where BTC may be headed next.
Final Thoughts
Stock market analysts and pundits are still trying to guess when the Fed will pause this interest rate hiking cycle. Hard landing, soft landing? Economists and market analysts really have to be joking with this waste of time commentary. Let’s start dealing with reality. Inflation is more than “sticky”, the Fed is in the picture for a long time, and stocks are reminding everyone of the poor fundamentals because they are in a bear market trend. With the S&P down 25%, and the NASDAQ down 34% we’ve had a Hard landing and there is no guarantee we didn’t land in a swamp.
The Soft/Hard landing talk then kicks off a discussion about a market bottom. I wish them the best of luck with all of that. Trying to do the same things that worked so well for most of the past decade has been an exercise in futility this year. For anyone that tried that approach, it’s likely led to large losses even more so than the indices reflect. It’s because this is a Bear Market and must be treated as such. We also have to face the fact that we will remain in a bear market until the balance of evidence suggests otherwise. Trying to “play” it any other way will lead to larger losses.
Time and time again, I’ve told members of my service who are “active” investors, to Forget about missing out. Forget about the exact bottom. Play this trend. When the next bull market arrives there will be boatloads of money to be made. The goal is to survive and get to that next bull with most of your money intact. This market still has a lot to prove before we can assume we’re out of what I dubbed the “new environment”. Ironically this backdrop is no longer so new, and I believe it has the wherewithal to stay in place for a long time.
The die was cast when this New Green Deal energy policy was enacted, and it has been downhill ever since. Every chance to change that stance went by the wayside. Instead, decisions were made that exacerbated the problem. This inflationary recession-like economic situation should be no surprise. All of the signals were there and anyone listening to the “spin”, letting their “Bias” dictate their decision-making is roadkill.
These are the cards investors were dealt, and I intend to play this hand to the max until I see a material change take place.
Postscript
Please allow me to take a moment and remind all of the readers of an important issue. I provide investment advice to clients and members of my marketplace service. Each week I strive to provide an investment backdrop that helps investors make their own decisions. In these types of forums, readers bring a host of situations and variables to the table when visiting these articles. Therefore it is impossible to pinpoint what may be right for each situation.
In different circumstances, I can determine each client’s personal situation/requirements and discuss issues with them when needed. That is impossible for readers of these articles. Therefore I will attempt to help form an opinion without crossing the line into specific advice. Please keep that in mind when forming your investment strategy.
Thanks to all of the readers that contribute to this forum to make these articles a better experience for everyone.
Best of Luck to Everyone!
Be the first to comment