


Juanmonino
“There is nothing government can give you that it hasn’t taken from you in the first place.” – Winston Churchill
I decided to take a quick reprieve from the usual MACRO view commentary and as market participants reflect on all we are grateful for. From an investor’s perspective, this year’s bear market will certainly not make this list. But even though it has been a challenging year performance-wise, let’s take a look at a few financial market blessings that made up this “mixed bag” of issues.
This time last year, the worst wave of COVID yet was just around the corner. Now, mitigation efforts, vaccines, and less severe strains are allowing most of us to gather in person for the first time since the pandemic began. While cases may rise during the colder months, the days of shutdowns and restrictions are hopefully behind us. That is worth celebrating and will help in balancing the scales that are overweight with economic negatives.
TSA screenings, restaurant bookings, and hotel occupancies recovered, and services spending became a significant contribution to helping stabilize a lackluster economy. In the Post-covid world, the desire to be out and about is still strong, and this was confirmed by many CEOs in the services sector during the Q3’22 earnings season.
People returned to work, keeping the labor market stable. Healthy employment dynamics will be challenged in the coming year but this is one factor that could limit the severity of the anticipated recession.
After analysts called for “Peak Inflation” all year, the latest CPI/PPI nay finally gives these calls some credence. The supply chain backups are healing, retailers are discounting, and even rents are moving lower. It has been a slow process and I expect inflation will continue to stick around and plague the economy.
October’s Core CPI reading of 0.27% month over month was the lowest in a year, providing some relief from the very elevated ~0.5% average that has persisted recently. But it will take sustained readings below 0.3% m/m for the Fed to get more comfortable. The 0.0-0.3% range was the norm for about 20 years pre-Covid, and it will have to retreat to that level. Investors will need to see this transpire to gain clarity on the outlook. This will take time, and the data may be volatile. The Fed, and therefore the market, will remain very data-dependent on the incoming data flow.
Earlier this year, the national average gasoline price per gallon breached $5 for the first time. This sharp increase was bad not only for inflation but also for consumers’ pockets. Fortunately, the price has since declined over $1.25 per gallon-providing some relief. Whether or not this price drop is enough to stabilize low-income household budgets remains to be seen. It will also be important that they will stay at these levels or lower.
As far as the FED;
“They really only have two options left at this point. 1) Hike rates into a slowing economy to curb inflation … threatening a recession. 2) Ease up on the rate hikes and let inflation get even worse threatening hyperinflation.”
I think there is yet another option. How about this: Inflation slows to a more normalized level but does not go away (hyperinflation is not on the cards in my opinion). The economy slows but still maintains a very slow growth profile. Interest rates rise a touch more but not enough to choke off the economy as GDP grows around 1%-2%, which allows earnings to stabilize, with pockets of expansion.
In such an environment price earnings multiples expand, socks stabilize and settle into a trading range. How much higher from here is a fair question, so like all of the other issues, we’ll just have to wait and see if the festive scene unfolds.
Investors now have an alternative. After years of low-interest rates, bond yields are at attractive levels. In fact, at ~6%, high-quality corporate bond yields are near the highest level since 2009. Short-term risk-free CDs are offering 4+% as well. That is competition for equities but in this risk-averse environment, it’s a welcome development.
Investors are most grateful for this development in ’22. Dividends are expected to hit a record high this year, and buybacks have already reached an annual high-and the year isn’t even over. Buybacks are on pace to exceed $1 trillion for the first time. Much of this is attributable to the Energy sector which is rewarding investors by sharing their Cash Flow proceeds.
- The prospects for holiday cheer
There have been few places for investors to hide this year, but if it brings any comfort, the year may end on a better note as the S&P 500 has tended to close the year strong. In fact, from November 15 to December 31, the Index has rallied ~2% on average and has been positive for both nine of the last ten years and 17 of the last 20. That would be a sweet way to end an otherwise challenging year.
The S&P 500 rallied ~14% from the intraday lows in mid-October, underpinned by better-than-expected inflationary reports recently. The better inflationary data resulted in lower bond yields and renewed interest in equity markets – with a clear rotation from this year’s winners into the biggest laggards. For example, some of the more Consumer and Technology-oriented areas garnered the most buying attention, while some of the more defensive areas were relatively flat.
This type of action provides a glimpse of what will transpire over time, as the market eventually turns out of the current bear market. However, the timing of that transition is still a huge unknown. Risk tolerance will be important because the areas that have renewed interest now will also likely underperform in another down-leg for the market.
While the better inflation data and underlying technical improvement are encouraging, I expect more time and challenges ahead before equities can show any durable upside. I do believe the Fed will reduce its pace of hikes in December to 50 basis points. However, the Fed is still in tightening mode and inflation may take time to show definitive evidence that it is indeed declining to a more reasonable level.
We should be thankful for the positives we experienced during the year. But the road back to producing a change in this BEAR trend is going to be very long and challenging.
The Week On Wall Street
Investors returned to the table after a long holiday weekend in a foul mood. The unrest in China brings more questions about global growth and the US joined the other global indices in a widespread selloff. Oil dropped to its lowest level since last December before cutting its losses to close at $77. While the fundamentals stole the headlines, from a technical perspective, the looming overhead resistance is proving to be formidable.
Stocks were lower from the opening bell and never found any buyers. The S&P 500 closed down 1.5%, with every other major index losing more than 1.4% as well. Tuesday and early Wednesday were filled with indecision as traders weren’t going to be making any big bets before Chair Powell’s afternoon speech. Tuesday’s session marked the 12th day of sideways action with the S&P starting at 3992 and finishing flat at 3957.
All of that changed Wednesday afternoon as the sideways market in search of a catalyst received comments from Chair Powell that were deemed positive. The 3.1% rally was the second-best day of the year for the S&P 500 in terms of performance and the seventh-best breadth reading. In addition to Powell’s commentary, Treasury yields dipped as did the dollar. All adding more fuel for the BULLS. It was an across-the-board rally with the NASDAQ rallying 4.4%. The flip-flopping nature of the headline-driven market continues.
Thursday turned out to be a “digestion” day with mixed results across the indices. Friday’s jobs report was the next “daily” catalyst, and after a knee-jerk reaction on the downside, an afternoon rally cut the bulk of the losses, leaving the Bulls smiling going into the weekend and the Bears wondering what just happened. The S&P went on a roller coaster ride that frustrated just about everyone and along with the other indices closed flat for the week.
The Economy
The second look at Q3 GDP increased to 2.9% from the first read at 2.6%. Keep in mind if it weren’t for the massive Energy exports seen in the quarter this would have also been a negative report.
Employment Scene
JOLTS: job openings declined 353k to 10,334k in October following the 407k bounce to 10,687k in September. The latter was the weakest pace since June 2021 and was the first time below 11k since November. Openings were at a record high of 11,855k in March. There are now 1.7 job openings for each unemployed job seeker. Hirings dropped 84k to 6,012k after declining 238k to 6,096k previously. They were at a record 8,145k in May 2020. The report reflects some cooling in the still-tight labor market, as well as a reluctance of employers to both hire and fire in this environment.
The U.S. jobs report under-performed expectations for all but payrolls, which rose 263k. The unemployment rate remains at 3.7%. The workweek fell to 34.4 after being at 34.5 for five months. The labor force participation rate fell for a third month, to 62.1%. Hourly earnings provided an ugly stagflation spin, with a 0.6% November surge after big upward revisions that left a y/y rate rise to 5.1%.
Payrolls have now reclaimed all of the jobs lost during the pandemic standing at a 104% gain since March 2020.
MANUFACTURING – Disappointing news across the board
Chicago PMI plunged 8.0 points to 37.2 in November, much weaker than forecast, after dipping 0.5 ticks to 45.2 in October. This is the third straight monthly decline and is the lowest since the 32.1 print from May 2020. The 3-month moving average fell to 42.7 after declining to 47.7 previously.
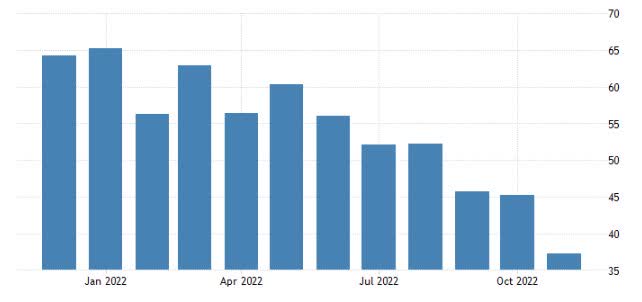
Chicago PMI (www.tradingeconomics.com/united-states/chicago-pmi)
Historically, (since the mid-1930s) the US economy has been in or on the cusp of recession every time the reading has dipped this low.
The US Manufacturing PMI posted 47.7 in November, down from 50.4 in October but broadly in line with the earlier released ‘flash’ estimate of 47.6.
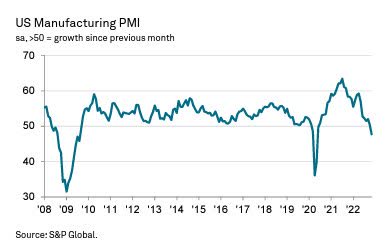
Manufacturing PMI (www.pmi.spglobal.com/Public/Release/PressReleases)
The headline index is now in contraction territory and signaled the first decline in the health of the manufacturing sector since June 2020.
ISM’s manufacturing index dropped 1.2 points to 49.0 in November after dipping 0.7 ticks to 50.2 in October.
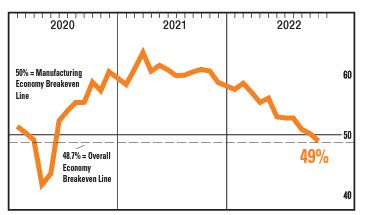
ISM Manufacturing (www.ismworld.org/globalassets/pub/research)
This is the lowest, as well as the first time in contraction since May 2020. Declines were broad-based.
Construction spending undershot estimates with a 0.3% October drop. Analysts saw the usual boosts for nonresidential and public construction, but they also saw a slight trimming for new residential construction and massive downward revisions for home improvement that pulled down the headline figures.
Housing
At pandemic levels. Pending home sales fell 4.6% to 77.1 in October after dropping 8.7% to 80.8 in September. This is the fifth straight month of declines and is the lowest since 71.6 in April 2020. On a 12-month basis, the contraction extended for an eleventh straight month and the rate deepened to 36.7% year over year, a new record low.
Consumer
Consumer confidence dropped 2 points to 100.2 in November (a four-month low) after slumping 5.6 ticks to 102.2 in October. This is the weakest since July’s 95.3. Confidence has been up and down all year, ranging from 111.1 in January to 95.3 in July, amid volatility in gas prices along with jitters over inflation, rising interest rates, and recession, though there have been bouts of optimism on signs of a more resilient economy and hopes for a less hawkish Fed policy stance.
The personal income report revealed October gains of 0.7% for income and 0.8% for consumption. The mix left a stronger-than-expected path for income into Q4, but the largely expected trajectory for spending. The savings rate fell to a new 17-year low of 2.3% from prior lows of 2.4%. The savings rate plunge leaves little room for spending to continue to outpace income into 2023.
Another sign inflation is slowing. U.S. chain price indexes in today’s income report slightly undershot assumptions, with a 0.3% October headline rise and a 0.2% core gain.
Retail Sales
The early reads on Black Friday from data aggregators point to better-than-expected sales for digital commerce and higher foot traffic for brick & mortar retailers.
- Online sales are tracking better than expected according to Adobe. Adobe Analytics notes Online sales were +2.3% to $9.12B on Black Friday, above their $8.9B estimate. Online sales during Thanksgiving were $5.29B, also ahead of their $5.1B forecast.
- In terms of retail foot traffic, Sensormatic Solutions noted that store traffic was +19.7% y/y for Thanksgiving Day (note that stores were negatively impacted by COVID in 2021) and +2.9% for Black Friday.
If this trend holds, the preliminary data suggest we won’t see any negative surprises when it comes to overall Holiday sales.
Risk of A RAIL Strike Rises.
Back in September, this appeared to be a DEAD issue with victory laps taken at the WH.
The Brotherhood of Maintenance of Way Employees Division (BMWED), the Brotherhood of Railroad Signalmen (BRS), and last week, the International Brotherhood of Boilermakers, all voted down the proposed contracts with the rail companies. One of the two largest unions, the Brotherhood of Locomotive Engineers and Trainmen voted down the proposals last Monday.
The other dominant union, the Sheet Metal, Air, Rail, and Transportation Workers also voted against the Administration’s deal. It is expected that it will be all hands on deck with intervention from Congress (Railway Labor Act) to get this resolved. If a strike were to occur (Dec. 9th), the economic implications would be dire for an already struggling economy.
The Global Scene
A Bloomberg survey of economists puts recession odds for the U.K. at 90%, with the Bank of England warning that Brits face the longest downturn since records began.
That confirms my views that England sealed their fate when the recently elected PM Rishi Sunak, decided on doubling down on England’s failed energy policies. These policies have increased energy costs that have inflation spiraling out of control and putting handcuffs and leg irons on UK consumers for a very long time.
Global PMI data was released this week. Other than India – all manufacturing PMIs were in contraction.
Eurozone Manufacturing PMI at 47.1 (Oct: 46.4). 2-month high.
Eurozone Manufacturing Output Index at 46.0 (Oct: 43.8). 2-month high. Both remain in contraction territory.
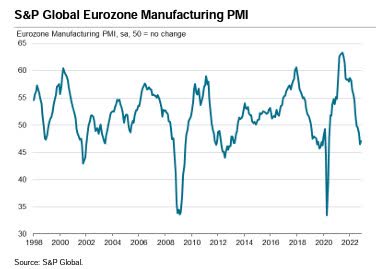
Euro PMI (www.pmi.spglobal.com/Public/Release/PressReleases)
The downturn in the eurozone goods-producing sector continued in November, although rates of decline in output and new orders were less aggressive when compared to the near two-and-a-half-year records seen in October.
The UK Manufacturing PMI edged up to 46.5 in November, from 46.2 in October.
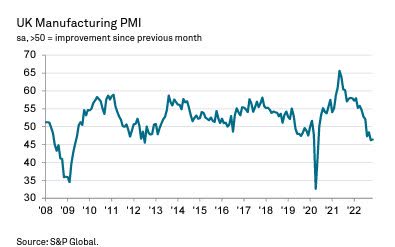
UK PMI (www.pmi.spglobal.com/Public/Release/PressReleases)
The PMI remained below the neutral 50.0 mark for the fourth month running and posted one of its lowest levels during the past 14 years.
Canada’s Manufacturing PMI recorded 49.6 in November. That was up from 48.8 in October to signal a slower rate of contraction.
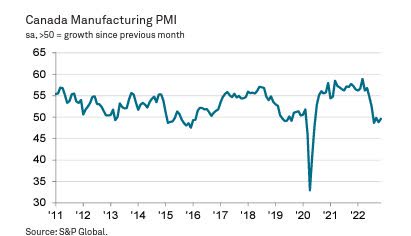
CANADA PMI (www.pmi.spglobal.com/Public/Release/PressReleases)
Nonetheless, the PMI has now posted below the 50.0 contraction mark for four months in a row.
India’s Manufacturing PMI at 55.7 signaled the strongest improvement in operating conditions for three months. The headline figure was also above its long-run average of 53.7. Output and sales rise at the quickest rates in three months, supporting job creation and input purchasing.
The Caixin China PMI rose from 49.2 in October to 49.4 in November, to signal a deterioration in the health of the manufacturing sector for the fourth month in a row. That said, the rate of decline was the slowest seen since August and only slight.
The au Jibun Bank Japan Manufacturing PMI fell to 49.0 in November, down from 50.7 in October to signal a renewed deterioration in the overall health of Japan’s manufacturing sector. Despite being only mild, the latest negative reading was the first in 22 months and was the joint-lowest since October 2020.
The ASEAN Manufacturing PMI registered 50.7 in November, down from 51.6 in October. While the latest reading remained above the crucial 50.0 no-change mark, to indicate a tenth monthly improvement in the health of the ASEAN manufacturing sector, the rate of growth was the slowest seen over this period and only marginal.
APAC regional industrial production numbers showed a steady decline in South Korean activity, while Japanese industrial production fell for a second month running.
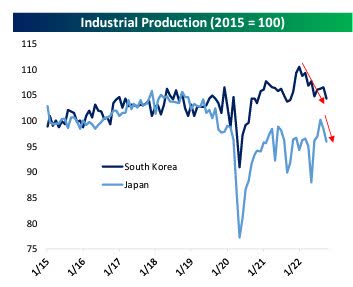
APAC Ind Production (www.bespokepremium.com)
The slowdown of activity in these sorts of countries is consistent with the broader slowdown in the global economy.
Chinese data also illustrated the slowdown.
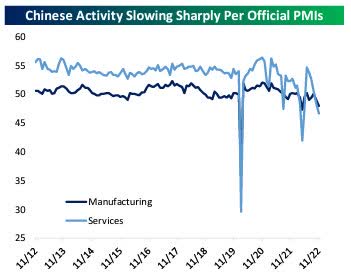
China Ind Productivity (www.bespokepremium.com)
While markets have been highly enthusiastic about reopening impacts, economic activity across both factories and the services sector continues to sag.
The Fed
The market’s obsession over the 25 basis point difference between the 75 Bps hikes we have seen to the now anticipated 50 Bps increase is not only bizarre, but it is also silly. Whatever the case, Powell uttered the correct words in his speech on Wednesday, and it appears those that were looking for more hawkish comments got caught “short”.
“Time for moderating pace of rate hikes may be as soon as December.”
Fed Chair Powell then reiterated the message from the November 2 presser — that there is more ground to cover. He repeated that rates are likely to peak at a “somewhat higher” level versus the September forecast. And he added that the rate will need to remain restrictive for “some time.”
There is nothing new here, BUT the “market” took those same words, and as only it can do, and turned that into an across-the-board rally. While the Fed has decided to ramp back the pace of hikes, I see little evidence of true dovishness or a desire to tighten less without seeing measurable results on inflation.
The Yield Curve
By now, you should be aware that the yield curve is very inverted based on pretty much any measure. The widely-discussed “10-2” portion of the curve is more inverted than it was before the early 2000s and Global Financial Crisis recessions, but even the very long end and the very short end are the most inverted since the early 2000s.
Yield curve inversions are said to basically “start the clock” on an upcoming recession and sure enough, all the recessions over the past 40 years have been preceded by inversions. Betting that this time is different does not seem like a smart bet to me, especially since I believe that the economy is only now starting to feel the effects of the issues it faces.
Inverted yield curves haven’t just been a US phenomenon, though. The global yield curve (spread between the 10-year and 2-year maturities) inverted recently for the first time since late 2014. The pace of flattening in the global yield curve has also been extreme. In a year and a half, it has gone from its steepest to most inverted levels since at least 2014.
Of the 15 countries that make up the global curve, eight are now inverted.
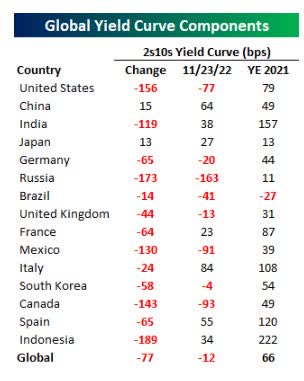
Yield Curve (www.bespokepremium.com)
Inverted yield curves in the US have raised concerns about a recession in the US, but with yield curves now inverted in the majority of the world’s largest economies, a global recession looks increasingly likely.
Food For Thought
NO MORE DRILLING – Unless it’s not in the US.
The Biden administration made a significant shift in its Venezuela policy when the Treasury Department granted Chevron (CVX) a new license to operate in Venezuela following a meeting in Mexico last weekend. This move won’t increase the world’s oil production in the short term and shows the hypocrisy on display in US and Global energy policy. There seems to only be outrage from the Green movement when the US oil industry wants to create jobs and drill for oil on US soil. Somehow drilling for oil elsewhere isn’t seen as a “climate threat”.
Getting back to the “supply” issue, there is a myriad of technical issues with the aging Venezuela oil fields. In addition, Chevron must collect some debt, stop power outages, repair equipment, and bolster its workforce there while facing numerous security threats.
These hurdles do not exist here in the US, but the regulatory hurdles and ESG requirements are enough to stifle production. Jose Chalhoub an oil analyst in Venezuela, estimated the investments needed to restore Venezuela’s lost oil production could come to as much as $50 billion.
Some analysts aren’t so sure if Chevron is ever going to tackle this new “project”. Before Chevron is willing to make new investments in Venezuela, such as in new fields, it wants to collect more than $4 billion in debt from the Venezuela national oil company, Petróleos de Venezuela SA. Collecting that debt could take years.
It has been one Keystone Cops episode after another as Energy policy has kept costs high. They remain at the root of inflation and will continue to shackle consumers and corporations, thus muting any chance for growth.
The Daily chart of the S&P 500 (SPY)
A market that was in a short-term trading range decided to make a move and it was to the upside. The S&P 500 closed back above its 200-day moving average for the first time since April. That is a bullish development, but now it must prove it can stay above the 200-DMA (4046) to help confirm its legitimacy. It broke above the 200-DMA in February and March but soon rolled back over to break back below it.
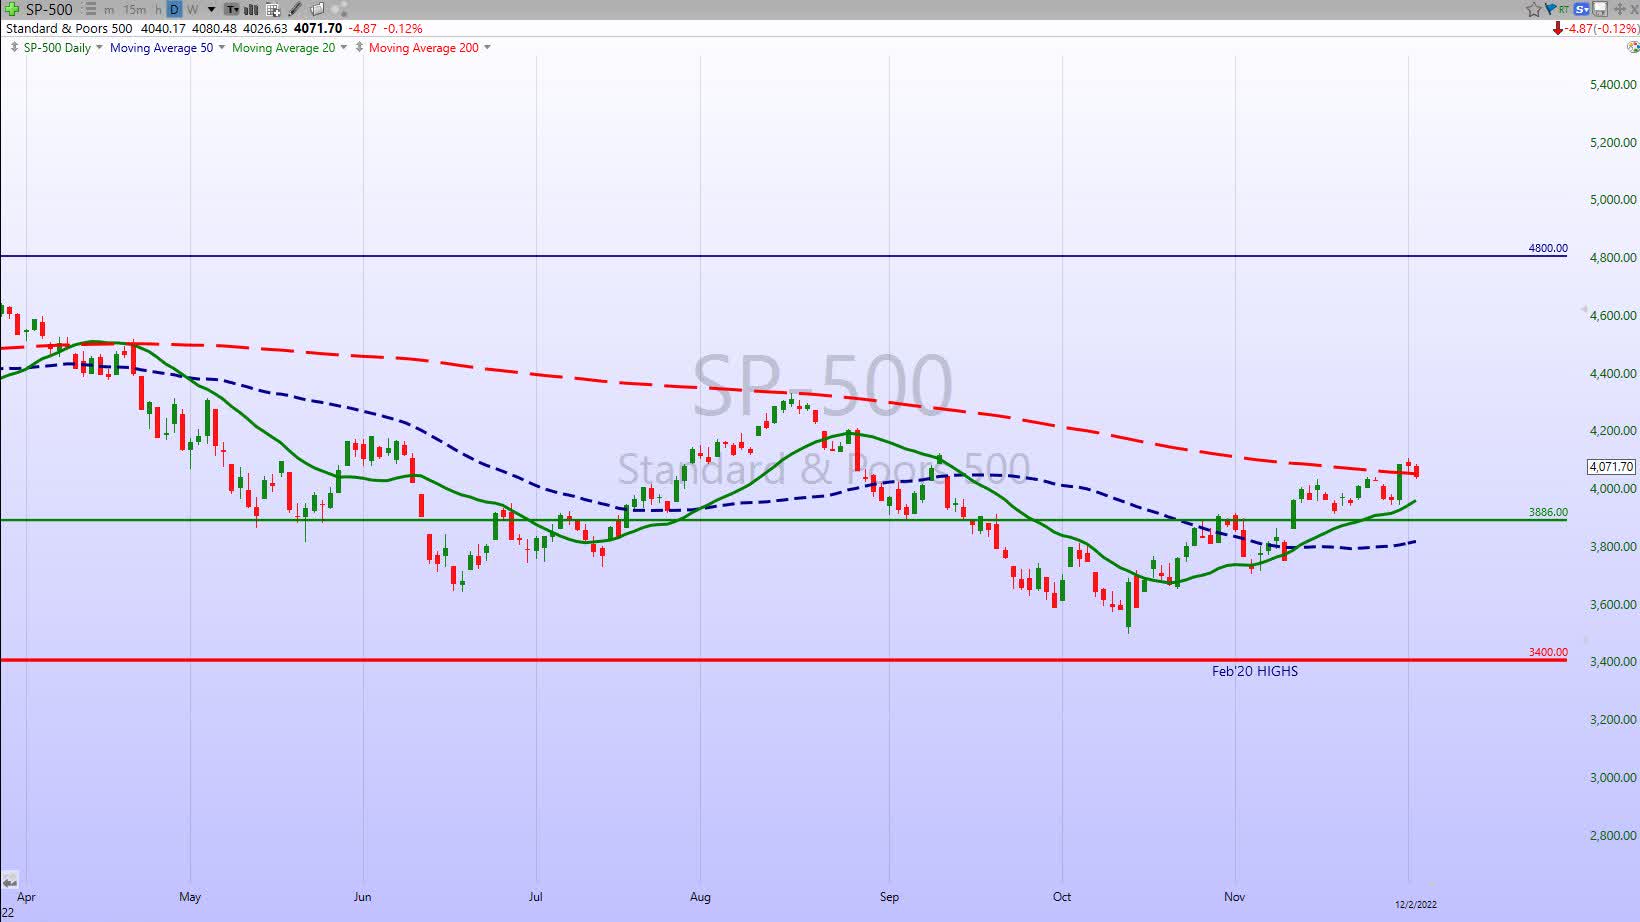
S&P 500 (www.FreeStockCharts.cpm)
If an investor doesn’t like the direction of the “daily” action, just wait a day, and it is apt to change. This quickly changing headline-driven market is wreaking havoc with both the Bulls and the Bears.
Investment Backdrop
November is in the books, and after all of the Indices posted solid gains with DJIA recording its best October in history by rallying 14%, investors weren’t so sure what would come next. Surprise, surprise, the S&P, DJIA, Russell 2000, and Dow Transports posted their third consecutive month with gains. The NASDAQ has been the laggard but this month’s 4% rally made it two months of gains in a row.
November’s results
All of the major indices posted gains with the DOW Transports (+7.8%) being the clear leader. The S&P and the DJIA each added 5+% for the month. Semiconductors have been battered, but they gained 18.8%, and easily led all sectors. There was a notable increase in the Financials (+6.8%) as well.
Year-to-date Results
For the year, the sea of RED remains. It’s the same story, Energy along with Commodities have rallied, and not much else.
Energy (XLE) has now posted gains in ten of the eleven months and is the YTD leader up 64%. Commodities are a distant second gaining 17+% for the year.
Small Cap Value rallied in November and has now edged into the green for the year.
The chart below speaks to the technical issues that added to the market weakness at the beginning of the week, as stocks were in an “overbought” condition. It shows the S&P 500’s daily overbought/oversold (OB/OS) readings over the last year measured in standard deviations above the 50-day moving average.
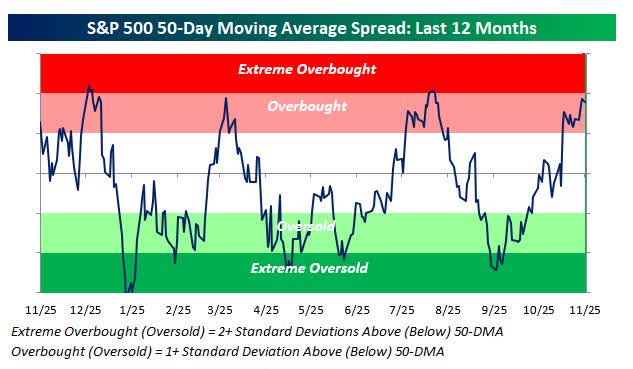
S&P Overbought (www.bespokepremium.com)
During the holiday-shortened trading week, the S&P 500 traded to its most “overbought” level since mid-August. Over the last year, it has only been this overbought three other times: in late December, late March, and mid-August. all of those instances led to a market pullback.
The mid-week “Fed rally” pushed the overbought levels to an extreme. Investors can step back and start making assumptions and get positioned either way, BULLISH or BEARISH, but that is just guessing. I prefer to let the markets tell me by its price action IF the BEAR trends are truly going to be overtaken and turned into BULLISH trends.
In the short term, the market is going to be driven by three factors. The direction of Treasury yields, how the US dollar trades, and inflation headlines. If this rally continues for a few more days, there is another factor that can come into play. Money managers are sitting on the sidelines. They have cash and they don’t want to be seen as missing out on a year-end rally. It’s their final chance to try and beat the indices by overindulging on “momentum” to make their year-end bogies.
So momentum can continue into year-end, but I’m not convinced it is a backdrop that suggests going all-in here because of the recent Fed commentary. That would be dependent on too many things that have to go right. In the bigger picture, nothing has changed. Headwinds are present and the longer-term downtrends are in place, I just don’t feel the risks are worth playing aggressively, even should equities continue their rally in the near term.
If I’m going to take some risk now, I want good technical setups and good value. I am also looking for dividend yield. In a recent investment note to members of my service, I recently updated detailed criteria for any new position.
Thank you for reading this analysis. If you enjoyed this article so far, this next section provides a quick taste of what members of my marketplace service receive in DAILY updates. If you find these weekly articles helpful, you may want to join a community of SAVVY Investors that have discovered “how the market works”.
The 2022 Playbook is now “Lean and Mean”
If a stock isn’t in the Energy, Healthcare, or Utility sector, then it is in a BEAR market trend. That leaves investors looking for near-term “long” opportunities with a very limited playing field.
Savvy investors have expanded the playing field this year and the covered call strategy has been an integral part of the “plan”.
Bifurcated Market
When I stack up the DAILY charts of the major indices it gives me a good idea of what is developing across the market. The DJIA and the NASDAQ are the bookends. They are the Best-looking to Worst-looking charts. The DJIA is the only index to surpass the August highs. The NASDAQ is the furthest away from initial resistance and not even close to the August highs.
My weekly sector review also shows other divergences that mimic the strength of the DJIA., and the relative weakness in the NASDAQ.
For the moment the overall picture remains “MIXED”.
If you find what is presented here every week to be useful, the analysis and presentation to members of my service are complete with charts that zoom in on the critical pivot points for each group. A picture is worth a thousand words.
Sectors
Commodities
Crude Oil
WTI was down nearly 3% on Monday morning, and that took the price of WTI down to its lowest level of the year. with that development, investors have witnessed a round-trip trade taking WTI back to where it started the year.
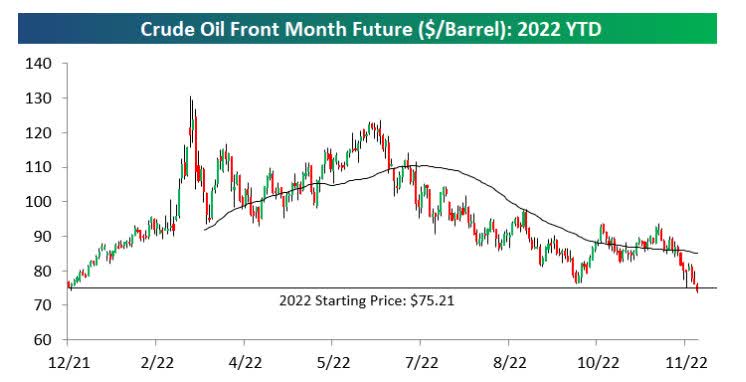
WTI (www.bespokepremium.com)
Despite the weakness in crude oil, Energy stocks remain well in the black YTD with the Energy sector still up over 60%. That’s nearly 60 percentage points above the next closest sector (Utilities: +1.21%). The ten largest components of the sector are also all well into positive territory for the year with gains in the range of 50% for Pioneer Natural (PXD) to more than 140% for Occidental Petroleum (OXY). Both have been in this year’s Savvy playbook.
When WTI was trading well over $100 per barrel, the bullish case for energy stocks was that these companies would be profitable even if crude oil prices corrected sharply. Now that WTI has corrected by more than 40% from its closing high earlier this year, many energy companies are still profitable at these levels but not by nearly as much as they were just a few months ago.
Natural Gas
The volatility in the Nat Gas ETF (UNG) continues. after a 10+% rally during the shortened Holiday week, UNG pulled back ~12% this week. That’s been the pattern with large moves in both directions, but at the end of the day, UNG has been flat since July. With this ETF anything is possible, so it is reserved for those with a HIGH tolerance for risk.
Silver
It’s been a “tease” recently as investors watched the Silver ETF (SLV) try and break out above solid resistance. That beak of resistance took place this week and opens the door for a potential run to $24.
Energy
With WTI trading where it was at the start of the year, energy stocks have diverged from the price of Crude Oil. From late 2021 through early this summer, crude oil and energy stocks tracked each other step for step in terms of performance. Since the summer, their two roads diverged and the positive correlation has completely reversed.
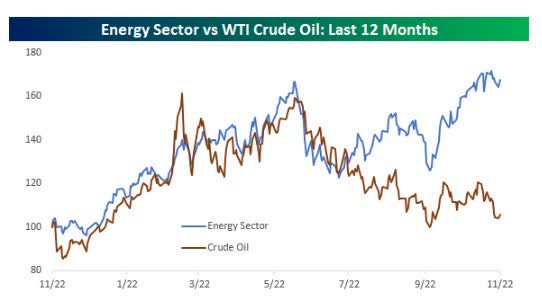
Energy stocks vs. Oil (www.bespokepremium.com)
The S&P 500 Energy sector has continued rallying to new highs while crude oil sells off on pressure from sales of the Strategic Petroleum Reserve. There’s no rule that Energy stocks have to closely follow the price of oil, but the recent divergence stands out.
This time around there are plausible reasons for this divergence. Many energy stocks are handing out their Free Cash Flow by paying HUGE dividends and increasing stock buybacks. No other sector comes close to that shareholder return. The sector is in a BULL market trend and has momentum.
Looking ahead, investors are wondering if crude oil will catch up to energy stocks or vice versa. Of the five prior periods where there was a similar divergence between crude oil prices and the Energy sector, both were up over the next year three times and down twice. Of those five periods, crude oil performed better over the next twelve months in all but one period, but Energy stocks did not crater. In 2006 the sector (XLE) was volatile but finished the year flat.
From a valuation standpoint, Energy’s P/E ratio is still in the single digits and below the median 20-year level of just under 15x. Therefore, the Energy sector is “inexpensive” especially when the majority of other sectors are still trading at multiples that are above their 20-year median. While the last two years have seen outsized gains a period of consolidation is probably overdue.
Critics say “Energy” is a crowded trade. That sounds like sour grapes, and they have repeated that warning all year. When I see that “Energy” only represents 5% of the S&P 500, I’m not worried about the so-called crowd. When the money managers that are committed to ESG and everything green start investing in the sector – I’ll get concerned.
As long as the price of Crude doesn’t suffer a collapse due to a global recession (the risk), the BULL market in Energy equities remains in place.
Energy Explorers Sub Sector
Meanwhile, the long-term chart of Energy Explorers (XOP) looks very interesting. The ETF is about where it was in 2016, and while one can argue it’s gone practically nowhere in the last 6 years, I can make a case for one giant “cup and handle” pattern that is forming since 2018. If the pattern follows through, it suggests Energy stocks like (CTRA), (FANG), (MRO), (PXD), etc., are going higher in the years ahead.
Energy Services Sub-Sector
Oil Services look great as well. When you get a theme like Energy right, it doesn’t matter how you decide to play it. I think (XOP) is also a good proxy for Energy stocks since it isn’t as dominated by only a handful of companies as (XLE) is. The Oil Services Index (OIH) looks like a large potential bottom to me that has been formed over the past several years. Some of my favorite Oil Services names include (TDW), (SLB), (FTI), (VAL), (HP), and (RES).
In the short term, the energy complex measured by the major ETFs is extended. However, there are individual companies that are on slow steady uptrends and are worthy of more research.
Financials
The Financial ETF (XLF) continues to rally vaulting over near-term resistance levels. In doing so the ETF is now challenging the long-term BEAR trendline. However, history tells us a failure at this level can easily morph into a drop back to the lows. It may take a while (end of December?) to determine if we get a BULL or BEAR signal from the group.
Healthcare
Another positive divergence here as the market views the Healthcare group (XLV) as being able to hold up well in a recessionary environment. Th rally off the October lows stands at ~9%. The BULLISH Long-term trend remains.
Biotech
The Biotech ETF (XBI) is in a “holding” pattern. Since the low on September 26th, the ETF has established a series of higher lows but hasn’t gained much ground. Then again in a BEAR market that is a positive. Sideways price action is a good pattern to write calls. Buy the XBI and sell near-term (1-2 months out) upside calls to generate income.
Technology
It’s been a tough year for technology and the mega caps have not been spared. All four of the large-cap ‘MAGA’ stocks – Microsoft (MSFT), Apple (AAPL), Alphabet aka Google (GOOG) (GOOGL), and Amazon.com (AMZN) – are now down at least 20% from their all-time closing highs. Along with AAPL’s 22% drawdown, the three others have seen declines over 30% with AMZN down over 50% from its record high.
While all four of the largest stocks in the S&P 500 are down at least 20% from their highs, it’s notable that the S&P 500 is down ‘only’ 18%. For years, mega-caps were credited with driving the broader market gains as they handily outperformed their smaller market-cap peers. In 2022, we have seen the opposite trend play out as mega caps are still seeing larger moves, but to the downside instead of to the upside.
Look on the bright side, think about how much worse the picture would look if smaller stocks in the S&P 500 were still underperforming their mega-cap peers.
Semiconductors Sub-Sector
The semiconductor ETF (SOXX) looks like many other charts these days, as it has rallied to resistance.
Another situation that leaves us guessing as to what comes next. In all prior instances, these rallies were rebuffed and the ETF went on to make a lower low. Similar to the general market analysis, the depth of any pullback will be crucial.
ARK Innovation ETF (ARKK)
The Ark Innovation ETF (ARKK) is THE proxy for all that is “RISK”. Sideways, sideways and more sideways just above long-term support is what the chart is telling us.
If an investor wants to see what a ‘false breakdown” looks like, the chart of the ARKK is a perfect example. It sure looked like the ETF broke support only to rally quickly and settle back into the trading range.
Cryptocurrency
To start the week, Bitcoin revisited its FTX lows with a modest rebound during the rest of the week. At the moment, the world’s largest crypto is in the middle of the past few weeks’ range.
With the holidays now here and the finish line of the year in sight, seasonality can provide some tailwinds. This point of the year has been one of the best for short-term (one week and one month) returns for Bitcoin.
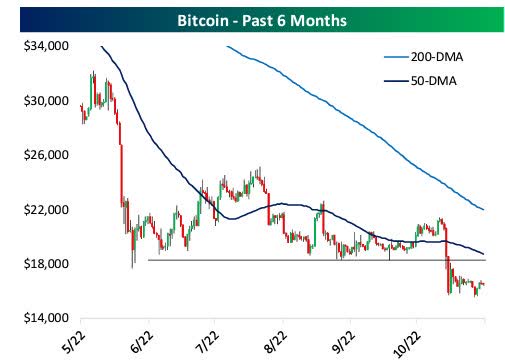
Bitcoin (www.bespokepremium.com)
With this recent breakdown, there is plenty of overhead resistance at the 18k level. It could be some time before BTC can overcome that. Shorting Bitcoin using (BITI) is one way to play this downtrend
International Scene
China
It doesn’t matter what part of the world we are talking about the stock market likes to surprise investors. While the protests in China dominated the headlines causing a global selloff on Monday, every Chinese ETF was higher on the day. I realize there is not much of an appetite to own Chinese stocks, but this price action is signaling the worst is probably all been priced in. It’s been a wild ride off the recent lows. (KWEB), (ASHR), (FXI), etc. plumbed new lows then recovered and are back to where they were in June. More importantly, the “technicals” are signaling further upside ahead.
I continue to maintain exposure to China via ETFs, and also to the second derivative of that trade, Large Cap casino stocks. Las Vegas Sands (LVS) and Wynn Resorts (WYNN) are beneficiaries of the eventual full reopening of Macau. Both stocks have broken out of basing patterns and are headed higher.
Final Thoughts
While the fundamentals are all showing signs of a global recession, the markets are in rally mode. So what gives? We do know that equity markets will bottom before the economy. The divergence that is showing some Bullish green shoots in some of the technical patterns has caught my attention. Just how far this emerging trend can go is yet to be determined. At the moment it is obvious we have a two-tiered market with the DJIA (value) leaps and bounds ahead of growth (NASDAQ), and everything else in the middle.
It’s far too early to declare any change in market trend imminent but I like to keep an OPEN mind to all possible outcomes. This is a time when I will assign probabilities to all potential results. The fundamental picture depicted by the economic data isn’t pretty, BUT the stock market isn’t looking at that now. It’s focused on how long and how deep any recessionary period is going to be. The market also knows (and is priced for) inflation which is now running at 7%. However, it has to determine how long it will take to get inflation back to an acceptable level. That dovetails with how high the Fed has to raise interest rates.
That is a huge meal to try and digest. With so many side dishes being served, the timing will have to be just right or indigestion will continue to plague investors.
Postscript
Please allow me to take a moment and remind all of the readers of an important issue. I provide investment advice to clients and members of my marketplace service. Each week I strive to provide an investment backdrop that helps investors make their own decisions. In these types of forums, readers bring a host of situations and variables to the table when visiting these articles. Therefore it is impossible to pinpoint what may be right for each situation.
In different circumstances, I can determine each client’s situation/requirements and discuss issues with them when needed. That is impossible for readers of these articles. Therefore I will attempt to help form an opinion without crossing the line into specific advice. Please keep that in mind when forming your investment strategy.
THANKS to all of the readers that contribute to this forum to make these articles a better experience for everyone.
Best of Luck to Everyone!
Be the first to comment