

Sinenkiy/iStock via Getty Images
We have always maintained that fund-flows drive the market. In this piece, we look at the effects of fund-flows initiated by Treasury interest payments, corporate tax collection, and the net-transfers (net-spending) of the Government on the stock market.
The intended effect of raising the FFR (Fed’s fund rate) is to squash demand and lower inflation. The unintended effect, however, is that since the Treasury must increase its currency-creation, the increased interest amounts will add to the private-sector savings and help increase the liquidity available in the market. Increased liquidity helps to support the stock market.
On November 15, the mid-quarter interest payment, which comes out of the “other reserves” account, will be significantly higher than in the past. At the end of each month, there is a smaller interest payment, which we can use to gauge what to expect from the bigger mid-quarter payment. The payment at the end of October 2021 was $8B, compared to $14B paid this past month. That is a 75% increase which means that, since the 2021 mid-November payment was $42B, next week’s payment could add ~$70B to the private sector.
Last year, the SPX rallied leading up to the November 15 interest payment, and then backed off into the December tax-take (chart below).
ANG Traders, stockcharts.com
The same pattern is replicating this year; expect the market to rally until closer to the mid-December tax-take which should stall and weaken the SPX (chart below).
ANG Traders, stockcharts.com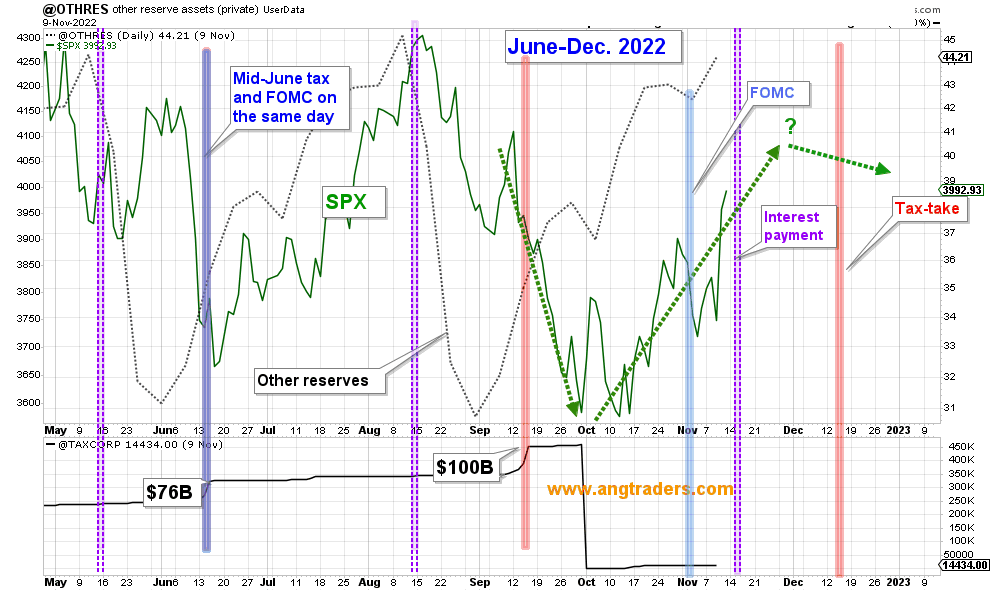
The chart below, summarizes how the SPX reacts around tax-takes and interest payments; the SPX tends to rise into the interest payment, and weaken around tax payments.
ANG Traders, stockcharts.com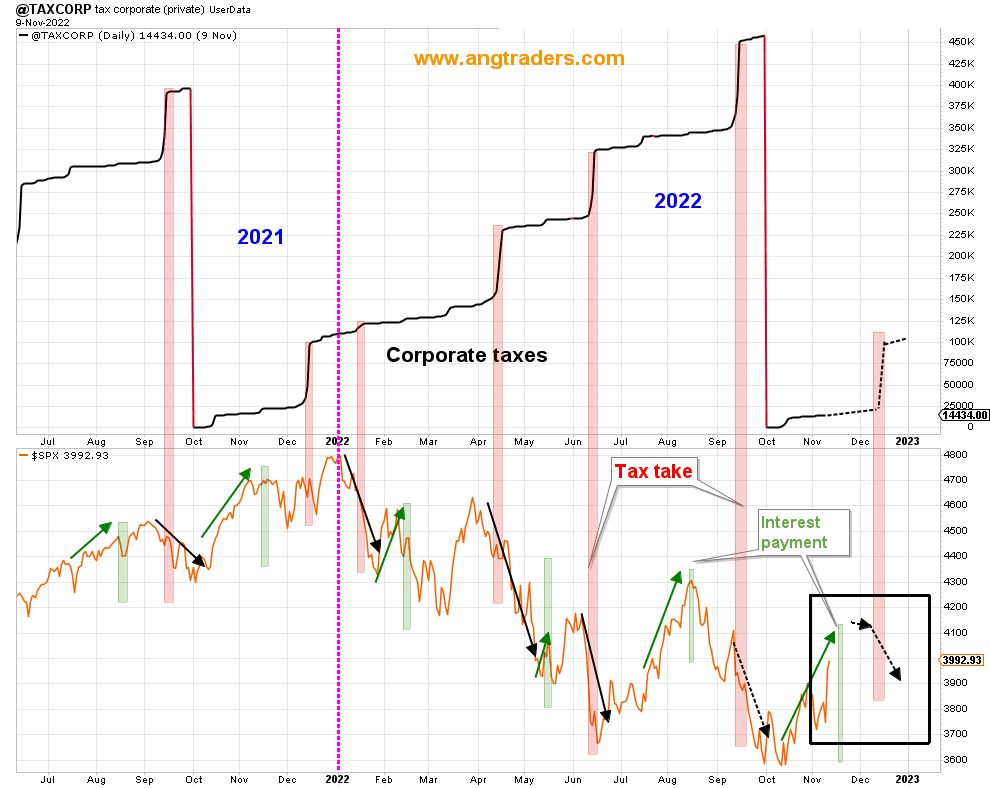
Since we are discussing corporate taxes, we might as well mention that corporate taxes are lower than they were last year at this time, which means corporate profits should continue lower as well. However, the chart below, shows that the current situation is replicating the 2012 stall in corporate taxes (blue vertical line) when the SPX dropped ahead of the earnings reports, and then rallied on the news of lower profits (blue-ovals). The SPX has already bounced off the pre-pandemic trend-line and has room to move higher (chart below).
ANG Traders, stockcharts.com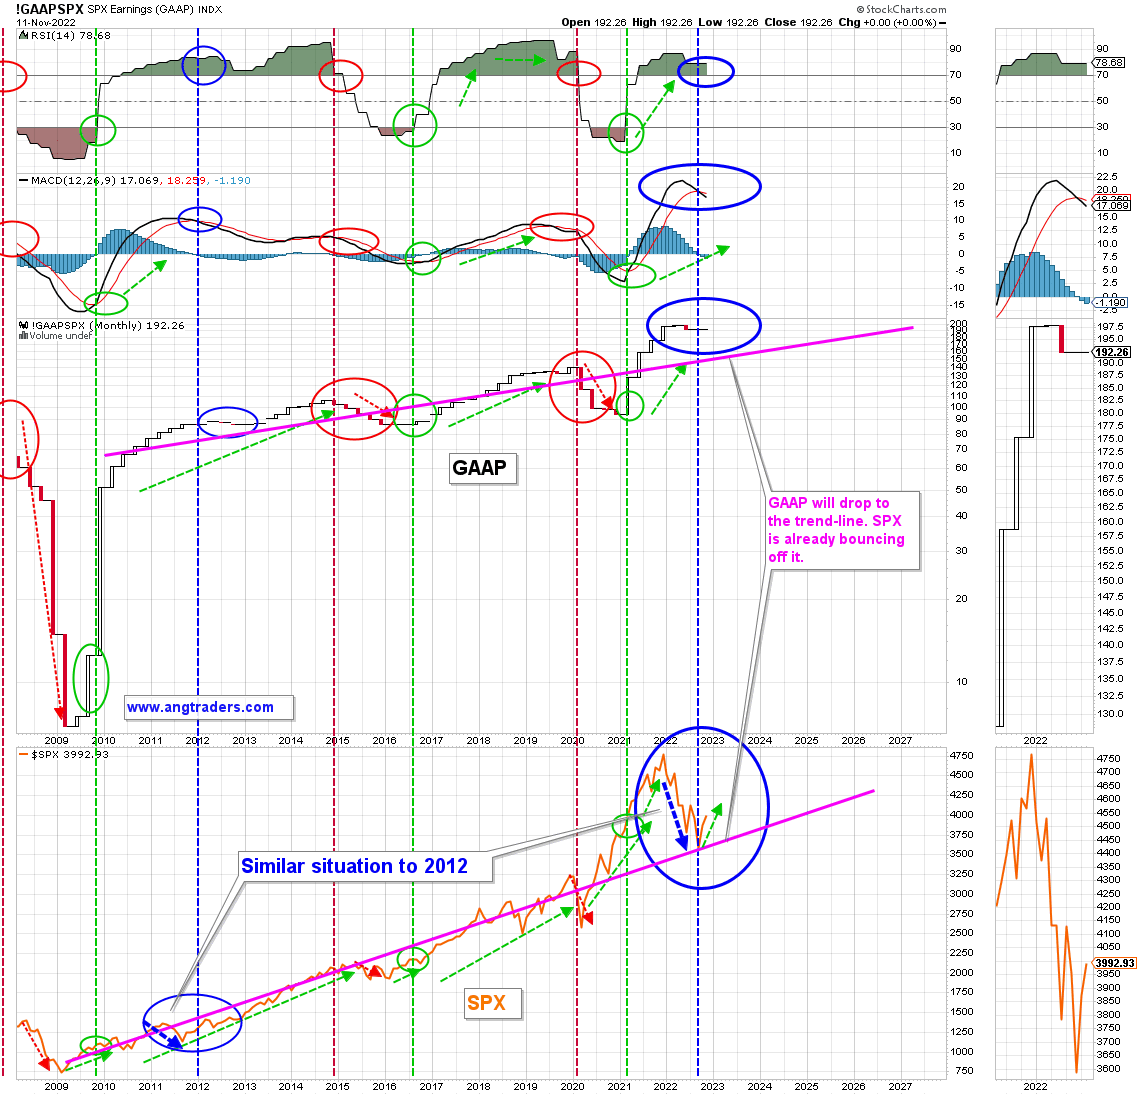
The 20-day MA of the daily net-transfers– which is the net Treasury budget balance with Treasury debt transactions removed–is at +$8.55B/day, +$171B/month, or +$2.05T/year. The TCB (Treasury cash balance) has dropped ~$180B in the last month, which has flowed into the economy and helped increase liquidity (chart below).
ANG Traders, stockcharts.com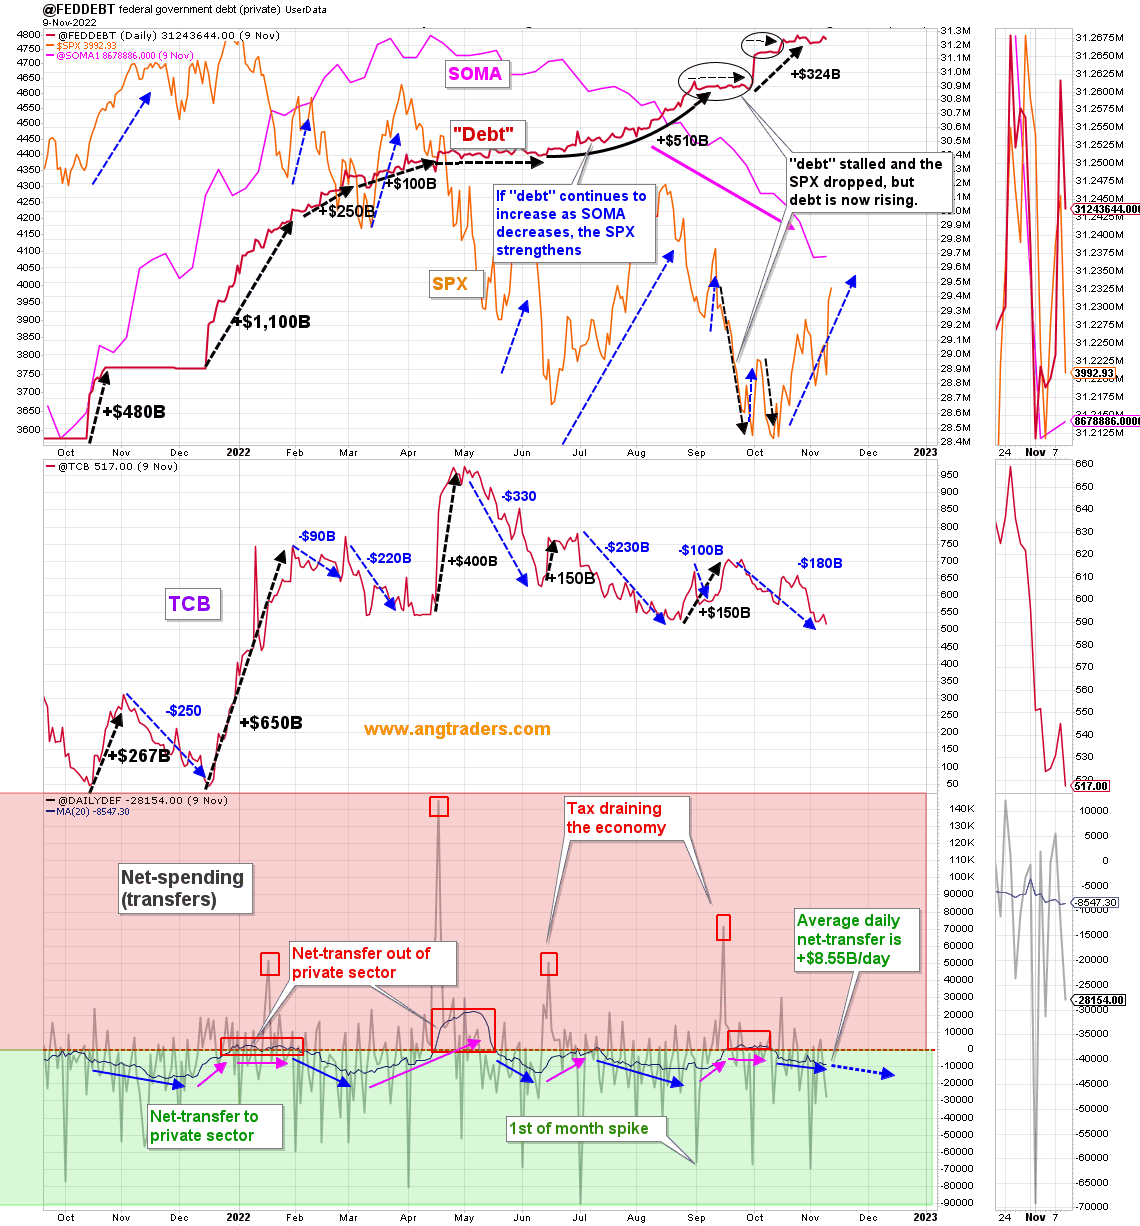
The current rate of net-transfer is ~$2.0T/year, and double the pre-pandemic rate of ~1.0T/year. The SPX has already bounced off the pre-pandemic trend-line (blue-line below) and, going forward, if the $2T/year rate is maintained, the SPX should follow the green trend-line on the chart below.
ANG Traders, stockcharts.com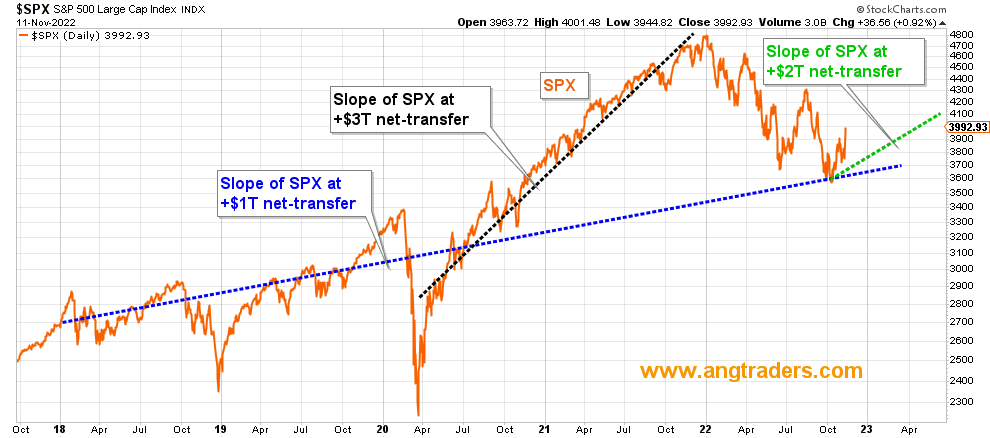
Our proprietary liquidity model continues to expand and the SPX is following in its footsteps (chart below)
ANG Traders, stockcharts.com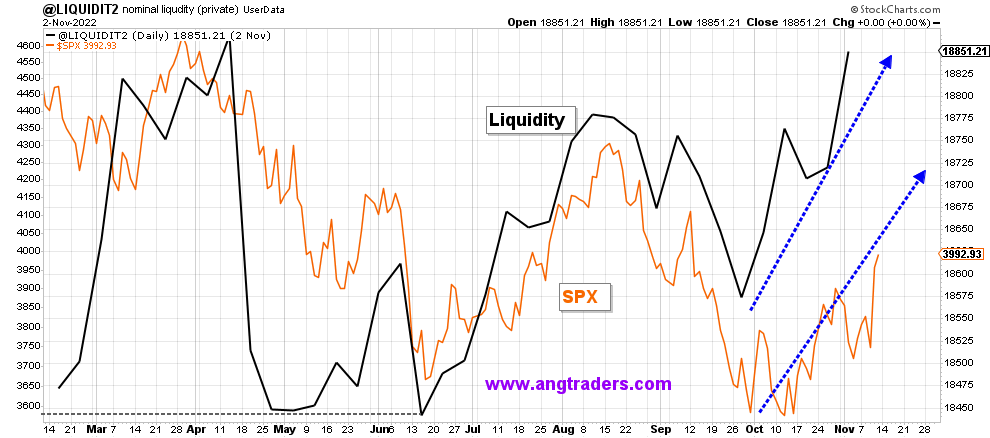
The current fund-flows are supportive of the stock market, and should continue to be supportive for the next month until the mid-December tax-take. Investors can be long for another couple of weeks, and then start to take profits. Leveraged broad-spectrum ETFs such as SPXL, and TQQQ could be profitable until the first week of December.
Be the first to comment