

niphon
Thesis
The Trade Desk, Inc. (NASDAQ:TTD) has demonstrated its execution prowess in 2022 even as its advertising peers faced significant macroeconomic headwinds impacting their growth cadence.
Therefore, the company’s performance in FQ3 was highly commendable, as it outperformed the consensus estimates on revenue and adjusted EBITDA. Notwithstanding, its Q4 guidance came in markedly below the Street’s estimates, highlighting that The Trade Desk is not immune to macro headwinds.
However, we highlighted in our pre-earnings update that the market had already anticipated a relatively weak outlook as it de-rated TTD significantly from its August highs.
Accordingly, the market forced an initial post-earnings selloff that led to TTD pulling back toward our expected consolidation zone before reversing it remarkably. As such, it digested bearish investors astutely who were led into the initial selloff as buyers held its critical May lows.
With TTD’s May lows defended robustly, investors have another opportunity to assess whether the reward/risk profile justifies adding exposure at the current levels, given TTD’s implied growth premium.
We discuss how investors should consider TTD’s valuation within the software model that operates in the ad-tech space.
Given more constructive price action and a more well-balanced valuation, we view the current levels favorably for adding more exposure. However, we caution that near-term downside volatility could return if TTD’s execution is inadequate to justify its growth premium, as it’s still not undervalued.
Revising from Hold to Buy, with a medium-term price target (PT) of $65 (implying a potential upside of 36%).
TTD’s Q4 Guidance Led To Further Cuts In Its Estimates
Despite posting another quarter of robust performance for FQ3, the company’s guidance led to uncertainty over the company’s forward outlook over the next year.
Accordingly, management guided to Q4 revenue of $490M, up 23.9%, suggesting a marked slowdown from Q3’s 31.1% uptick. Also, we highlighted in our previous article that Q4 has consistently been The Trade Desk’s seasonally important quarter. Hence, robust guidance would have bolstered investors’ confidence in its FY23 outlook.
However, the company’s guidance also came in well below the previous consensus estimates of 28.9% growth. We had emphasized previously that the market needs to see a robust Q4 outlook to lift sentiments further on TTD, given its growth premium.
TTD Revenue change % consensus estimates (S&P Cap IQ)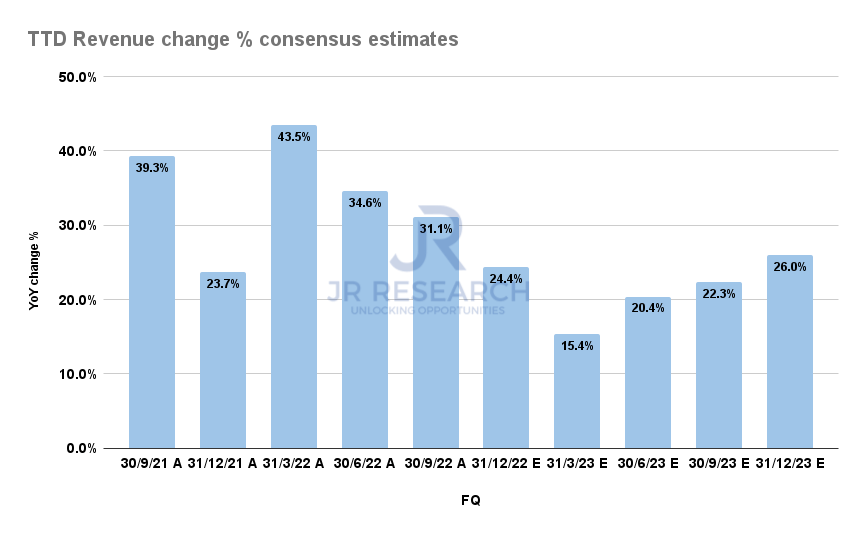
As such, the consensus estimates through FY23 have also been revised downward. Despite that, The Trade Desk is still expected to post an inflection in its revenue growth from Q2’23.
We postulate that the de-risked forward projections for TTD set it up well to outperform in FY23 if the economy manages to dodge a severe recession (a severe recession is not our base case). Moreover, given TTD’s remarkable growth in its CTV ecosystem against its advertising peers, we believe it validated the remarkable execution prowess of CEO Jeff Green & team.
Management continues to see robust growth in FY23 despite a highly challenging FY22 for the Advertising industry. Green highlighted that “WPP’s GroupM predicted worldwide advertising will increase 8.4% in 2022.” Yet, TTD’s FQ4 guidance implies a full-year growth rate of nearly 32%.
Hence, we think there’s no doubt that the company continues to gain share against its peers, as Green accentuated:
The Trade Desk has significantly outperformed seemingly all other forms of digital with a significant contrast to walled garden in our ability to win advertising budgets. It is very clear that under the current operating conditions, we are significantly outpacing the market regardless of the macro environment. (TTD FQ3’22 earnings call)
Hence, we postulate that The Trade Desk’s execution through a challenging FY22 has been significantly tested. Nevertheless, the company has proven its ability to navigate macro and industry headwinds remarkably, demonstrating the competitive moat of its programmatic, omnichannel platform.
Therefore, the critical question is whether TTD’s current valuation justifies its reward/risk profile.
Consider Valuing TTD As A Software Platform
It’s critical for investors to understand that The Trade Desk needs to be assessed as a software model to make sense of its valuation. The company has often emphasized that it operates a “self-serve software model [driving] operating leverage.” So do its financial metrics make sense?
TTD Gross margins % consensus estimates (S&P Cap IQ)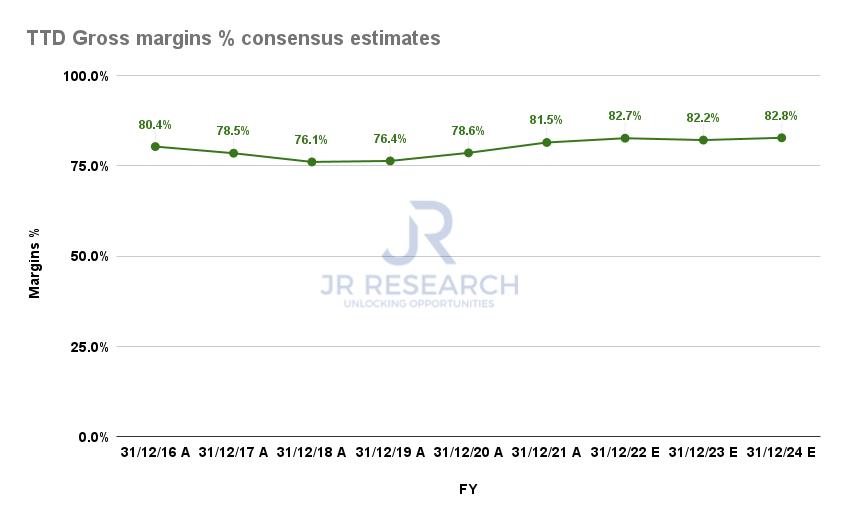
The Trade Desk is expected to report gross margins of 82.7% for FY22. Based on Public Comps data, it would place TTD within the top 25% of high-growth SaaS companies within its coverage that report gross margins of over 81%.
Also, the company posted a TTM Rule of 40 of more than 65%. However, TTD’s Rule of 40 suggests it’s average within the high-growth SaaS space.
Notwithstanding, we believe it indicates that investors can consider a SaaS modeling for TTD to appreciate its valuation.
TTD Forward normalized P/E consensus estimates (S&P Cap IQ)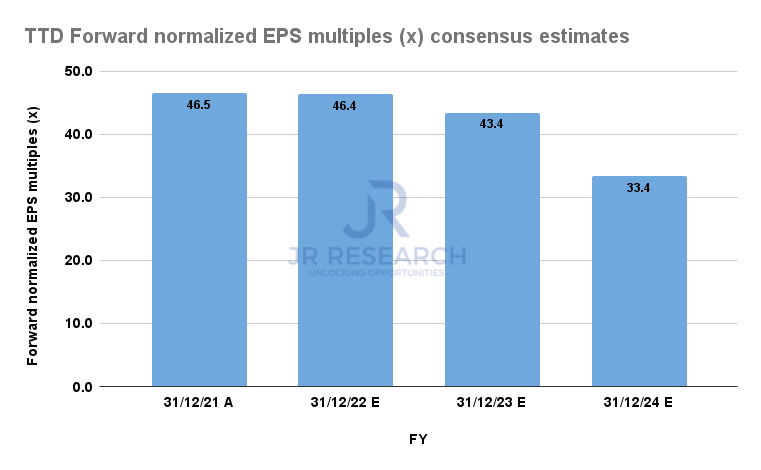
TTD last traded at a FY24 normalized earnings multiple of 33.4x. Note it’s higher than the Software ETF’s (IGV) forward P/E of 27.2x but below its weighted average P/E of 39.5x. It’s also below the Software industry 10Y median P/E of 35.7x.
Therefore, with The Trade Desk projected to grow its adjusted EPS by nearly 30% for FY24, we believe that TTD is not expensive based on its FY24 earnings multiple.
However, we postulate that a material re-rating of TTD is unlikely in the near term. Hence, investors adding at the current levels are urged to be patient and wait for the market to subsequently lift the sentiments over high-growth stocks.
Is TTD Stock A Buy, Sell, Or Hold?
TTD price chart (weekly) (TradingView)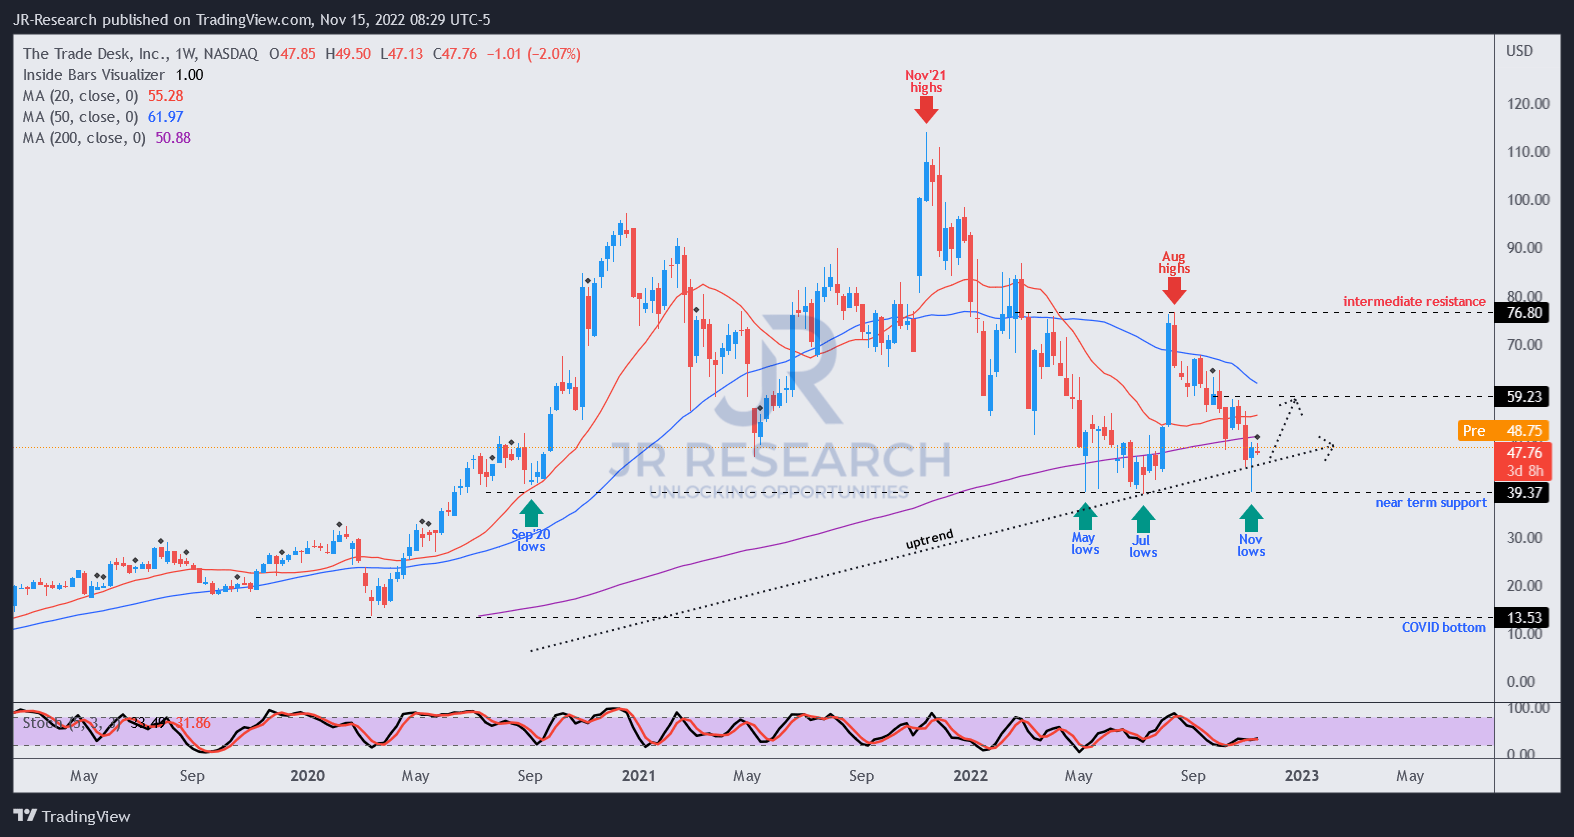
TTD successfully re-tested its near-term support, which has undergirded its consolidation zone since May 2022. It’s also in line with its 200-week moving average (purple line), providing another layer of support for long-term buyers.
However, we noted that its buying momentum needs to retake the $60 decisively for TTD to regain control over its uptrend recovery moving ahead. Hence, investors should expect volatility around that level and avoid adding close to that zone for now.
Revise from Hold to Buy with a medium-term PT of $65.
Be the first to comment