

GOLD PRICE OUTLOOK:
- Gold pulled back slightly from a 14-month high as prices hit a key chart resistance level
- A weaker US Dollar and heightened inflationary pressure are buoying the appeal of precious metals
- XAU/USD may see a minor pullback as prices hit the ceiling of an “Ascending Channel”
Gold prices retreated slightly during Wednesday’s Asia-Pacific trade after reaching a 14-month high. The recent surge in prices rendered the precious metal vulnerable to profit-taking at key chart resistance at $1,875. Meanwhile, traders await April’s FOMC minutes and core inflation figures from the UK, Europe and Canada later today. These may offer clues about rising price levels around the globe and could impact central banks’ monetary policy stance.
A weakening US Dollar and elevated inflationary concerns are buoying precious metal prices, sending gold and silver prices to 3-month highs earlier this week. Sentiment is likely to remain cautious as a viral resurgence in parts of Asia remains on top of traders’ mind.Taiwan reported record daily Covid-19 infections at 335 on May 17th and the government said on Tuesday that all schools will be shut until the end of this month.Demand for safety should lend support for precious metals.
The DXY US Dollar index fell to a 4-month low of 89.78, suggesting that market participants are not worried about the Fed tapering stimulus any time soon. Fed Vice Chair Richard Clarida said that the weak jobs report showed the economy was not strong enough for the Fed to start considering withdrawing its stimulus efforts. Most economists also agreed that there will be little changes to the Fed’s policy anytime soon, although there are concerns that ultra-lose monetary policy is pushing inflation too high. As such, a weakening US Dollar may continue to support gold prices in the near term.
Gold Prices vs. US 10-Year Inflation-Index Security
Source: Bloomberg, DailyFX
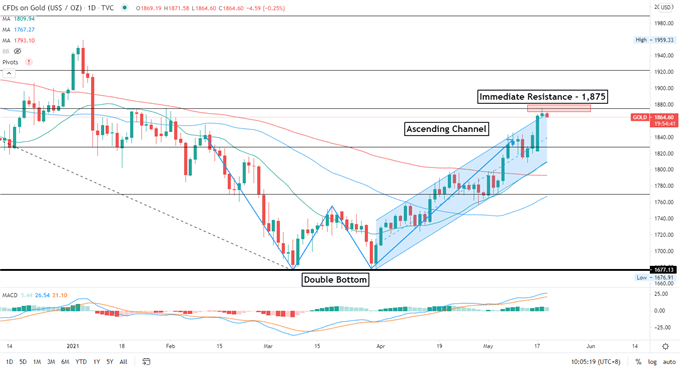
Technically, gold remains in an “Ascending Channel” as highlighted on the chart below, but it is facing a strong resistance level at $1,875 (the 50% Fibonacci retracement). Breaching above this level would likely intensify near-term buying power and open the door for further upside potential towards $ 1,922 – the 61.8% Fibonacci retracement.
The upward channel is formed by consecutive higher highs and higher lows and can be easily recognizable as a trending market. Gold price stretched beyond the ceiling of the “Ascending Channel”, suggesting that it may be temporarily overbought and thus is vulnerable to a minor pullback.
The 20-day SMA line is about to cross above the 100-day line, potentially forming a “Golden Cross” on the daily chart. A “Golden Cross” is a medium-term bullish indicator and may pave the way for further upside potential. The MACD indicator is trending higher above the neutral midpoint, suggesting that bullish momentum is prevailing.
Gold Price – Daily Chart
— Written by Margaret Yang, Strategist for DailyFX.com
To contact Margaret, use the Comments section below or @margaretyjy on Twitter
Be the first to comment