

Maximusnd
There is a lot to like and a lot not to like about Friday’s rebound in the stock market. The Treasury futures had a big reversal, closing up on the session after trading very weak in the overnight session, when you look at 10-year Treasuries. The 30s – aka the 30-year long bond – had a very weak rebound and ended up down rather significantly on the day. This is a bit puzzling, as 10s and 30s have been correlated of late.
TNX Chart (StockCharts.com)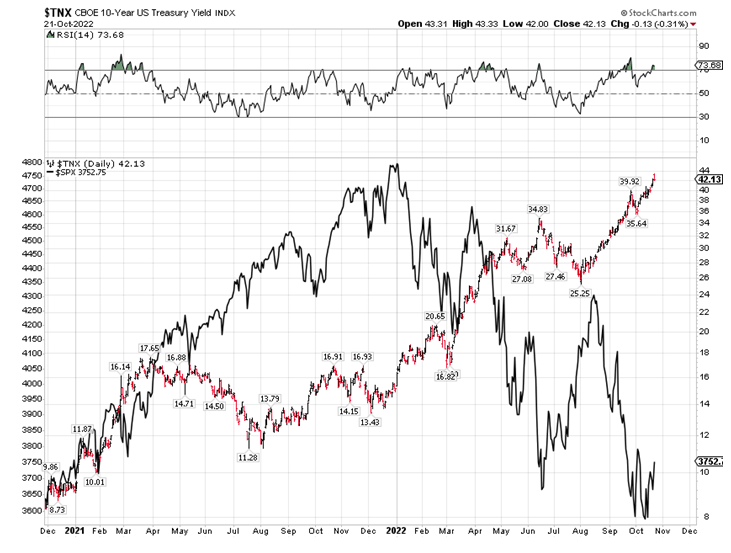
Graphs are for illustrative and discussion purposes only. Please read important disclosures at the end of this commentary.
Since stock prices and bond prices have been positively correlated of late, the stock market liked the turnaround in 10-year futures and rallied pretty decisively into the close. Positively correlated prices of stocks and bonds means an inverse correlation for stocks and yields (see chart). Yields (or rates, as traders call them) have been leading the stock market. All year, the higher the yields on Treasuries went, the more pressure there was on stocks, mostly through P/E multiple compression. At the Omicron bottom for stocks in December 2021, 10-year yields were 1.34%; on Friday morning, the 10-year made it to 4.33%.
S&P Forward 12-Month P/E Ratio – 10 years (FactSet)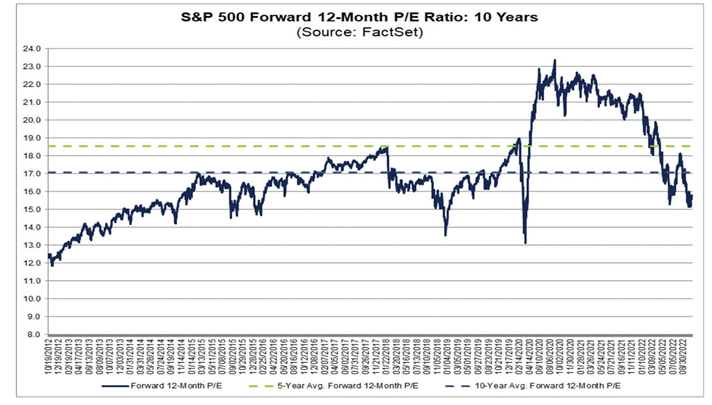
Graphs are for illustrative and discussion purposes only. Please read important disclosures at the end of this commentary.
This has to be the sharpest rise in rates from a low base ever, which has caused a historic decline in the stock market at a time of growing earnings for the major indexes. The decline in stocks in 2022 has very little to do with the economy or earnings, which have been good but more with high inflation and surging interest rates. The forward P/E multiple on the S&P 500 shrank from a high of 23 (courtesy of QE) at the end of 2020 to ballpark 15 at the recent low of the S&P 500 in October, courtesy of QT (see chart above).
If yields can decline, similar to the way they did between June and August (a huge 96 basis points on the 10-year; see chart), stocks can also rebound significantly from their present levels. If I were pressed to give a target for the rebound, I’d say the S&P 500 can make it to 4150. The two factors that can spoil this bottoming scenario for stocks are named Jerome Powell and Vladimir Putin. Jay has been making way too many mistakes for a central banker, and one more could pressure the stock market. He needs to pivot and back off, as I think he is seriously running the risk of over-tightening. The FOMC press conference in November surely gives him the opportunity to clarify matters; he just needs to take the plunge.
As for Vlad, I don’t think he is giving up on Ukraine. The situation is going to get ugly as the war is escalating, with Russians hitting power stations with drones and missiles as winter is approaching. This is important for financial markets, as it can move oil and currency markets disproportionately.
When Bond Volatility is More than Double Stock Volatility
You don’t see bonds trading with more volatility than stocks very often, but this is precisely what is happening now, courtesy of QT and the most aggressive Fed tightening cycle in history (accounting for the level of interest rates when it started). Many investors know what the VIX index is, and that when it rises that is typically associated with falling stock prices. Not many know what the MOVE index is, but for the sake of simplicity, it is similar to the VIX but for Treasury prices. Right now, the MOVE index is where it was in March of 2020, when the VIX was near its peak of 80. On Friday, the VIX closed at 29.69.
MOVE Chart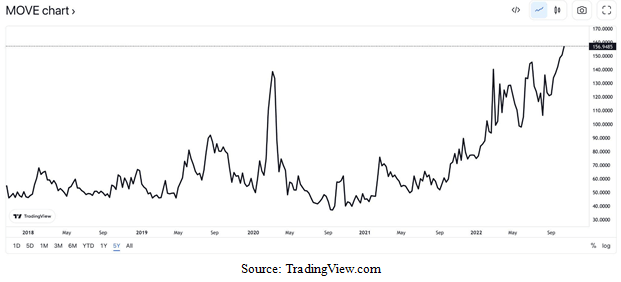
Graphs are for illustrative and discussion purposes only. Please read important disclosures at the end of this commentary.
The volatility in bonds is up five-fold since late 2020, when the Fed’s QE operations were suppressing the volatility in all markets. If QE suppresses the volatility of stocks and bonds, QT does the opposite; it increases it; and in this case, it is increasing the volatility of bonds more than the volatility of stocks.
Since QT is not over, I don’t think the MOVE index will normalize anytime soon, but it does have the opportunity to decline some if the Fed pivots at the November FOMC meeting.
All content above represents the opinion of Ivan Martchev of Navellier & Associates, Inc.
Disclosure: *Navellier may hold securities in one or more investment strategies offered to its clients.
Disclaimer: Please click here for important disclosures located in the “About” section of the Navellier & Associates profile that accompany this article.
Editor’s Note: The summary bullets for this article were chosen by Seeking Alpha editors.
Be the first to comment