

Dzmitry Dzemidovich
REIT Performance
The REIT sector trimmed 2022 losses with a very strong July rebound as REITs averaged a +9.74% total return. REITs outperformed the Dow Jones Industrial Average (+6.8%) and the S&P 500 (+9.2%) in July, but were outpaced by the NASDAQ (+12.4%). The market cap weighted Vanguard Real Estate ETF (VNQ) saw smaller gains than the average REIT in July (+8.62% vs. +9.74%) and remains deeper in the red YTD (-13.69% vs. -10.94%). The spread between the 2022 FFO multiples of large cap REITs (20.7x) and small cap REITs (14.5x) widened in July as multiples increased by 1.3 turns for large caps and only 0.1 turns for small caps. In this monthly publication, I will provide REIT data on numerous metrics to help readers identify which property types and individual securities currently offer the best opportunities to achieve their investment goals.
Graph by Simon Bowler of 2nd Market Capital, Data compiled from S&P Global Market Intelligence LLC. See important notes and disclosures at the end of this article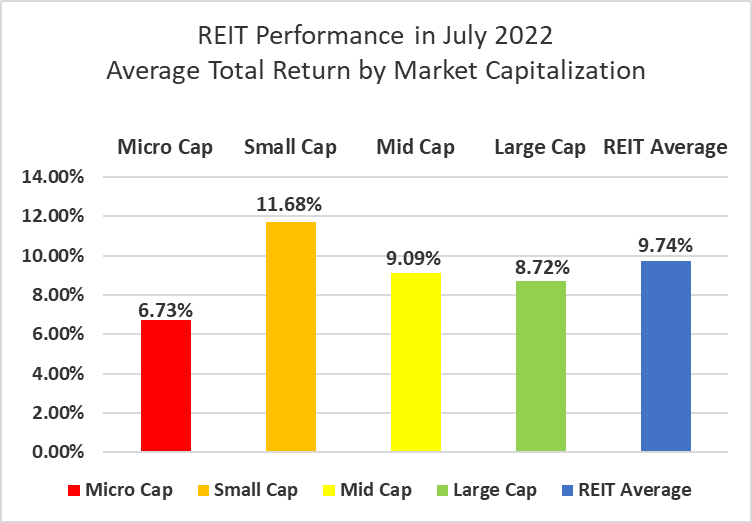
Small cap REITs soared (+11.68%) with a double digit return in July. Mid cap (+9.09%), large cap (+8.72%) and micro cap (+6.73%) REITs all saw high single-digit positive returns as well. Small cap REITs (-9.98%) are outperforming large caps (-10.66%) by 68 basis points on YTD 2022 total return.
Graph by Simon Bowler of 2nd Market Capital, Data compiled from S&P Global Market Intelligence LLC. See important notes and disclosures at the end of this article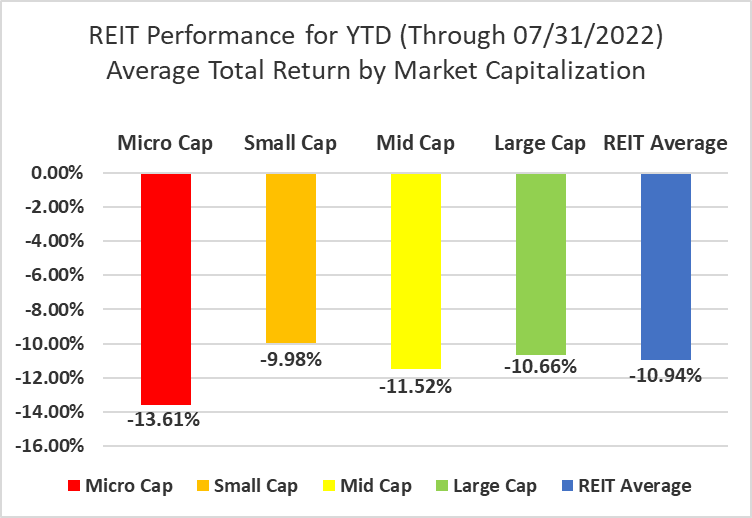
19 out of 19 Property Types Yielded Positive Total Returns in July
100 percent of REIT property types averaged a positive total return in July, with a 31.51% total return spread between the best and worst performing property types. Student Housing (+1.32%) and Data Center (+2.91%) REITs had the worst average total returns in July as every single REIT property type was in the black.
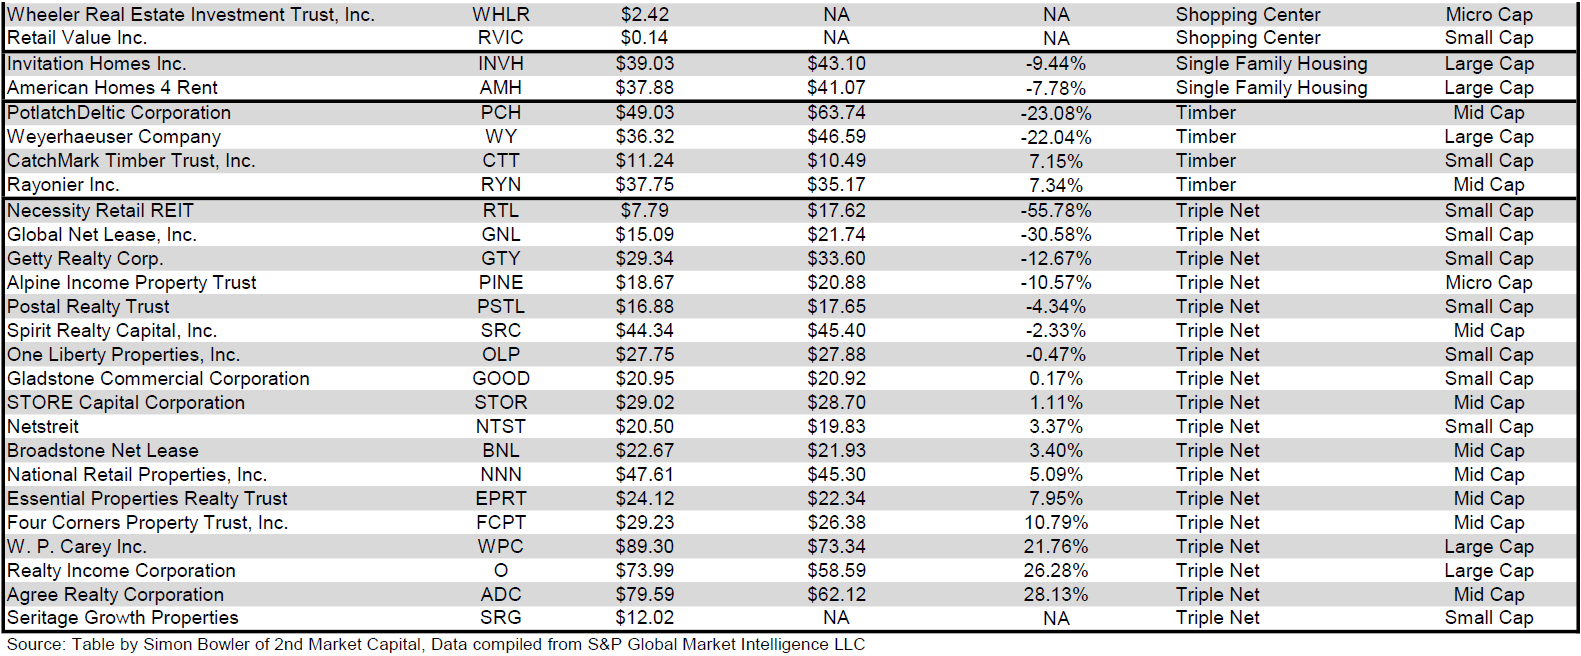
Mall (+32.83%) and Triple Net (+17.03%) REITs led all property types in July as the REIT sector and broader market rebounded from a brutal first half of 2022. Pennsylvania REIT (PEI) (+62.69%) was the top performer among the Malls in July, followed by strong performances from CBL & Associates Properties (CBL) (+32.35%), Macerich (MAC) (+21.81%) and Simon Property Group (SPG) (+14.45%).
Table by Simon Bowler of 2nd Market Capital, Data compiled from S&P Global Market Intelligence LLC. See important notes and disclosures at the end of this article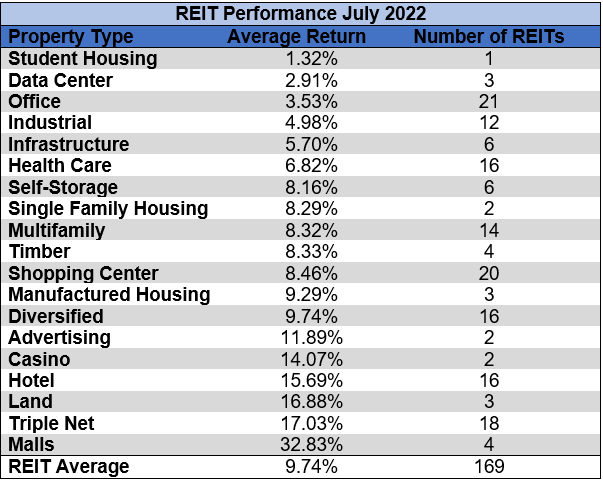
After the first seven months of the year, Student Housing (+14.02%), Casino (+9.97%) and Timber (+0.35%) REITs are the only property types in positive territory. Malls (-33.01%) and Infrastructure (-27.01%) REITs are the worst performing property types thus far in 2022.
Table by Simon Bowler of 2nd Market Capital, Data compiled from S&P Global Market Intelligence LLC. See important notes and disclosures at the end of this article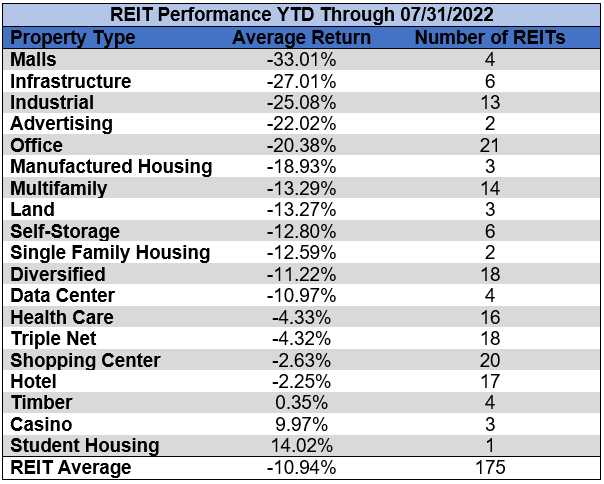
The REIT sector as a whole saw the average P/FFO (2022) increase 0.7 turns in June (from 15.4x up to 16.1x). The average FFO multiples rose for 94% and declined for 6% of property types in July. There are no recent 2022 FFO/share estimates for either of the Advertising REITs. Land (37.7x), Student Housing (26.3x), Industrial (24.7x) and Timber (23.9x) currently trade at the highest multiples of any REIT property type. Mall (5.4x), Hotel (9.2x) and Office (9.6x) REITs are the only property types currently trading at a single digit multiple.
Table by Simon Bowler of 2nd Market Capital, Data compiled from S&P Global Market Intelligence LLC. See important notes and disclosures at the end of this article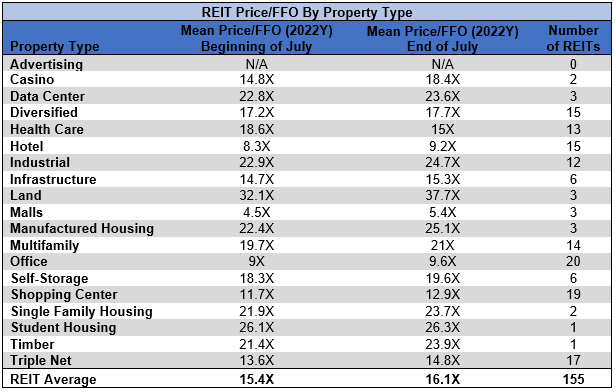
Performance of Individual Securities
PS Business Parks (PSB) was acquired on July 20th by Blackstone (BX) for $187.50/share in an all-cash deal, continuing Blackstone’s REIT acquisition spree.
Healthcare Trust of America (HTA) merged with Healthcare Realty Trust (HR) on July 20th to form the largest pure play medical office REIT. HTA shareholders received shares of HR in a 1-for-1 exchange as well as a $4.82/share special dividend. The combined entity retained the Healthcare Realty Trust name and trades under the ticker symbol HR.
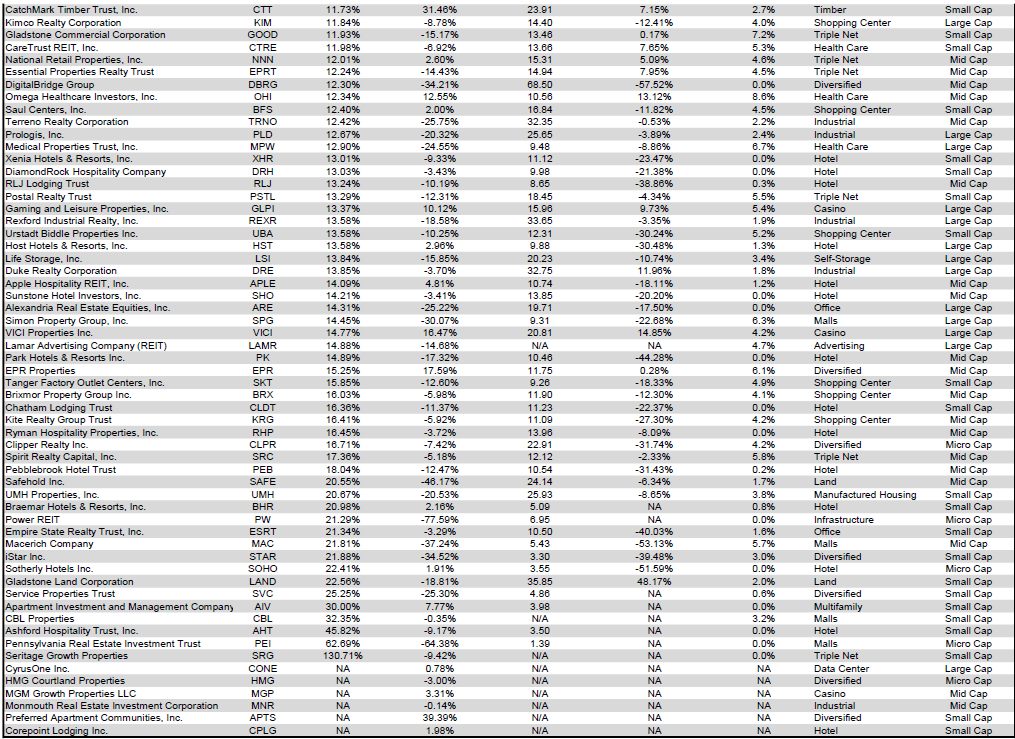
Seritage Growth Properties (SRG) (+130.71%) soared on the July 7th filing of preliminary proxy materials in which the board of trustees unanimously recommended that shareholders vote to approve a proposed plan of sale of all SRG assets, distribution of all net proceeds to shareholders and dissolution of the company. This conclusion of a review of strategic alternatives that was previously announced in March 2022 was very well received by shareholders, more than doubling the share price by the end of July. However, despite the remarkable share price performance in July, SRG is still down -9.42% in 2022.
New York City REIT (NYC) (-28.95%) announced the suspension of its dividend on July 1st in order to retain enough capital to fund tenant improvements and leasing commissions. Continued poor fundamental performance coupled with dividend suspension sent the struggling REIT deeper into negative territory. NYC is now the 3rd worst performing REIT in 2022 with a -64.22% total return.
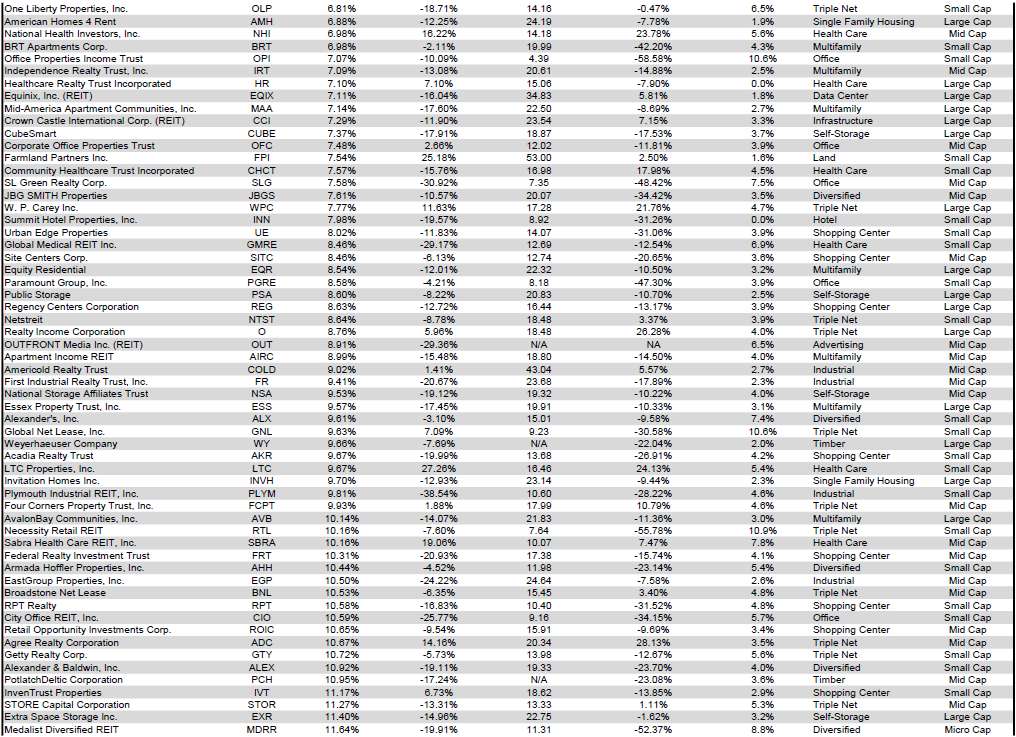
91.72% of REITs had a positive return in July, but only 24.57% are in the black year to date. During the first seven months of last year the average REIT had a +27.38% return, whereas this year the average REIT has seen a -10.94% total return.
Table by Simon Bowler of 2nd Market Capital, Data compiled from S&P Global Market Intelligence LLC. See important notes and disclosures at the end of this article Table by Simon Bowler of 2nd Market Capital, Data compiled from S&P Global Market Intelligence LLC. See important notes and disclosures at the end of this article Table by Simon Bowler of 2nd Market Capital, Data compiled from S&P Global Market Intelligence LLC. See important notes and disclosures at the end of this article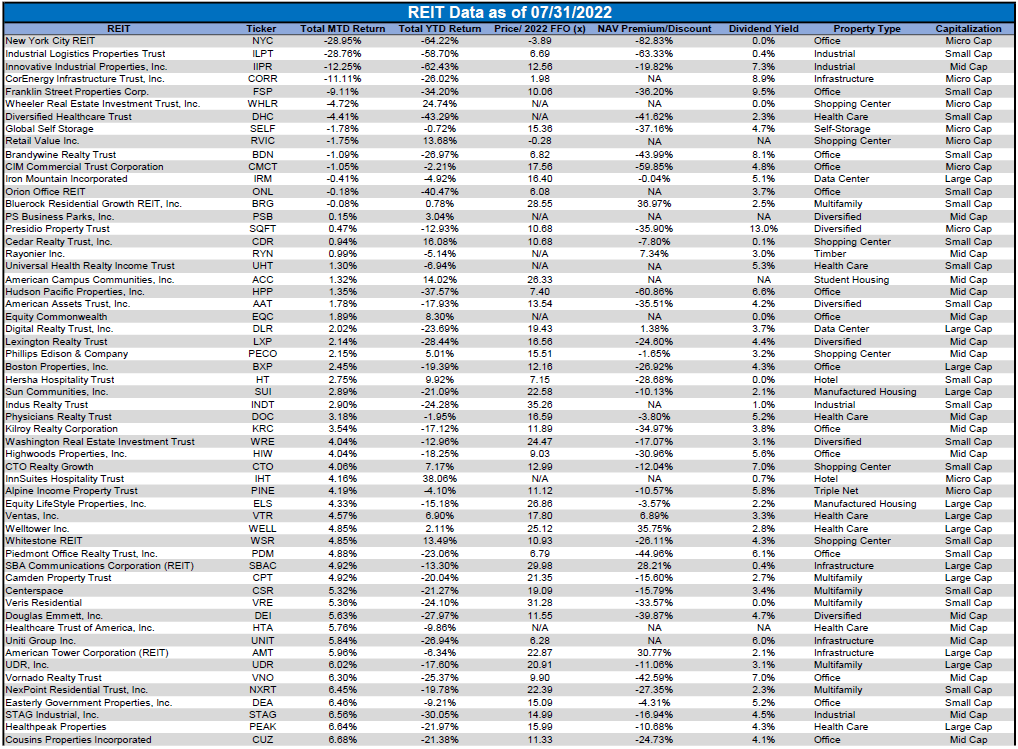
For the convenience of reading this table in a larger font, the table above is available as a PDF as well.
Dividend Yield
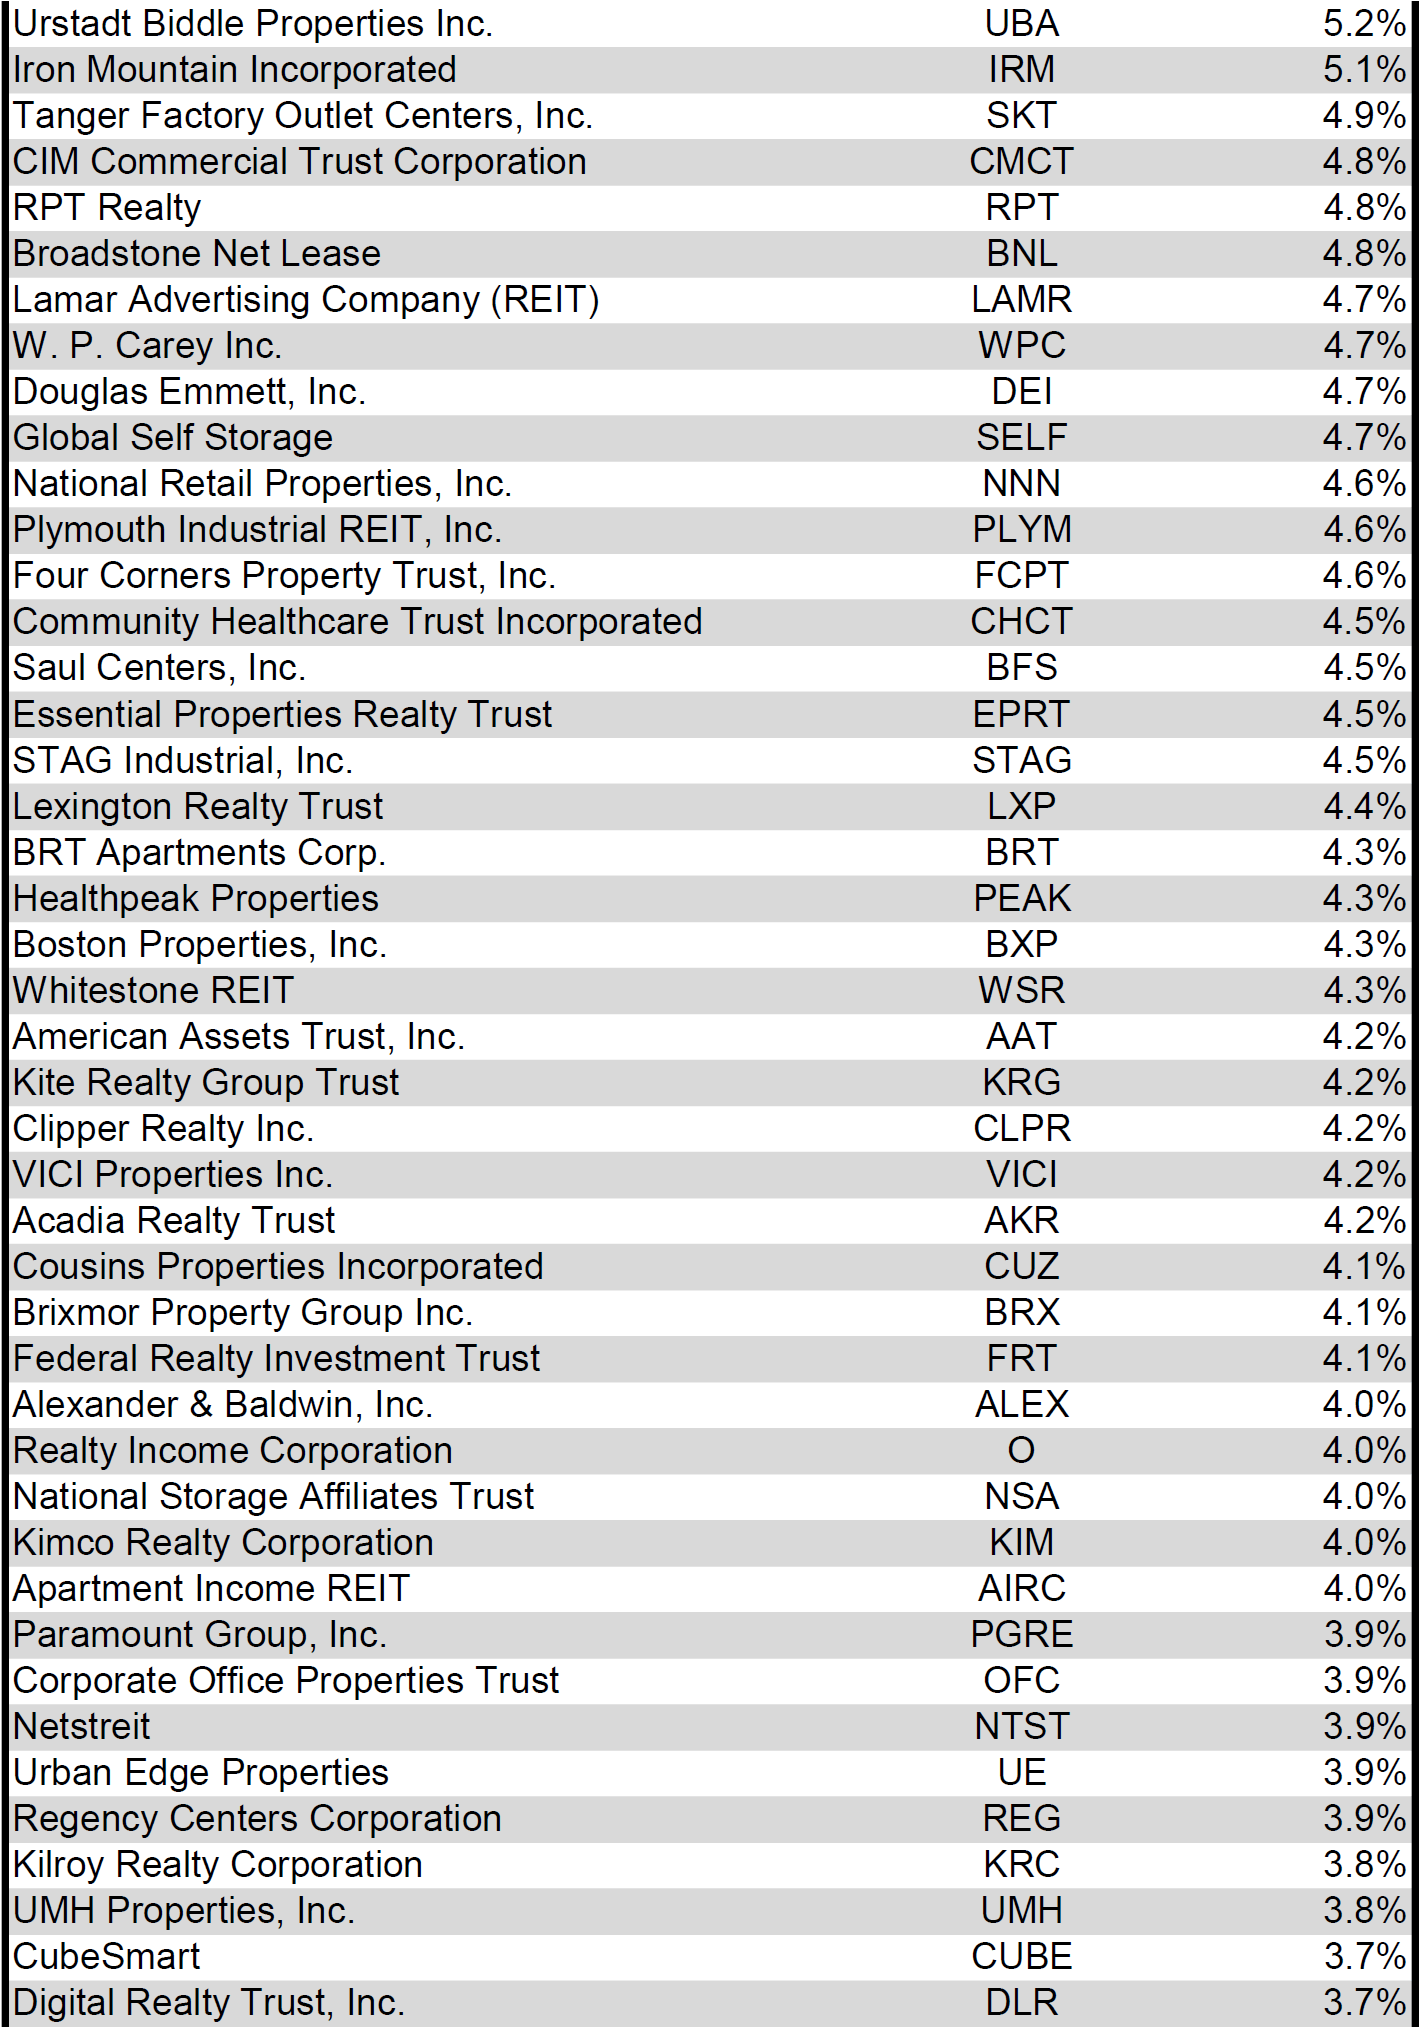
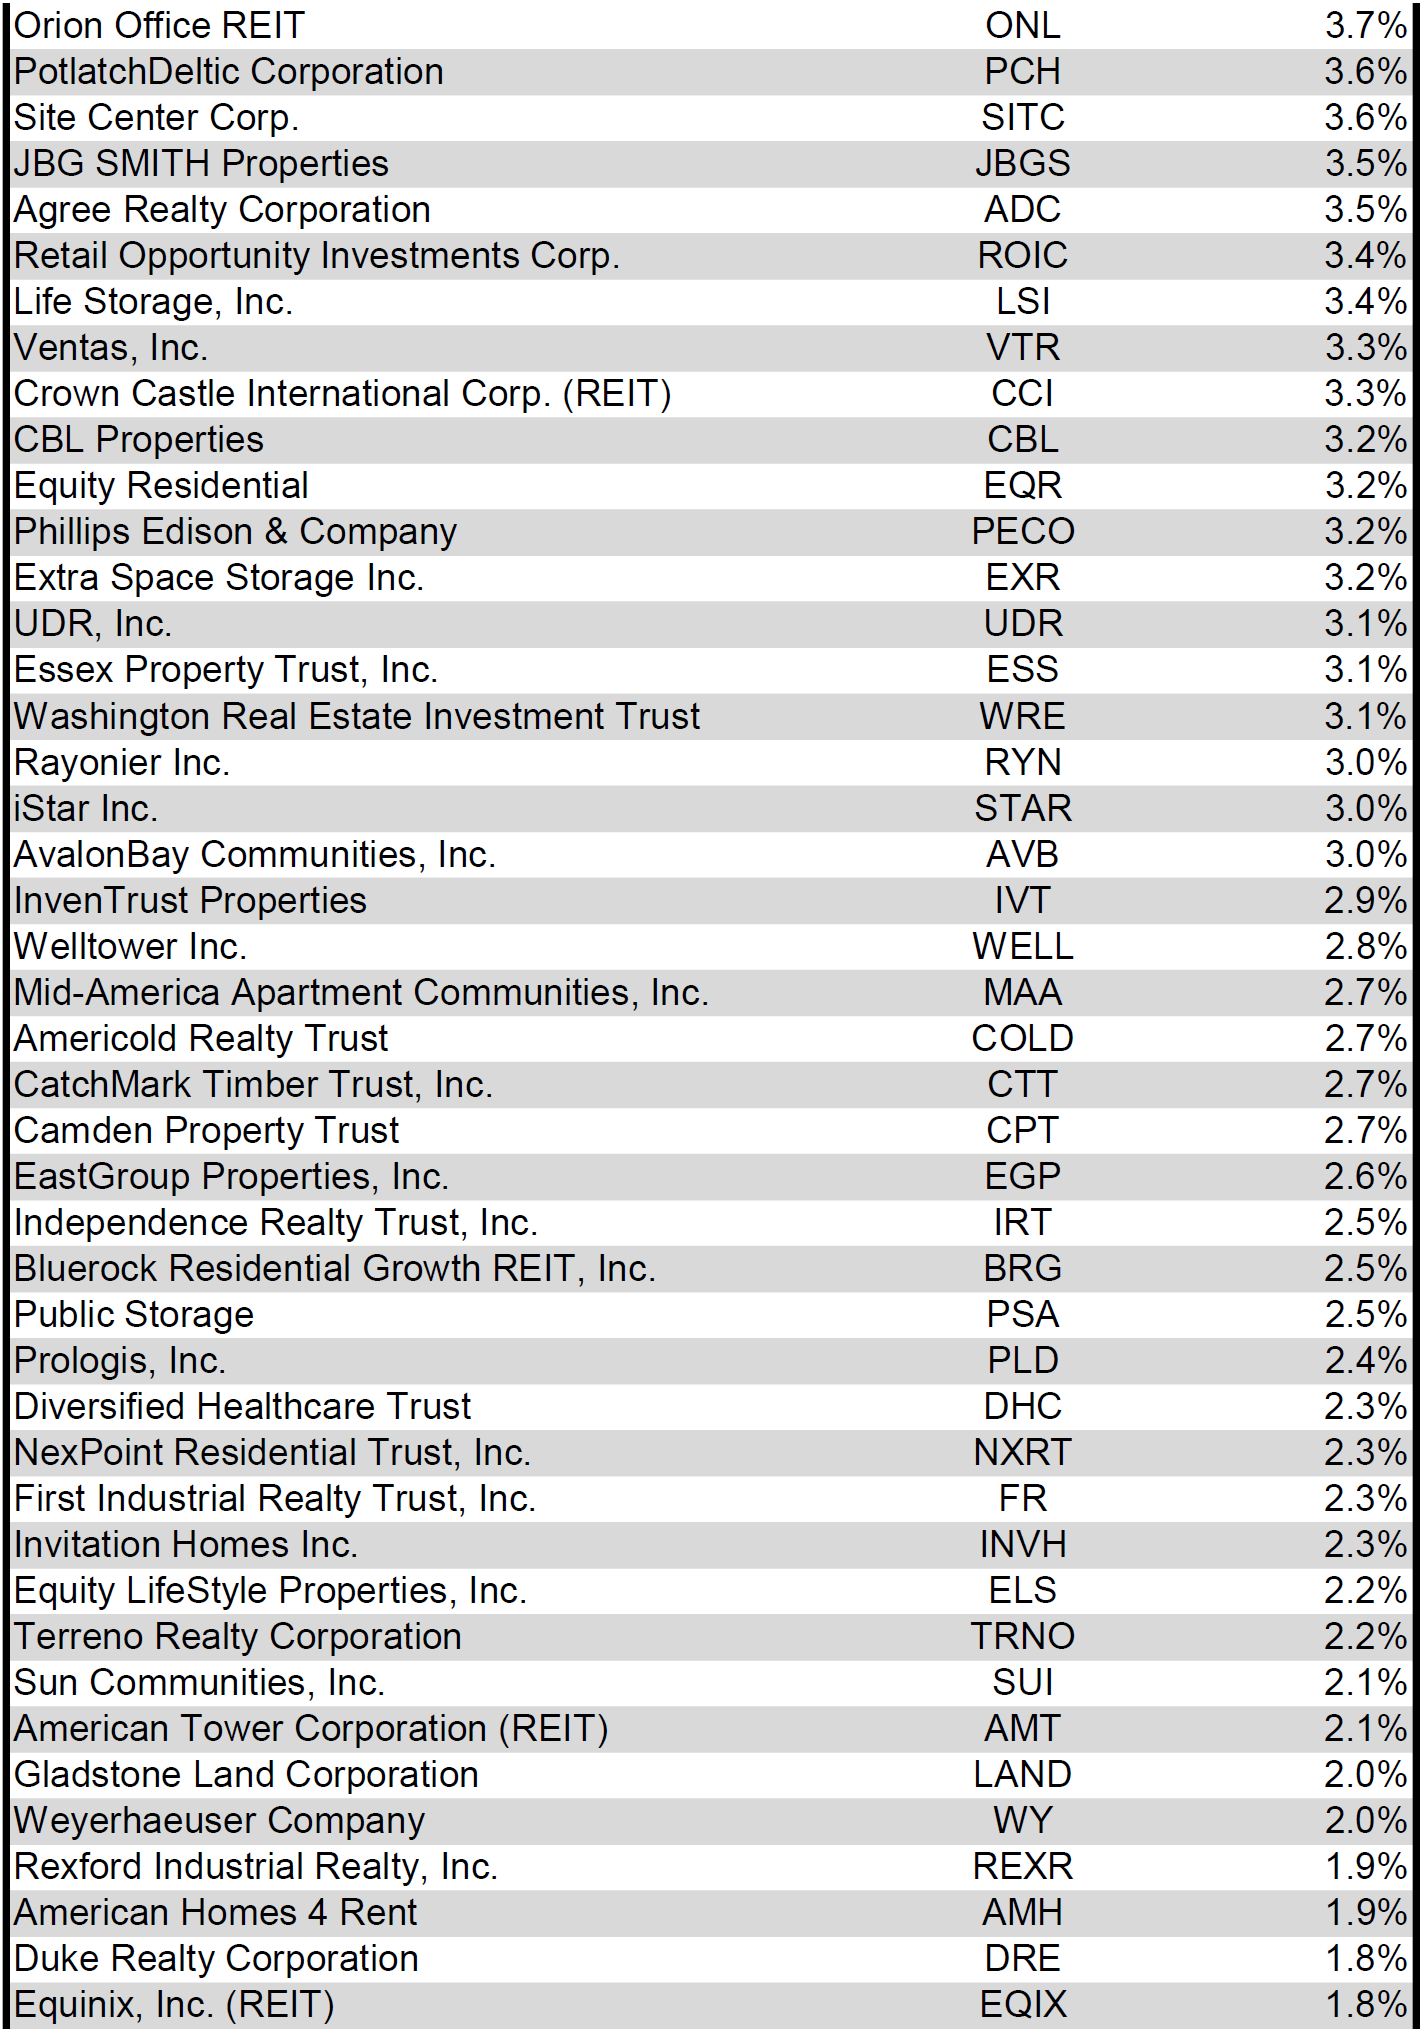
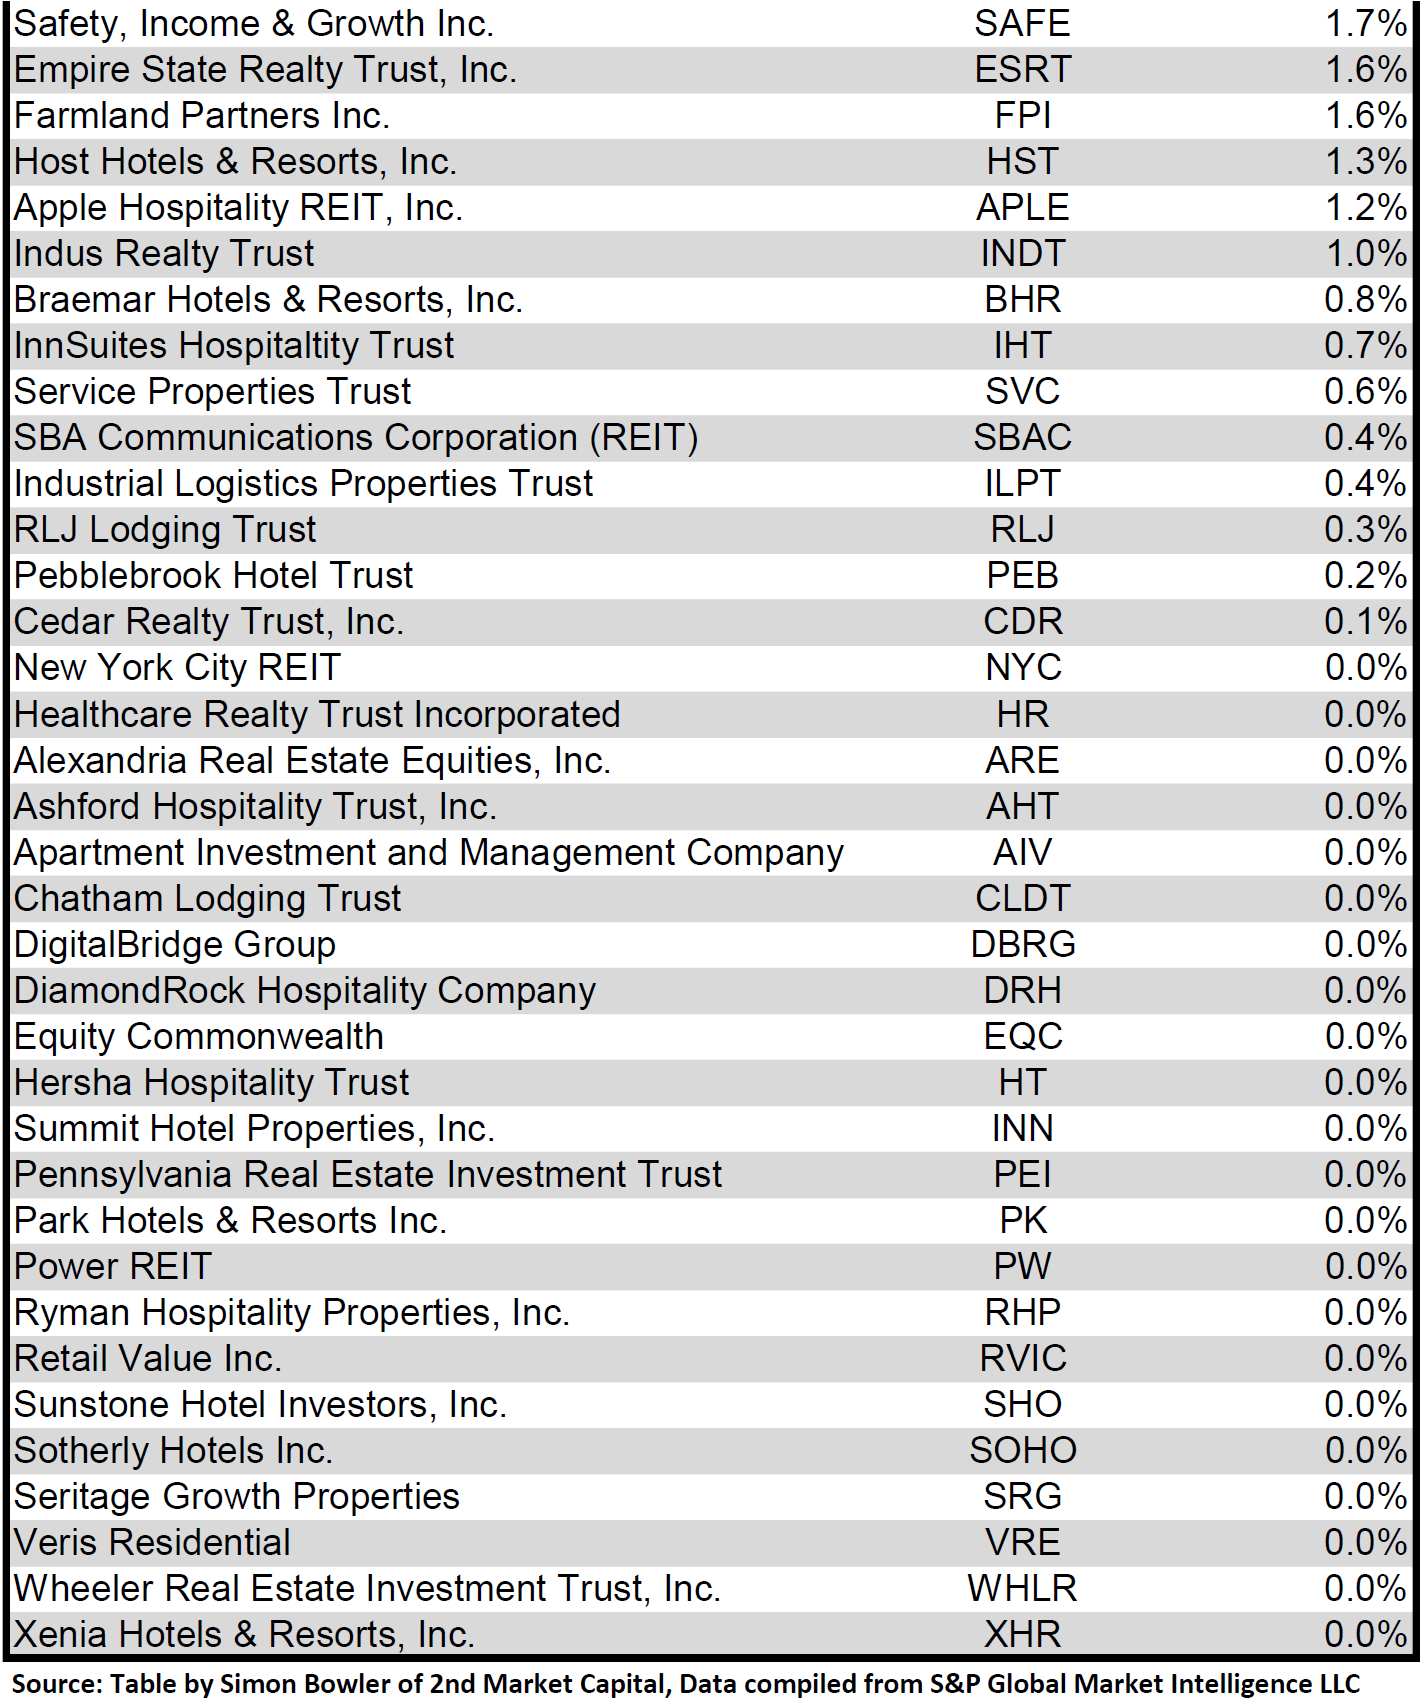
Dividend yield is an important component of a REIT’s total return. The particularly high dividend yields of the REIT sector are, for many investors, the primary reason for investment in this sector. As many REITs are currently trading at share prices well below their NAV, yields are currently quite high for many REITs within the sector. Although a particularly high yield for a REIT may sometimes reflect a disproportionately high risk, there exist opportunities in some cases to capitalize on dividend yields that are sufficiently attractive to justify the underlying risks of the investment. I have included below a table ranking equity REITs from highest dividend yield (as of 07/31/2022) to lowest dividend yield.
Table by Simon Bowler of 2nd Market Capital, Data compiled from S&P Global Market Intelligence LLC. See important notes and disclosures at the end of this article Table by Simon Bowler of 2nd Market Capital, Data compiled from S&P Global Market Intelligence LLC. See important notes and disclosures at the end of this article Table by Simon Bowler of 2nd Market Capital, Data compiled from S&P Global Market Intelligence LLC. See important notes and disclosures at the end of this article Table by Simon Bowler of 2nd Market Capital, Data compiled from S&P Global Market Intelligence LLC. See important notes and disclosures at the end of this article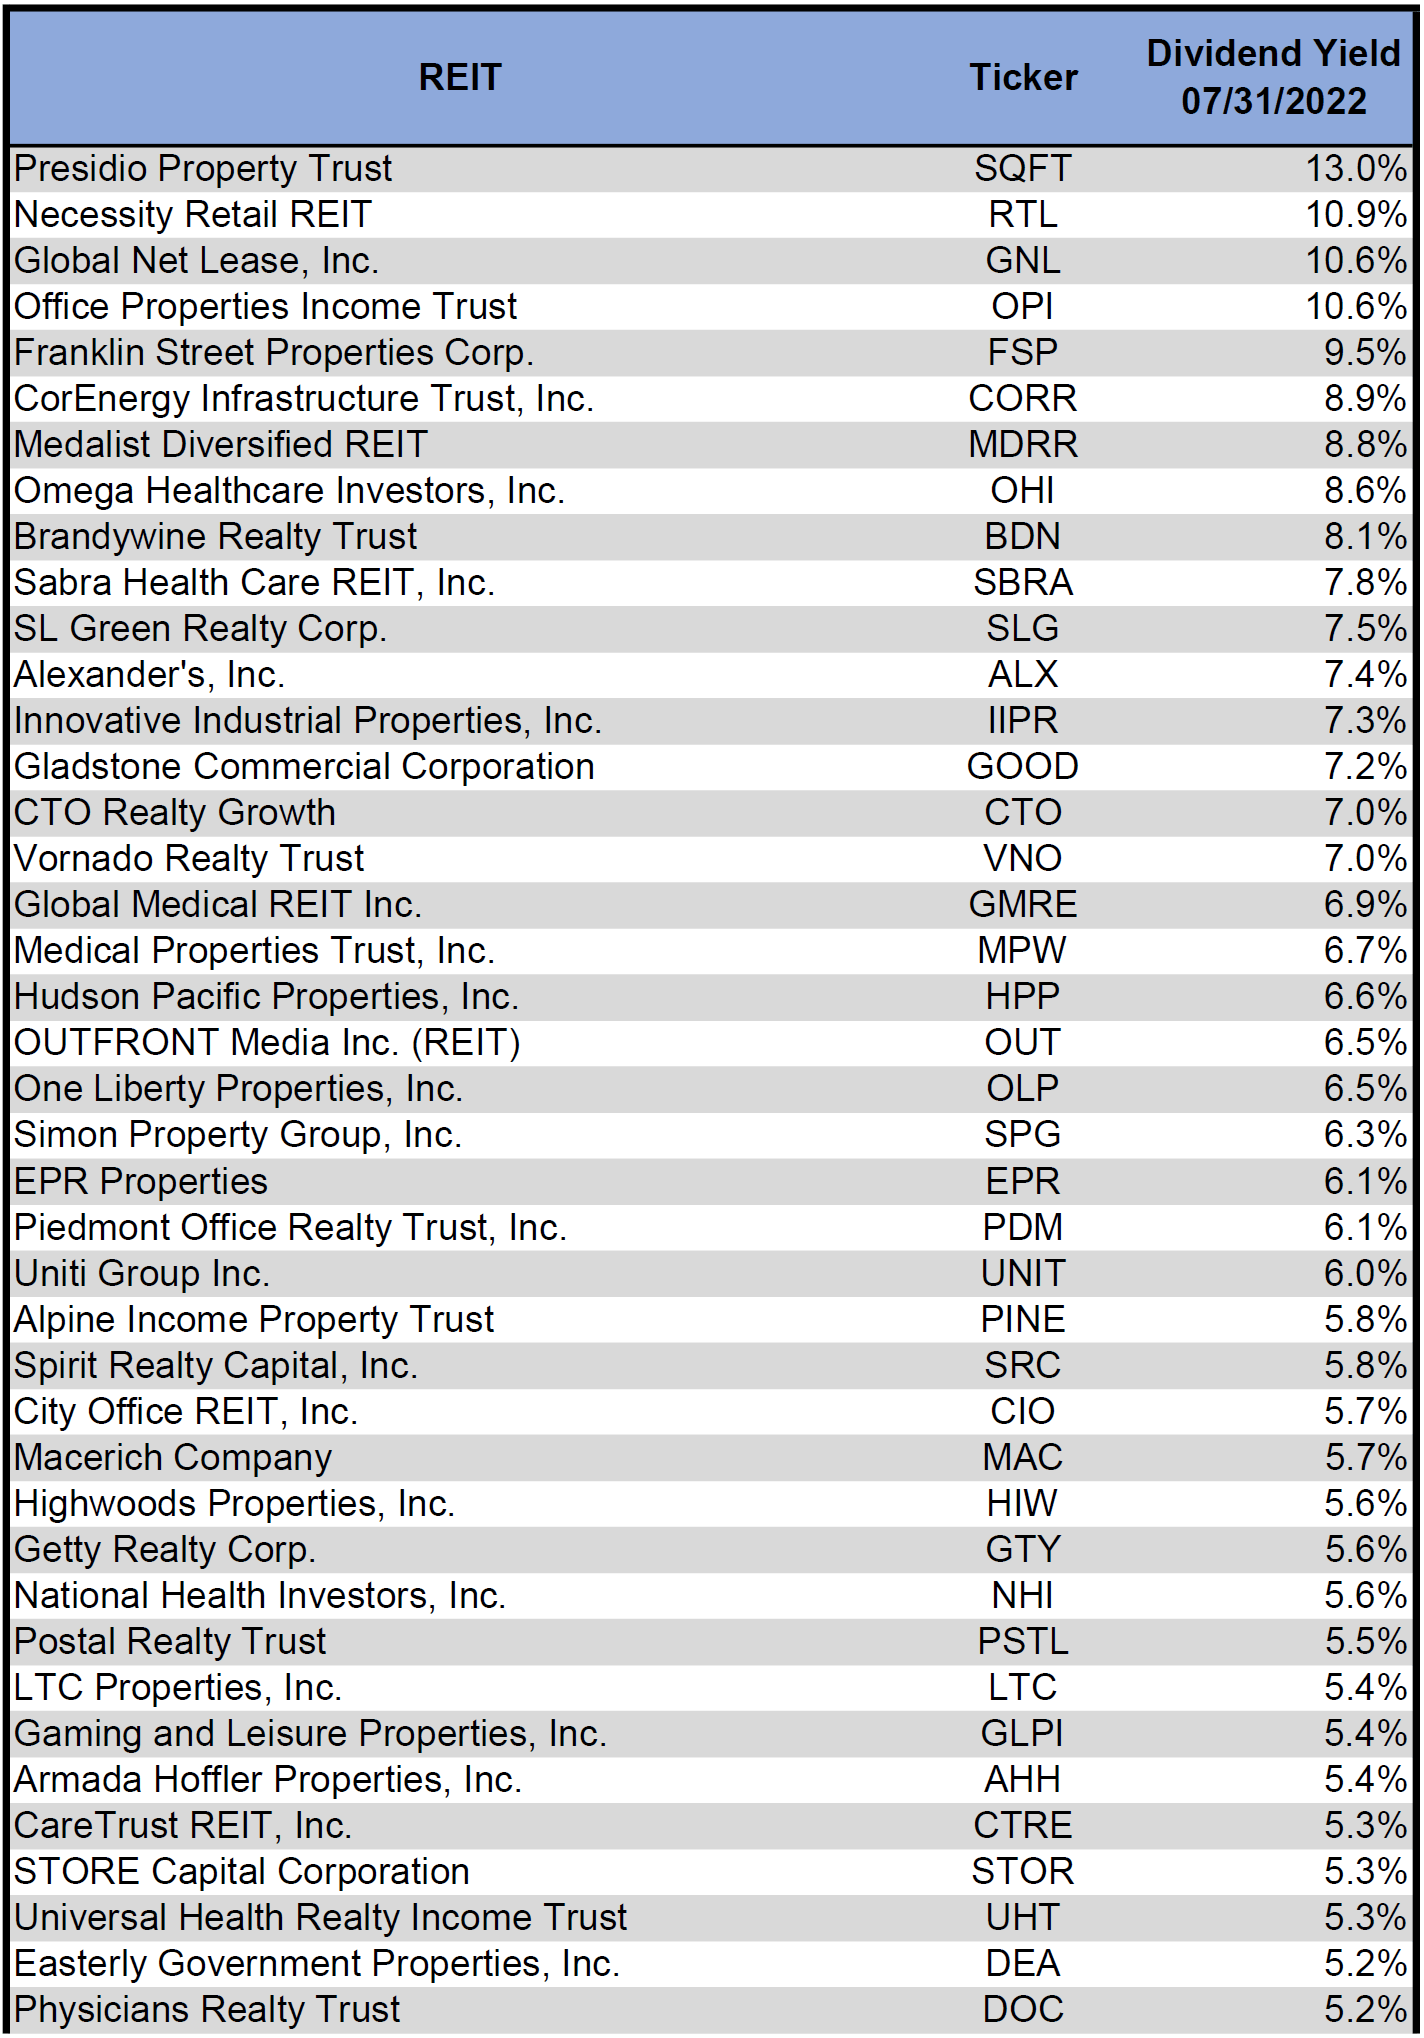
For the convenience of reading this table in a larger font, the table above is available as a PDF as well.
Although a REIT’s decision regarding whether to pay a quarterly dividend or a monthly dividend does not reflect on the quality of the company’s fundamentals or operations, a monthly dividend allows for a smoother cash flow to the investor. Below is a list of equity REITs that pay monthly dividends ranked from highest yield to lowest yield.
Table by Simon Bowler of 2nd Market Capital, Data compiled from S&P Global Market Intelligence LLC. See important notes and disclosures at the end of this article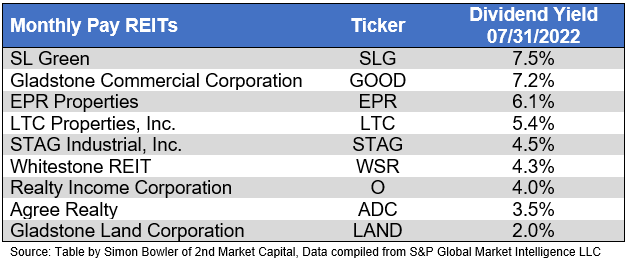
Valuation
REIT Premium/Discount to NAV by Property Type
Below is a downloadable data table, which ranks REITs within each property type from the largest discount to the largest premium to NAV. The consensus NAV used for this table is the average of analyst NAV estimates for each REIT. Both the NAV and the share price will change over time, so I will continue to include this table in upcoming issues of The State of REITs with updated consensus NAV estimates for each REIT for which such an estimate is available.
Table by Simon Bowler of 2nd Market Capital, Data compiled from S&P Global Market Intelligence LLC. See important notes and disclosures at the end of this article Table by Simon Bowler of 2nd Market Capital, Data compiled from S&P Global Market Intelligence LLC. See important notes and disclosures at the end of this article Table by Simon Bowler of 2nd Market Capital, Data compiled from S&P Global Market Intelligence LLC. See important notes and disclosures at the end of this article Table by Simon Bowler of 2nd Market Capital, Data compiled from S&P Global Market Intelligence LLC. See important notes and disclosures at the end of this article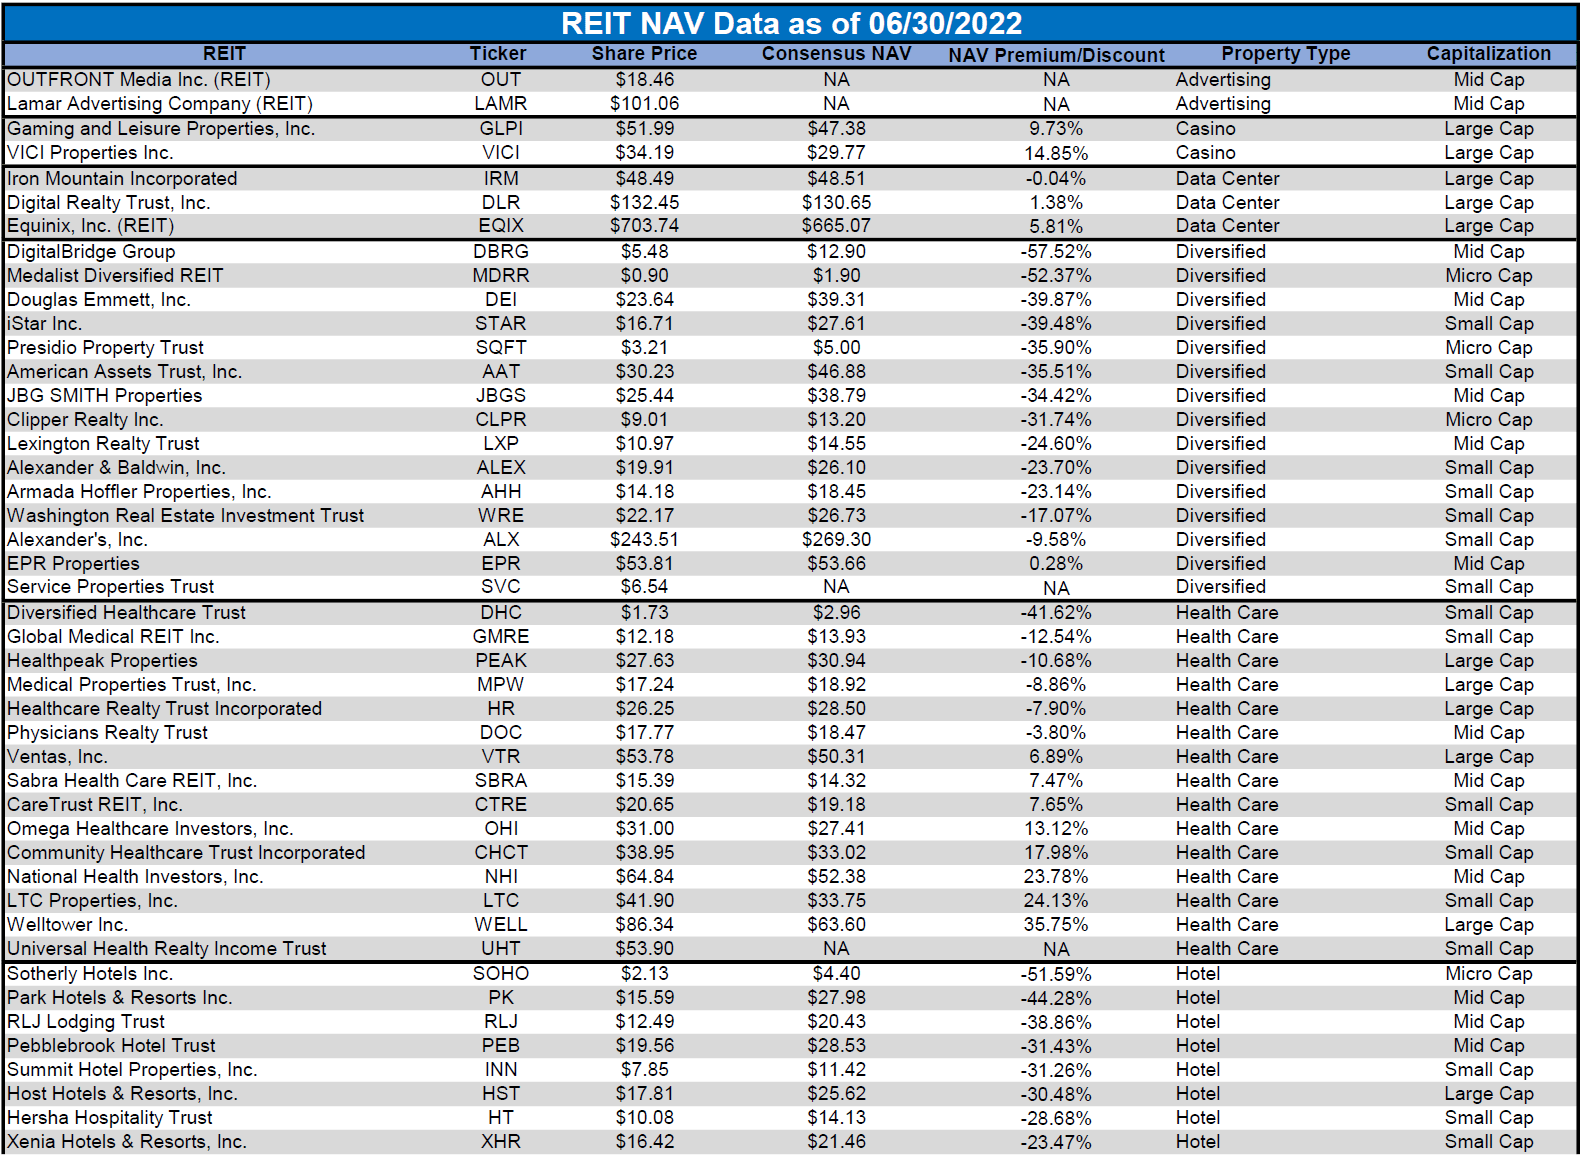
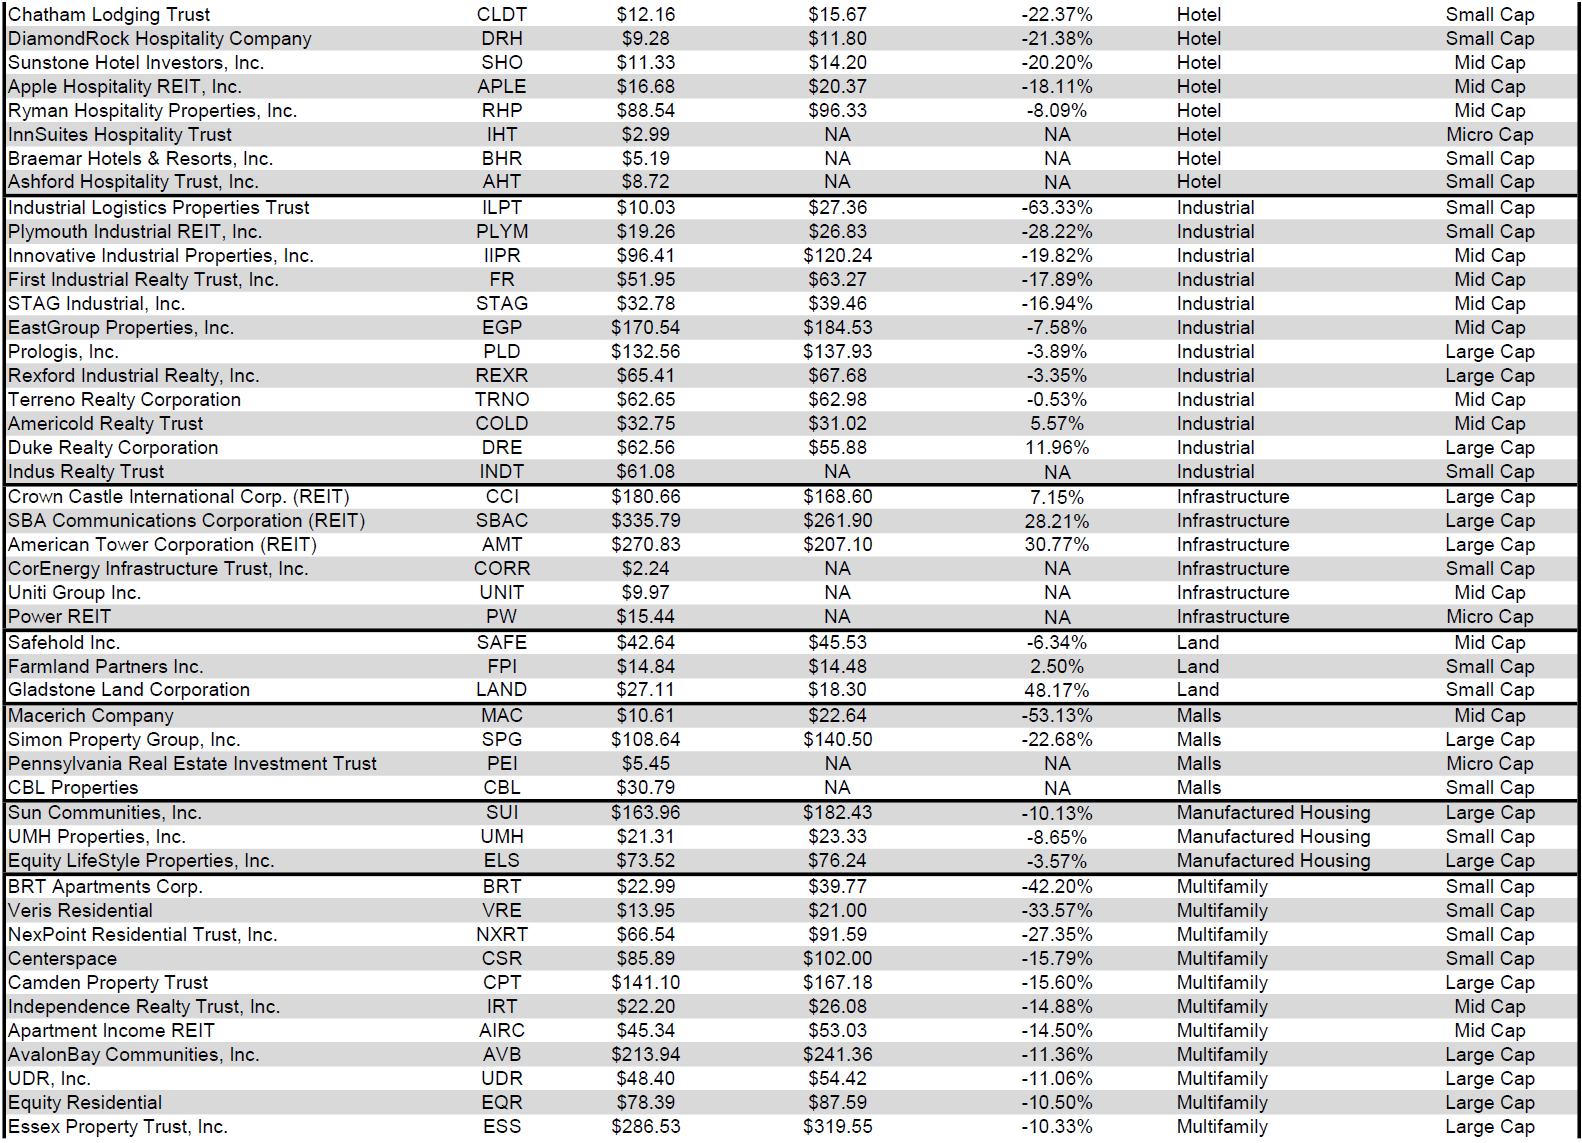
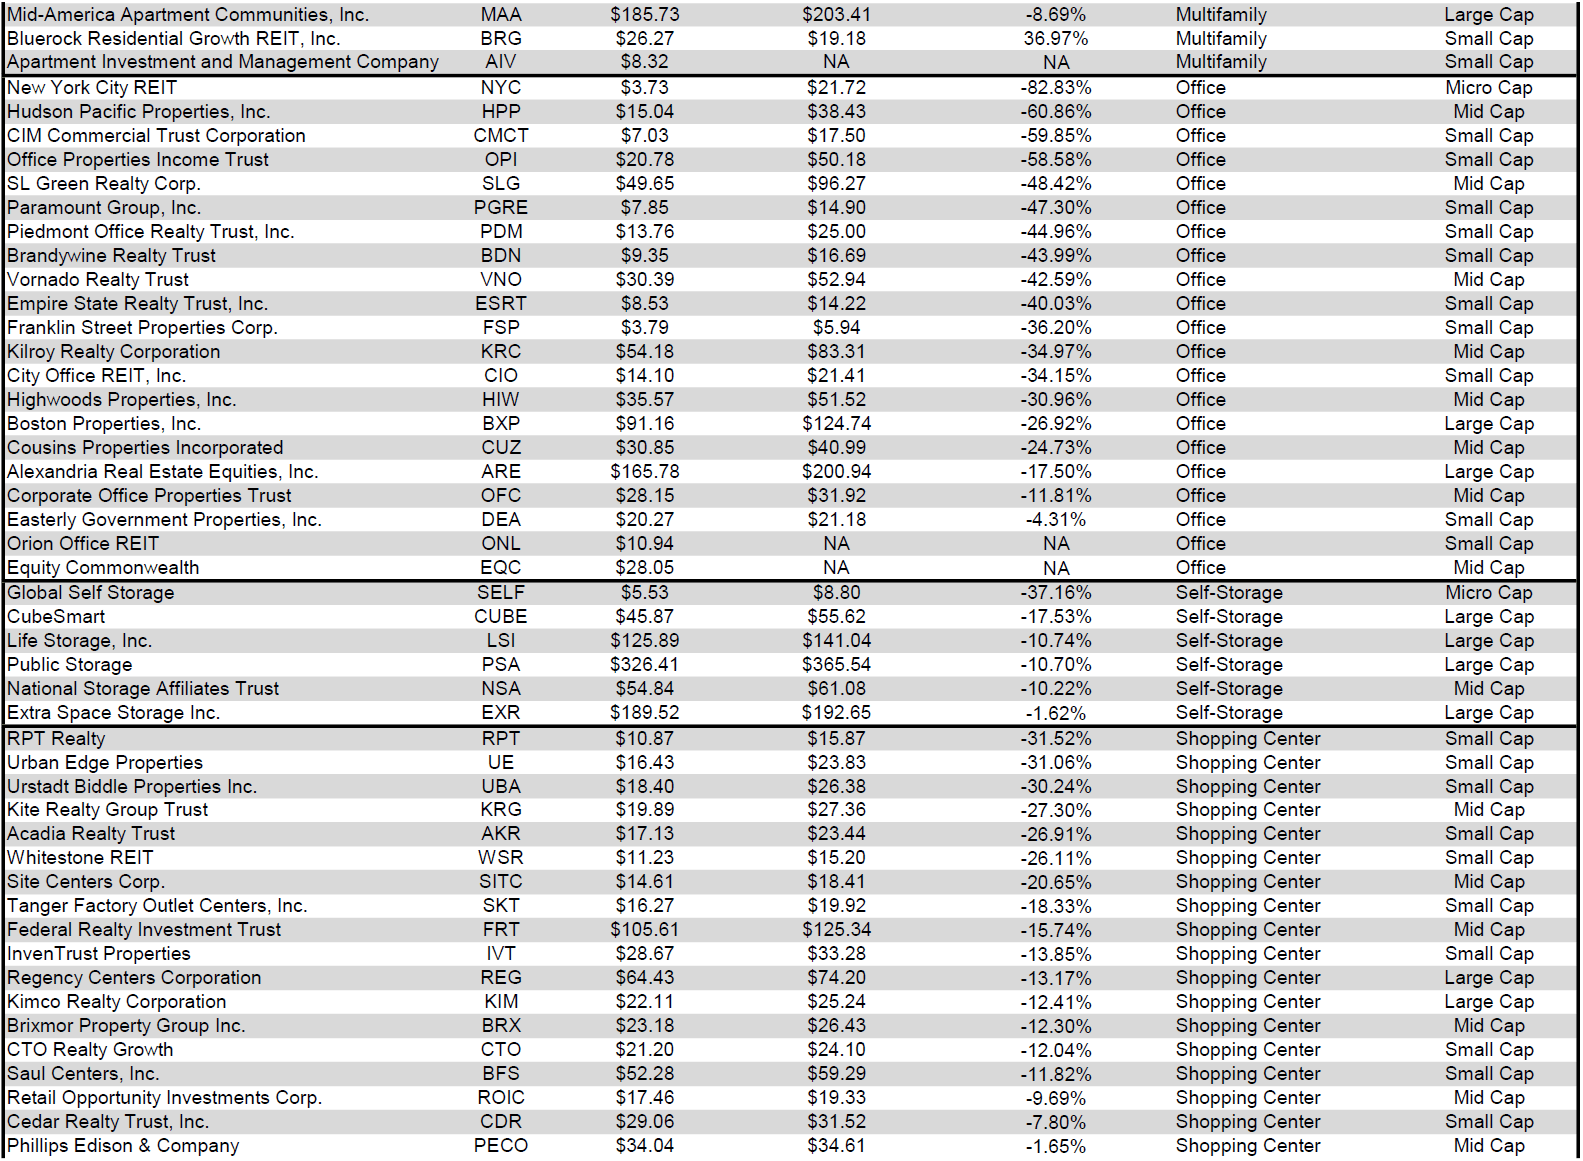
For the convenience of reading this table in a larger font, the table above is available as a PDF as well.
Takeaway
The large cap REIT premium (relative to small cap REITs) widened in July and investors are now paying on average about 43% more for each dollar of 2022 FFO/share to buy large cap REITs than small cap REITs (20.7x/14.5x – 1 = 42.8%). As can be seen in the table below, there is presently a strong positive correlation between market cap and FFO multiple.
Table by Simon Bowler of 2nd Market Capital, Data compiled from S&P Global Market Intelligence LLC. See important notes and disclosures at the end of this article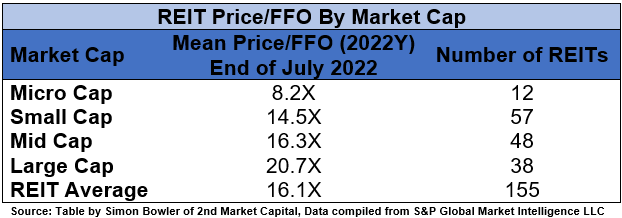
The table below shows the average premium/discount of REITs of each market cap bucket. This data, much like the data for price/FFO, shows a strong, positive correlation between market cap and Price/NAV. The average large cap REIT (-3.04%) trades at a single digit discount to NAV, while mid cap REITs (-15.33%) and small cap REITs (-19.69%) trade at double-digit discounts. Micro caps on average trade at less than 3/5 of their respective NAVs (-45.25%).
Table by Simon Bowler of 2nd Market Capital, Data compiled from S&P Global Market Intelligence LLC. See important notes and disclosures at the end of this article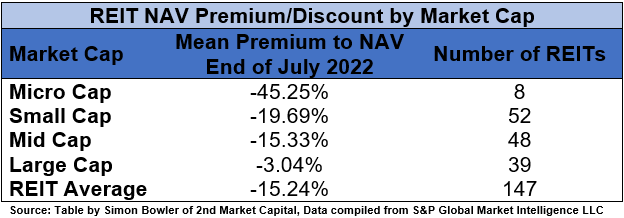
The vast majority of REITs pay a common dividend and many also have preferred shares that pay dividends as well. The yields on these dividends vary greatly from as low as 0.1% from Cedar Realty Trust (CDR) to as high as double digits for REITs such as Presidio Property Trust (SQFT) and Global Net Lease (GNL). Some REITs temporarily suspended their dividends during the government-imposed lockdowns of 2020 and the resulting market crash, but then re-instated their dividends when financial markets started to stabilize. However, there are other REITs such as Wheeler REIT (WHLR) and Ashford Hospitality Trust (AHT) that suspended their common dividends years ago and have yet to re-instate them.
S&P Global Market Intelligence LLC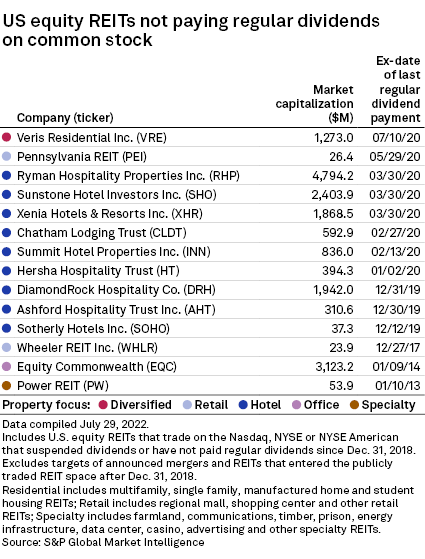
Although 2020 saw a significant number of dividend cuts, we have seen far fewer since the end of 2020. In addition to the 4 equity REITs that cut their common dividends in 2021, Industrial Logistics Properties Trust (ILPT) announced the first REIT dividend cut of 2022 on July 14th. ILPT slashed the dividend by an enormous 97% reduction.
S&P Global Market Intelligence LLC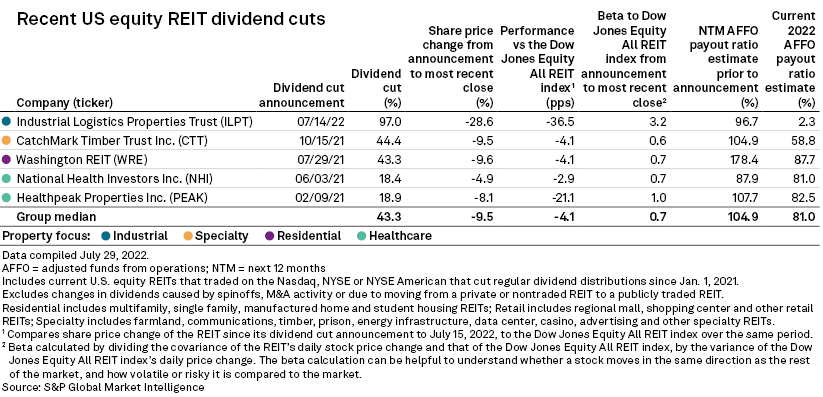
However, due largely to the strength of REIT fundamentals, there have been far more dividend hikes than cuts. This includes 7 dividend raises in July.
S&P Global Market Intelligence LLC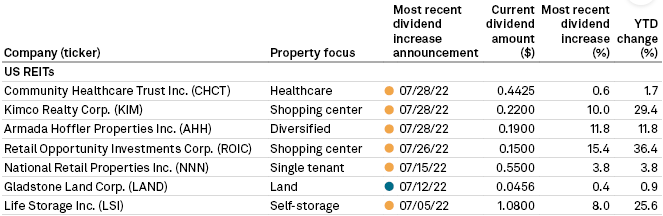
In addition to the inflation hedge provided by real estate due to rising asset values and rapidly increasing tenant rents, they can also be a great source of dividend growth. 5 of the 7 REITs that hiked their dividends in July had already raised their dividends at least once already earlier this year. Based on the strength of Q2 REIT earnings, we will likely see many more dividend hikes within the REIT sector before the end of the year.
Be the first to comment