

davidrasmus
In our previous article we formulated a bearish case on the SPDR S&P 500 Trust ETF (NYSEARCA:SPY) due to various valuation and macroeconomic concerns. After a sharp price increase during the recent month, we felt it necessary to review our stance. We remain bearish on the S&P 500 index and the SPY collectively as we believe the recent surge is overdone and somewhat premature.
For the purpose of this article, we’ll once again assume the SPY and S&P 500 collectively due to the proximities we have outlined before, which is yet again conveyed by the chart below (via the tracking error).
Seeking Alpha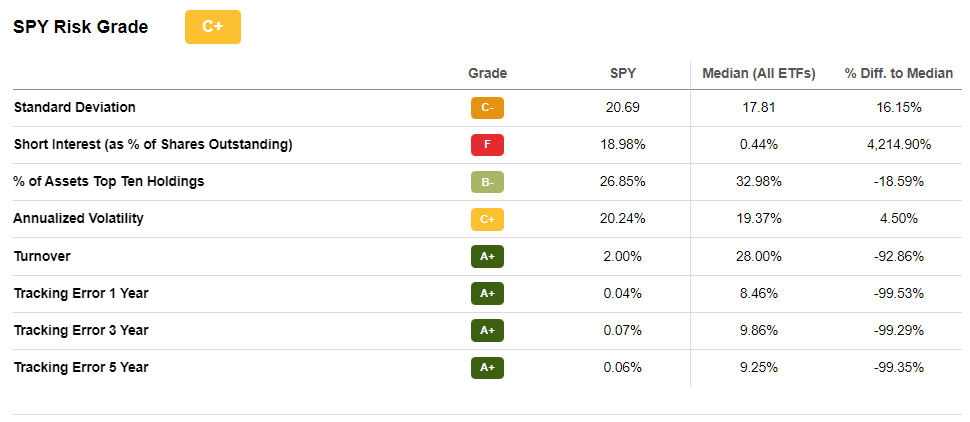
SPY Risk Premium Analysis
The data I extracted for our quantitative analysis ranges from our previous article (previous yield curve), Gurufocus (current yield curve), YChart (dividend yield), and FactSet (expected earnings).
I combined the data to formulate a risk premium explaining the S&P 500’s expected return. The whole ‘recipe’ can be found via this link if you’re interested in dissecting the formula.
Remember that the risk premium is the return investors demand for the risk they’re willing to take. Here’s what I discovered by observing the latest quarterly shift in the S&P 500’s risk-premium.
- Broad-based expected earnings have tapered down amid a consecutive quarterly economic contraction, which is by definition a recession.
- Due to another price drawdown in the first quarter, dividend yields have risen. Dividends are mostly lagged indicators of company performance, which is something to keep in mind.
- Amid the economy’s contraction, investors anticipate interest rate hikes to settle lower than they did previously. As such, the market has priced a lower future interest rate environment.
- Collectively, the forward-looking risk premium is lower, but equity investors seem to focus more on the interest rate effect and the bond market than anything else.
| Q1 | Q2 | |
| Earnings (fwd) | 10.9% | 9.2% |
| Dividend Yield | 1.37% | 1.69% |
| Yield Curve | 3.25% | 2.956% |
| Expected Return | 9.02% | 7.93% |
Source: Seeking Alpha, FactSet, YCharts, Gurufocus
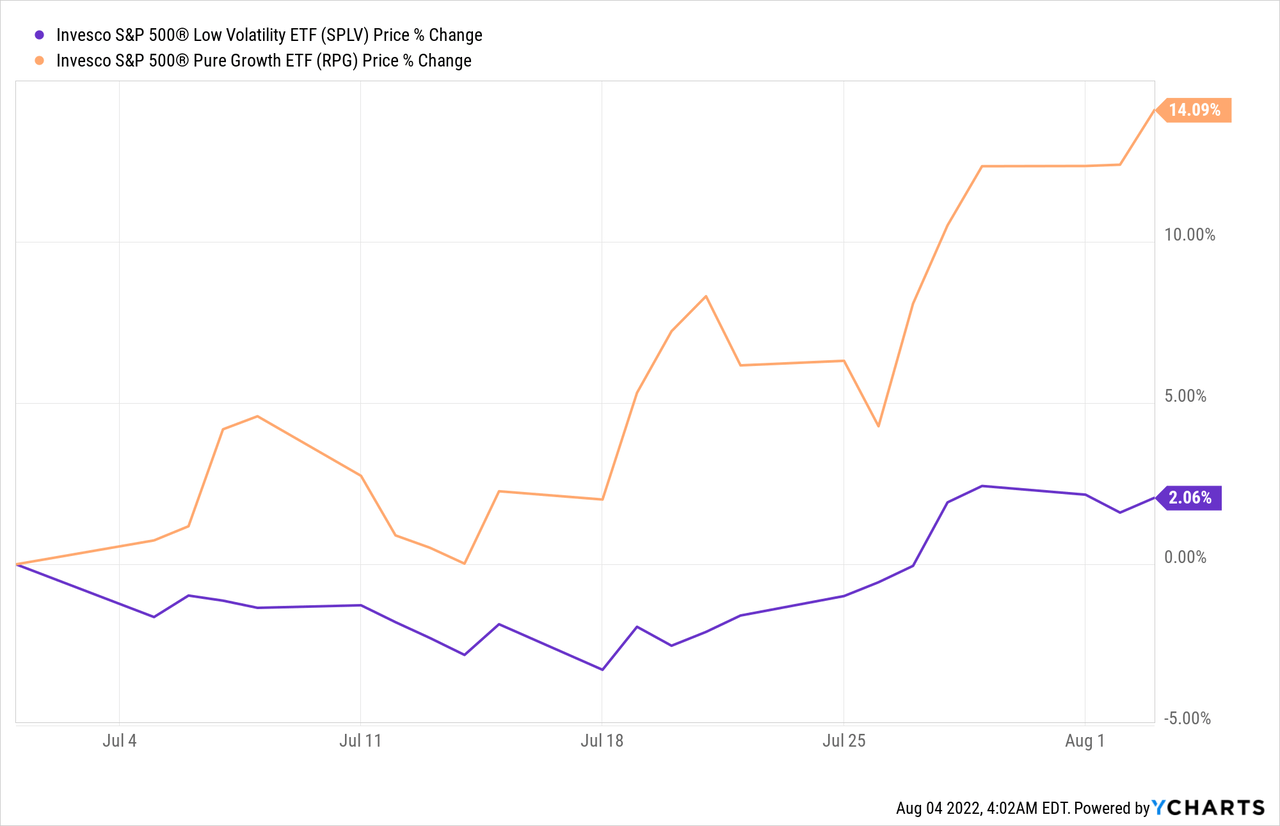
Before I delve into what the quantitative metrics tell us, I’d like to mention the outperformance of high-beta stocks during the past month, which tend to be more sensitive to monetary policy than lower-beta stocks.
Okay, so let’s get into a more comprehensive analysis of the quantitative metrics.
It seems as though investors are pricing a divergence between the long-term bond yields and a systemic support factor of company earnings. Even though we saw various high-profile earnings misses in recent weeks, many companies are still reporting earnings growth well above their 2019 trajectories.
These earnings reports are coincidental variables and often fall off a cliff as a recession falls into deeper territory. However, we’ve all become accustomed to the federal reserve prioritising short-term economic growth instead of curbing inflation. As such, during the past month investors have priced an earnings re-ignition as they anticipate premature expansionary monetary policy. Adding substance to this argument is that non-core inflation has finally started to recede, which is normal; non-core inflation tends to revert to mean rapidly due to its elasticity.
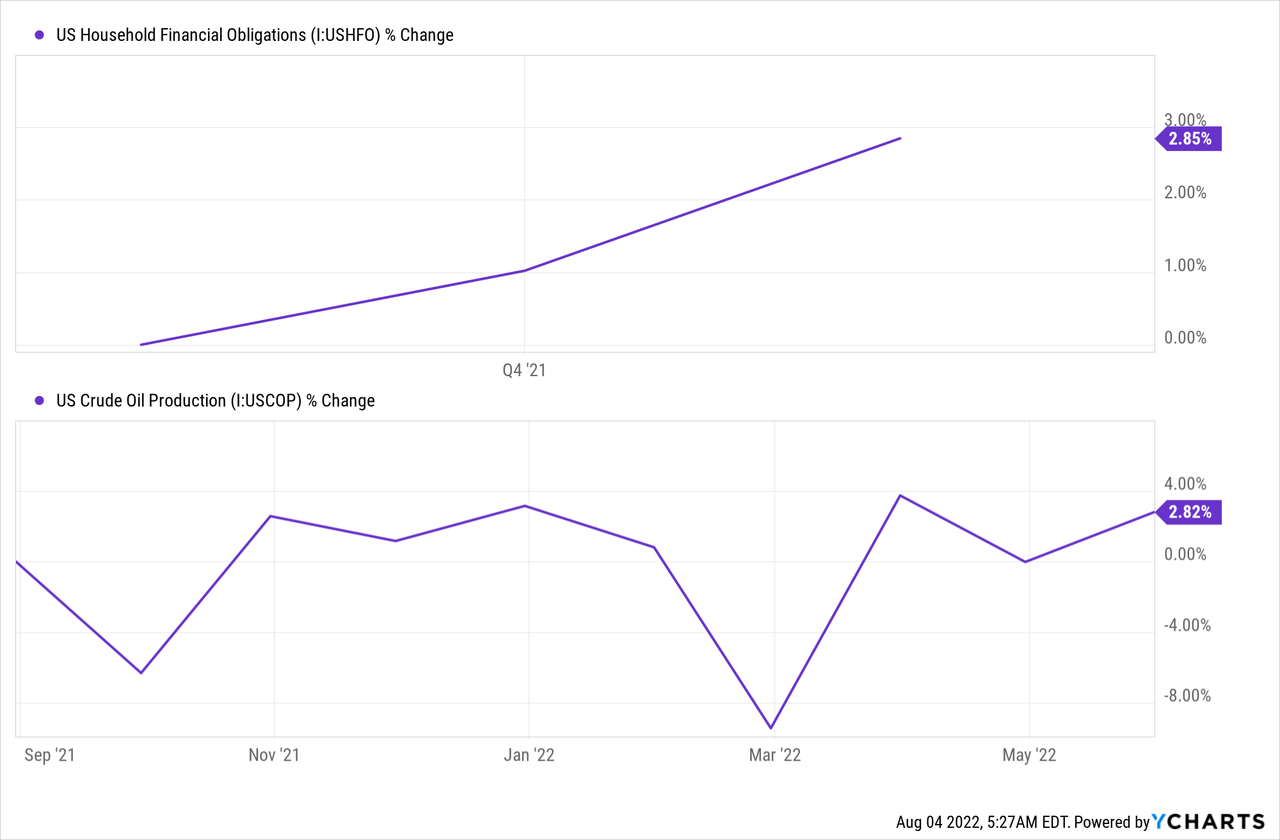
Although the market’s priced the mentioned aspects, we still think earnings growth will stagnate due to the marginal utility effect, which could cause weaker household balance sheets. This is normal for the economy, which is a cyclical domain and not a linear or exponentially growing vehicle.
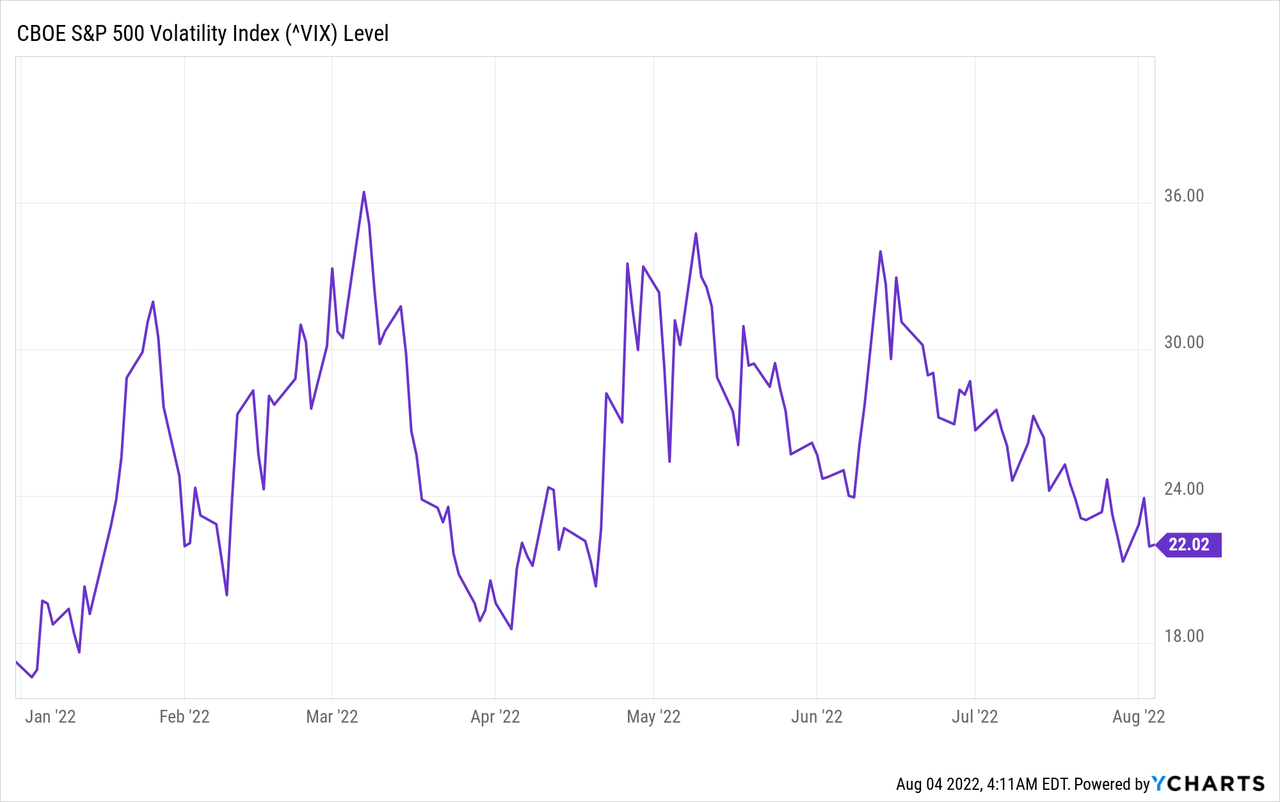
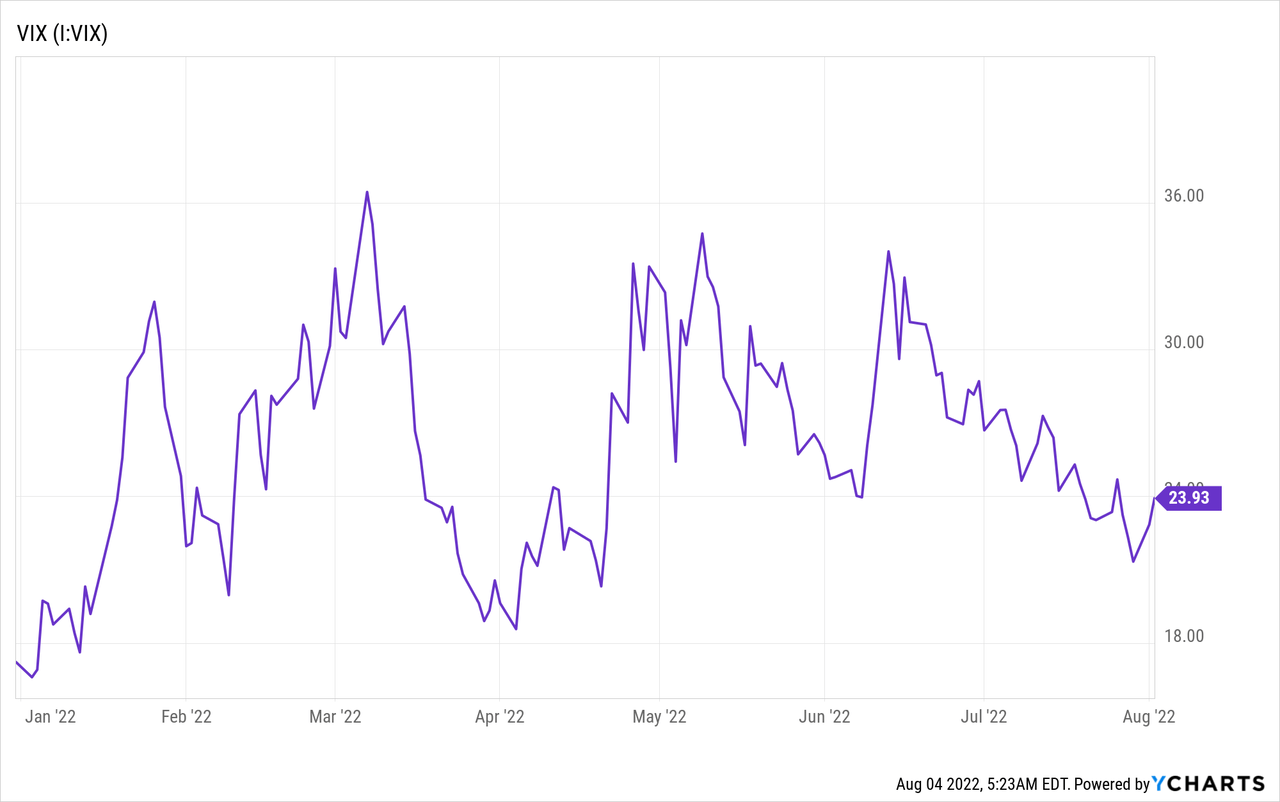
Furthermore, dividend yields might recede with recent stock price surges, and many companies might preserve their net income in the coming quarters to add a margin of safety. Lastly, the yield curve is still very unpredictable, as explained by the VIX below; what does this mean? There’s uncertainty in future interest rates policy.
Qualitative Overlay
This section might be a tad subjective, but it’s just my take on the recent bounce and related factors such as the broader economy and 2020’s bear market.
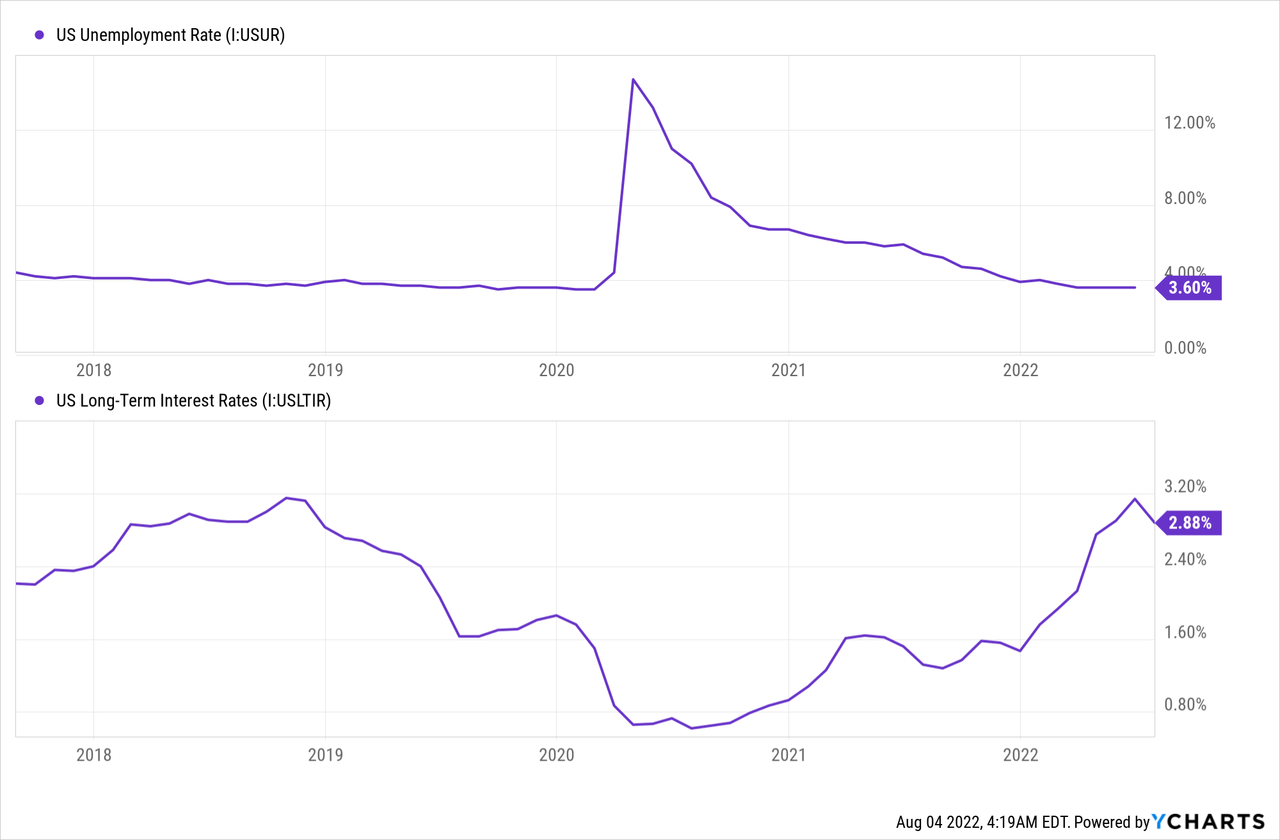
Firstly, I’ve seen many investors compare this bear market to 2020. However, there’s no relation. In 2020, we were in a low-inflation environment, which allowed for abrupt expansionary economic policy, subsequently providing support to the stock market. Also, unemployment rates dropped significantly, causing many to invest in the financial markets for a secondary or primary means of income.
As of now, expansionary policy can’t be as illustrious (as in 2020) because the central authorities still need to contend with high inflation and a tight labor market. Therefore, the proximities between this bear market and 2020’s bear market are slightly invalid.
Now moving on to what I consider the most important part, the broader economy. An argument about whether the recent contraction is a severe economic problem or not is subjective. However, I prefer calling it a recession as I believe in maintaining threshold definitions to preserve baselines for ex-ante analysis.
The reason I remain worried about the recent contraction is threefold. Firstly, the U.S. is still early in the rate-hike cycle and has not fully curbed inflation. Yet, economic contraction has already occurred, leaving policymakers at a crossroads.
Furthermore, there’s been an increase in oil supply but nothing to suggest that authorities are taking our global energy shortage seriously. For as long as oil and gas remain at elevated prices, we’ll see pressure being put on corporate and household balance sheets.
Lastly, there seems to be a “wealth effect” settling into the United States, which is an economic term used for developed nations that experience decreasing labor productivity. I’ve repeatedly heard about how tight the labor market is, which is more worrying than most believe; it could diminish long-term growth.
I conclude this section with the following. Remember that the long-term growth of the stock market is in line with GDP growth as it’s assumed that the market’s P/E ratio will revert to mean and that the earnings yield will coalesce with GDP growth. So, ask yourself, will U.S. GDP proliferate over the next ten years? I won’t be too sure.
A Few Positives
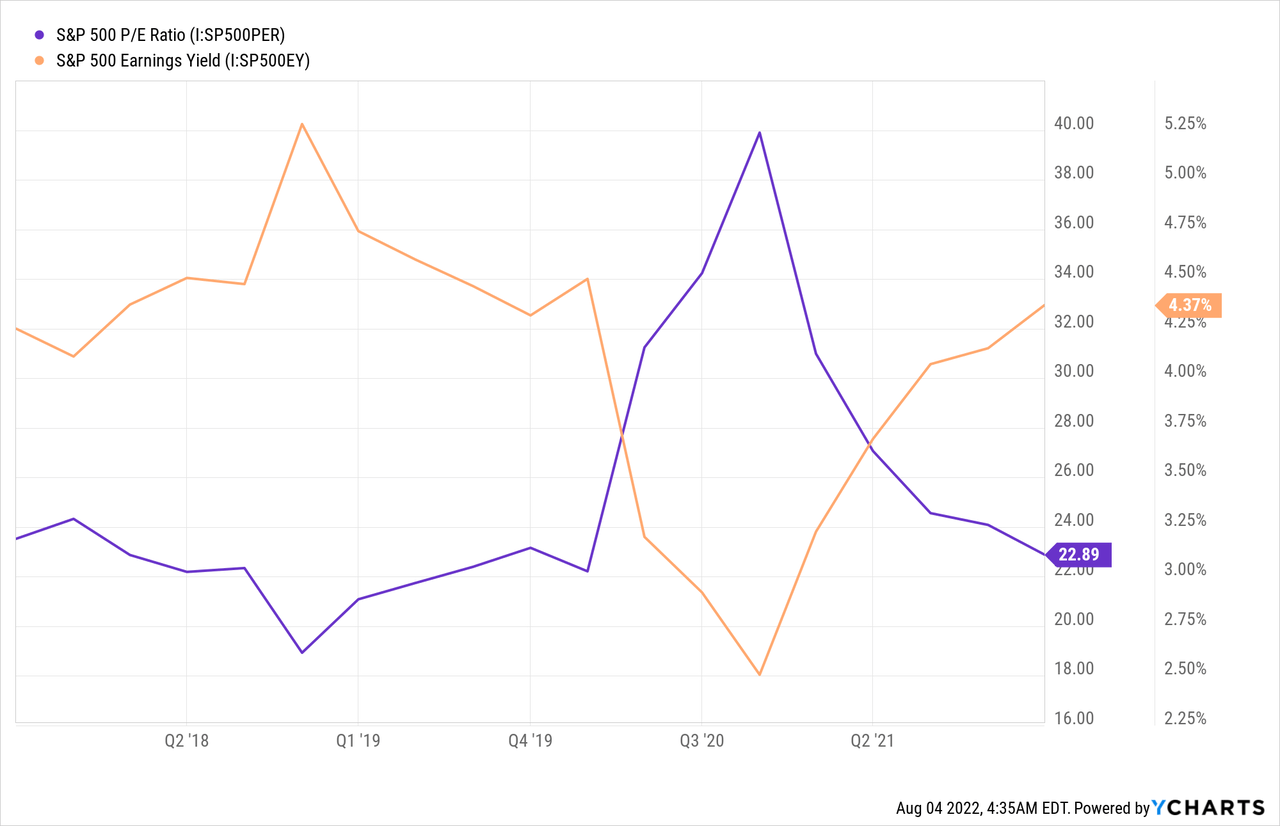
Although I’ve already mentioned a few positives, it’s necessary to add more to juxtapose a bearish case. From an ex-post valuation perspective, the S&P 500’s P/E is back at an investable level, and its earnings yield is well above pre-pandemic levels. Thus, if you’re a value investor, you’d probably be very bullish right now.
Furthermore, from a technical analysis vantage point, this could be a prolonged market upturn. The SPY presents another support level at the $416 handle, which only catches resistance at the $460 mark. So, if you’re a believer in looking at past prices to predict future prices, you’ll also be smiling.
Seeking Alpha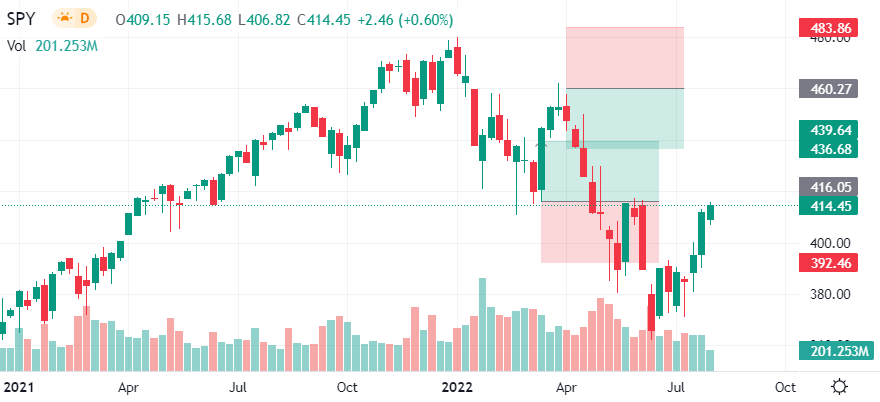
Concluding Thoughts
Collectively, we don’t like the S&P 500’s risk premium and believe that the recent market upturn is largely down to a belief that expansionary monetary policy will prevail. However, with the macroeconomic environment still in doubt, we think the earnings yield on S&P 500 stocks and their dividend yields could fade soon.
Lastly, valuations and technical levels are appealing, but we’re not getting caught up in it all.
Be the first to comment