

gorodenkoff
The S&P 500 has gained 5% since October 13, 2022, after finding support just below 3,500. There is potential for an additional 6% to 7% rise in the index towards 4,000.
First, a brief review of the fundamentals before we move to the technicals.
San Francisco Federal Reserve President Mary Daly said on Friday, October 21, 2022, that it is time for the central bank to consider slowing the pace of the hikes. This fueled expectations of a bottom in the stock market downtrend.
However, the bond market did not buy into the excitement. The 10-Year Note yield rose ten basis points on Friday, October 21, 2022, to 4.21%.
Bond investors are concerned about the central bank being pressured to slow the pace of hikes and eventually lose the fight against inflation. Taming inflation may even require more drastic action than pushing the economy into a recession, as we have argued in another SA article.
We believe that the current pace of hikes is inadequate. Inflation is a bifurcation in the non-linear dynamics of the economy, and the only effective control is a recession until excesses are removed. But a guarantee that inflation does not ignite again after rates peak and reverse is a mildly deflationary environment without excessive stimulus.
Lowering inflation to below 3% and guaranteeing it stays there will be a painful process for the stock market and the economy. The bond market is a different story. It is hard to guess when the major investors in bonds, the pension funds, and the insurance companies, will consider that yields are high enough and prices are cheap. If there are prospects for a long consolidation in the stock market, as some fund managers argue, yields in the range of 4% may sound like a good investment.
The Technicals
The key in this game is being able to distinguish between a final bottom and a relief rally. This is not easy, and analysts must look at several indicators before concluding. Focusing on just one indicator has the risk of confirmation bias. Below, we will look at three non-traditional indicators.
1. Weekly RSI Divergence
Weekly S&P 500 Chart with RSI Divergence (Price Action Lab Blog – Norgate Data)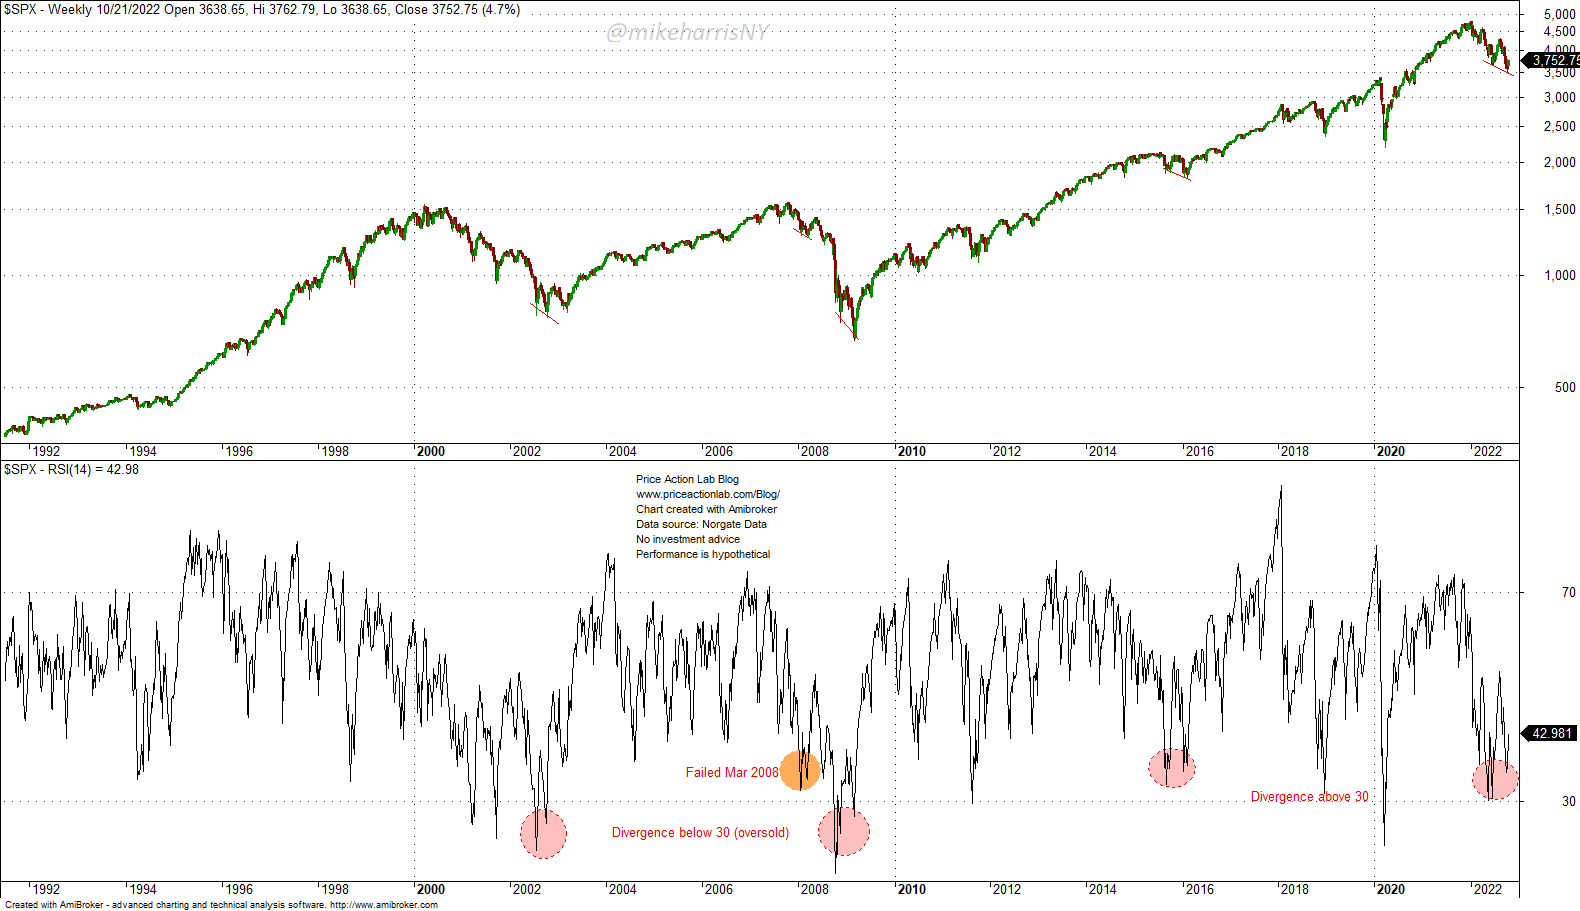
This chart appeared on social media this week. It demonstrated how divergences in the weekly RSI of the S&P 500 Index (NYSEARCA:SPY) formed at the bottom in 2009, 2015, and 2016. The claim was that the current divergence also indicates a bottom.
I have also added two more divergences that the creators of the chart omitted in October 2002 and March 2008. Still, the sample is too small.
All the pink divergences as marked on the above chart occurred at the bottoms, but there was one, the orange in March 2008, that occurred before a relief rally. In addition, the two divergences that signaled major bottoms in 2002 and 2008 occurred with a 14-week RSI below 30. The oversold levels indicated the exhaustion of the downtrend. This is not the case with the current divergence, and the odds are high that it is signaling a relief rally rather than a bottom.
2. Realized and Implied Volatility
Daily S&P 500 Chart With Realized and Implied Volatility (Price Action Lab Blog – Norgate Data)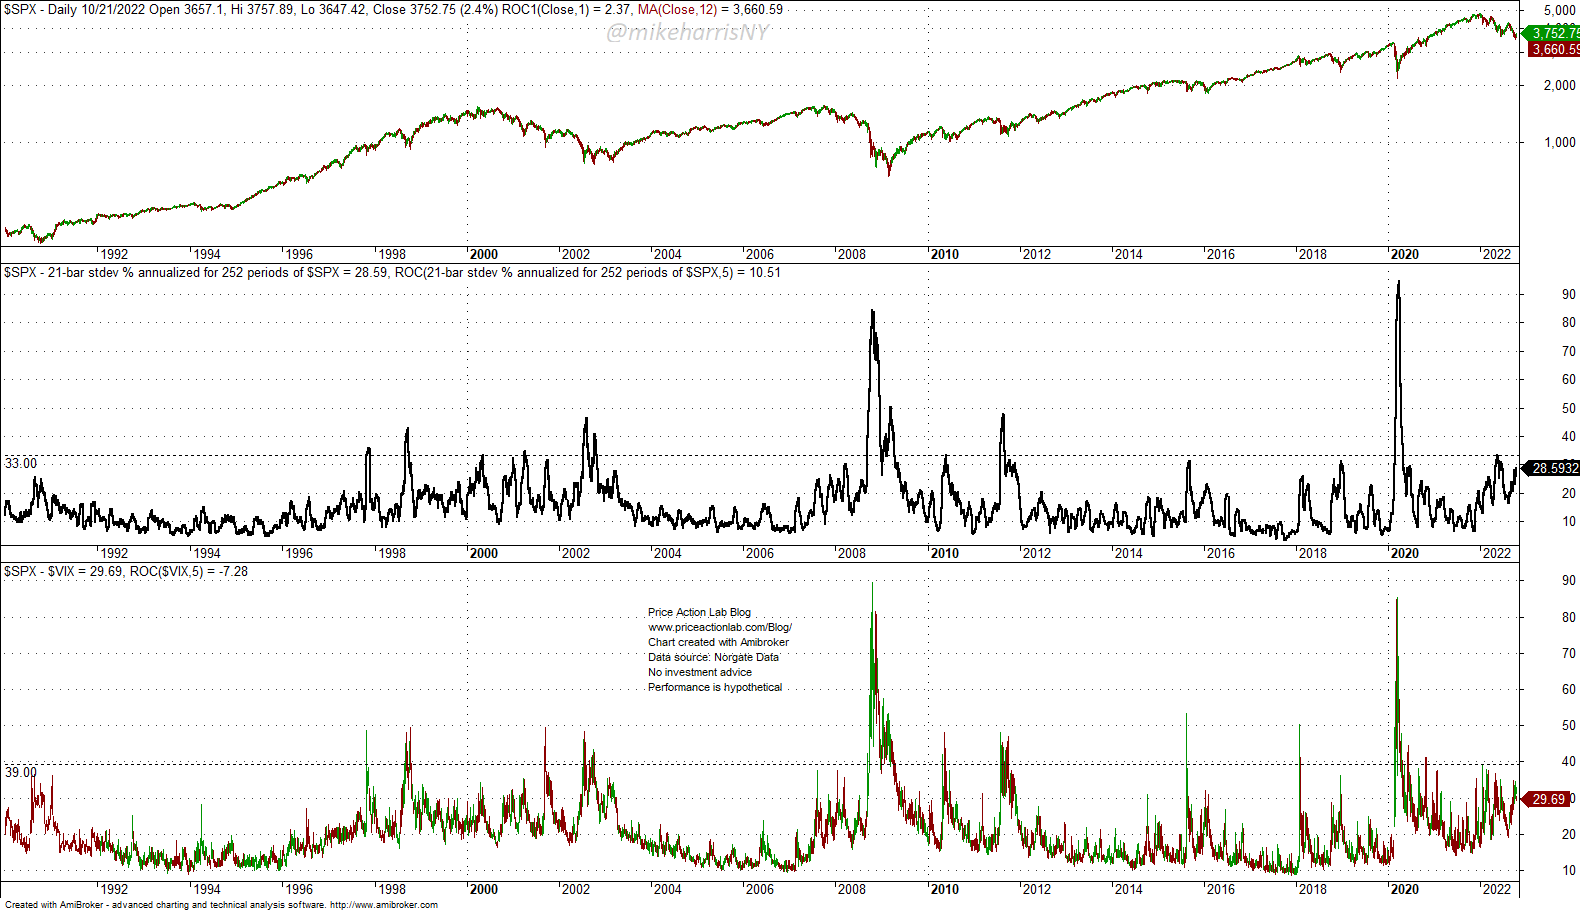
The annualized 21-day standard deviation of daily returns of the S&P 500 Index is used to calculate realized volatility, and the level of the VIX index is as the implied volatility.
Note that the 5-day rate-of-change of the realized volatility was 10.5%, i.e., it increased last week, while the implied volatility 5-day rate-of-change was -7.3%, i.e., it fell.
During the whole downtrend of this year, both realized and implied volatility have stayed well below the levels seen in previous bear markets. In other words, we have not seen any volatility spikes this year. The realized volatility has stayed below 33% and the implied volatility is below 39%.
Volatility usually spikes near the bottoms of bear markets. Unless “this time is different,” we have not seen the bottom yet.
3. 252-day Hurst Exponent
Daily S&P 500 Chart with 252-Day Hurst Exponent (Price Action Lab Blog – Norgate Data)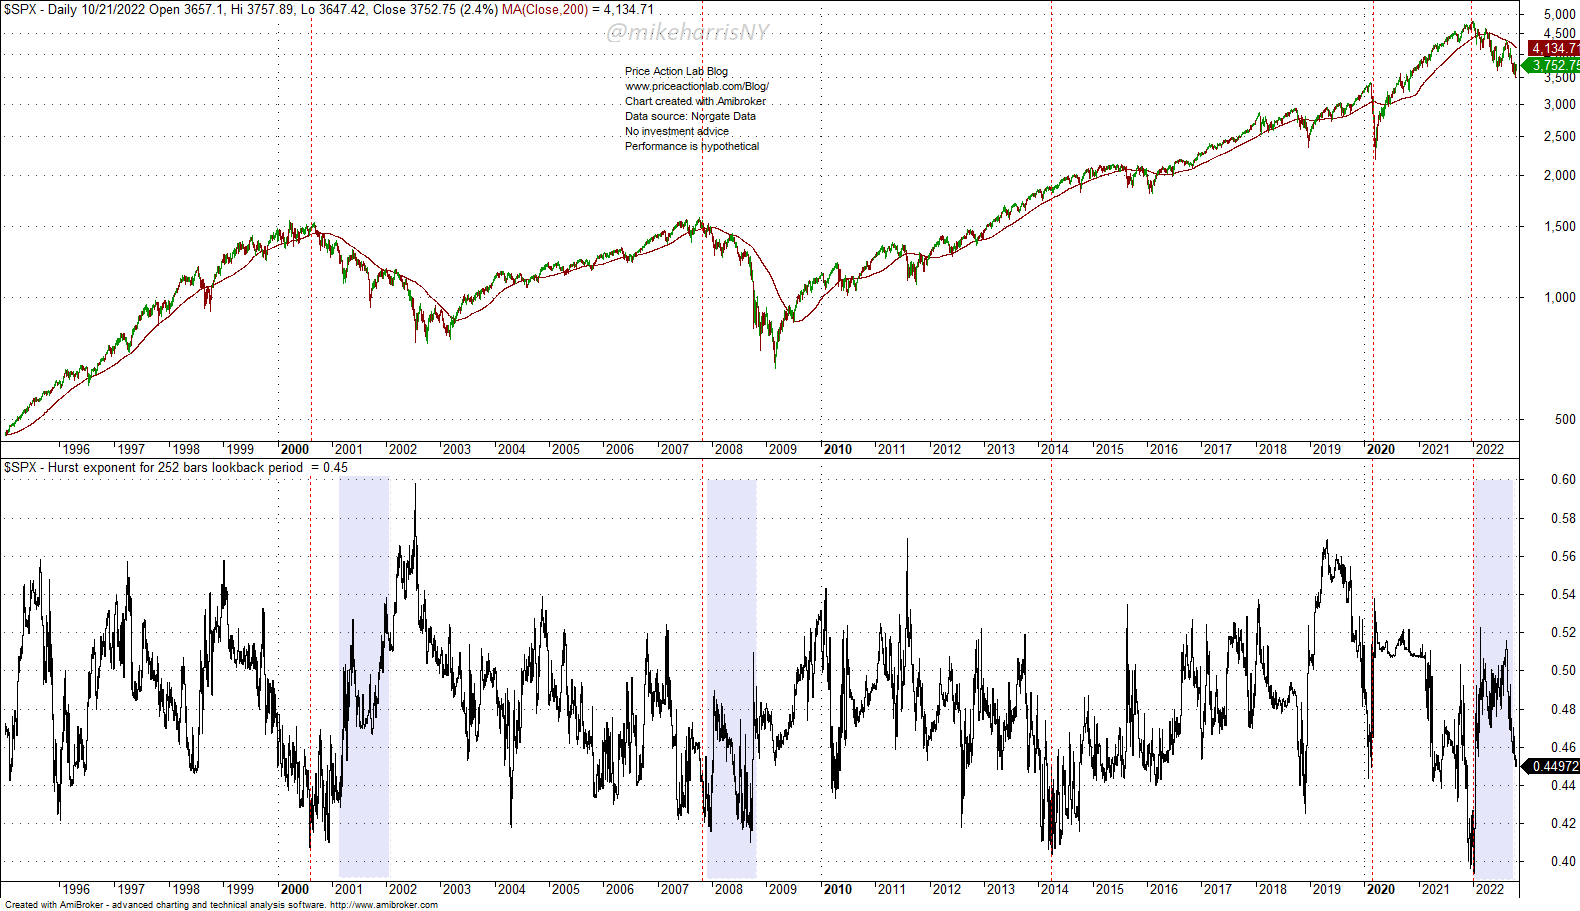
The Hurst exponent is a highly idiosyncratic indicator that is difficult to analyze. When the Hurst value is below 50, it indicates a mean-reverting tendency, and when it is above 50, it indicates a momentum regime.
The vertical dotted lines show how accurately this indicator has timed major tops in the past, in hindsight, of course. But the drop in value was significant enough to indicate a possible bottom formation. The shaded areas show a common pattern of a rise in the Hurst exponent from very low levels but then a reversal. In the past two major bear markets, the dot-com and the GFC, these reversals were an indication of a continuation of the downtrends. The current pattern also indicates a possible continuation of the downtrend due to the reversal.
Conclusion
We briefly mentioned the fundamental factors that are driving the current relief rally. Additional gains in the S&P 500 Index of 6% to 7% towards 4,000 are possible. We argued that the bond market is not buying into the excitement because the possibility of a slower pace of hikes could derail the inflation fight.
We also discussed three non-conventional indicators that show that there are higher odds that there is no bottom yet. Weekly divergences in the RSI index have occurred in the past along downtrends and before a final bottom. Volatility has remained low and there is an absence of volatility spikes that normally occur near bottoms. Finally, the Hurst exponent reversal indicates there are no conditions for a final bottom yet.
Be the first to comment