

bopav/iStock via Getty Images
I recently looked at the PE Ratios for various small cap indices and compared them to the S&P 500 on Ed Yardeni’s Website. As of 19 September 2022, the S&P 500, with a Forward P/E Ratio of 16.3, trades at a premium to the S&P 400 Mid Cap (11.9) and the S&P 600 Small Cap (11.5) indices. At a time of elevated volatility, this isn’t surprising. One would expect that large companies will be able to manage the effects of inflation and rising interest rates better than smaller companies, and even if not, when volatility and event risk are high, investors tend to pay a premium for liquidity. Ultimately I wasn’t able to form an opinion regarding if the premium PE ratio the S&P 500 currently enjoys to these two indices is fair value, too high, or not high enough. However, I did come to some conclusions about the Russell 2000. For those not familiar with the Russell family of indices, the Russell 3000 is the most extensive index of American small caps, the Russel 1000 is comprised of the thousand most valuable companies in the Russell 3000, and the Russell 2000 is comprised of the remainder. In short, even if it didn’t trade at a premium to the S&P 500, with a forward P/E Ratio of 19.9 versus the S&P 500’s forward P/E Ratio of 16.3, I wouldn’t recommend the Russell 2000 as a long-term investment. Nor do I recommend NASDAQ:VTWO or any of the other ETFs and funds that track it.
Why the Russell 2000 will continue to underperform
Per this excellent article from Morning Star, the Russell 2000 has historically had Negative Alpha, with both higher risk and lower returns than the broader market – who wants that? There is no need to plagiarize Morningstar’s work, you can access the article using the link above, but in summary, a disproportionate amount of the Russell 2000’s underperformance occurs in the month of June. Unlike the S&P 500, where stocks are added or withdrawn from the index on a quarterly basis by a committee, using a process that hasn’t been disclosed to the public, stocks are added and withdrawn from the Russell 2000 once a year at the end of June, using a rigid set of criteria that the market has been made aware of.
By May of any year, the market knows with a high degree of certainty which stocks are dropping out of the Russell 1000 into the Russell 2000, which stocks are migrating in the other direction, which stocks are dropping out of both the Russell 2000 and the Russell 3000 altogether, and what their replacements will be. So, instead of rebalancing their portfolios incrementally on a quarterly basis, fund managers are forced to adjust their portfolios all at once, once a year. Those who track the Russell 2000 are doubly affected when compared to the S&P 500. For the S&P 500, movement in and out of the index only occurs at the bottom end, the shares of companies with the lowest market cap. By contrast, funds and ETFs that track the Russell 2000 have to sell the stocks being promoted into the Russell 1000, as well as the stocks at the bottom end of the spectrum that are dropping out of the index. They then have to buy the stocks falling out of the Russell 1000, as well as those being included in the index for the first time. I wasn’t able find data, but if more investment money tracks the Russell 1000 than the Russell 2000, then there is a classic case of “More Sellers than Buyers” for the stocks that are affected. In any case, all of this trading activity happens in a short period of time, and unlike the S&P 500, whose constituents have market caps in the tens or even hundreds of billions of dollars, the stocks being traded are illiquid small caps. Bid / Offer spreads as a percentage of a trade are therefore wider, and even getting a trade executed can be a challenge. Morning Star’s analysis is a bit dated as it was performed in 2015, so I decided to see if its conclusions are still valid. They are, and I can see no reason why this will change – consequently, you should avoid the Russell 2000, and VTWO, as a long-term buy and hold investment.
What does risk mean to you?
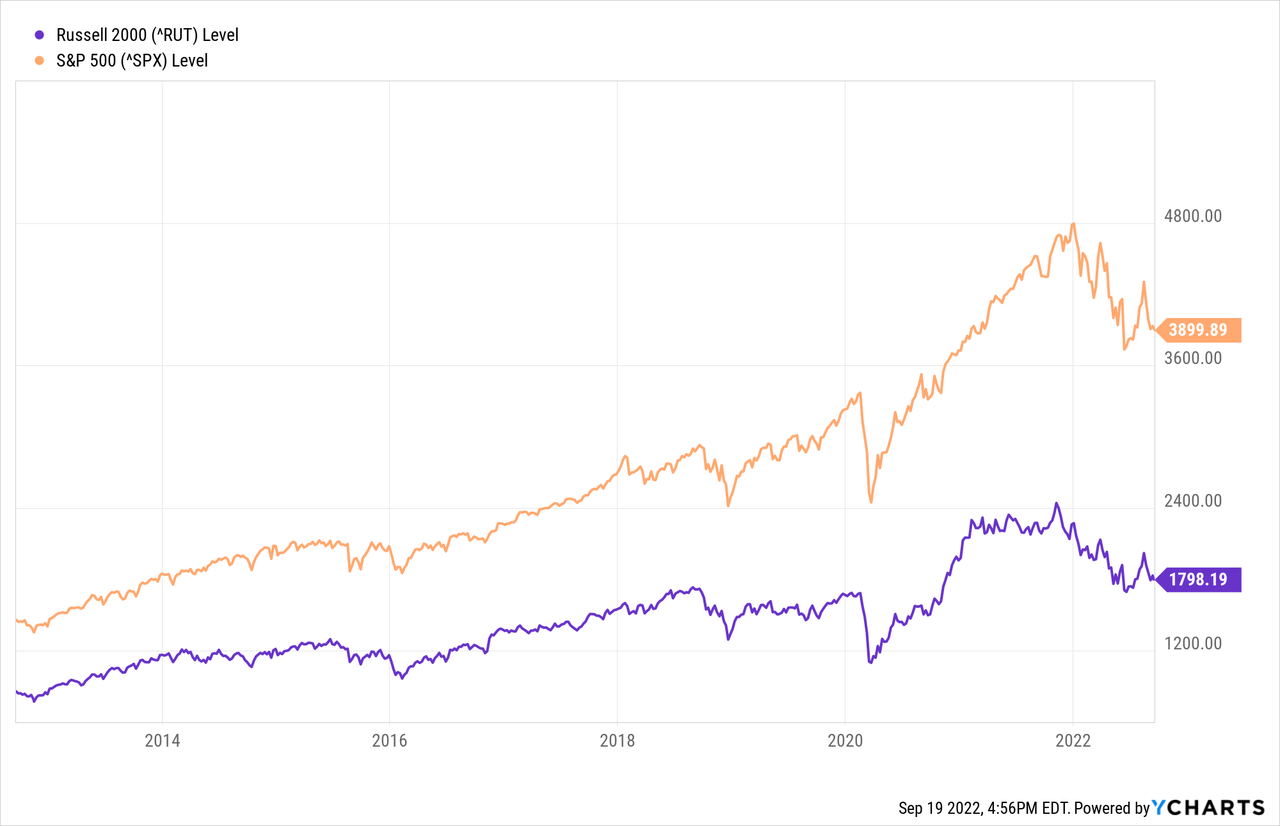
In the course of my analysis, an interesting anomaly came to light. Thirty Five years of price movements for both the Russell 2000 and the S&P 500 were compared on a Daily, Weekly (defined as 5-trading days) and Monthly (defined as 22-trading days) basis. Standardized weekly and monthly trading periods were used as opposed to calendar periods in order to strip out the effects of holidays, and periods such as 9/11 when markets were closed. Dividends were not included, but they will be reflected in the daily change in price when a stock moves from cum-dividend to ex-dividend.
Both indices have had similar average returns over all three time periods; it is only over the course of a year or longer that the S&P 500 significantly outperforms. As was expected, the risk of the Russell 2000, as measured by the Standard Deviation of returns, is also greater for all three periods. Similar return, more risk. Once again, Negative Alpha.
Table 1 – Russell 2000 – Historic Risk and Return, 1987 to 2022
| Mean | Maximum Upside | Greatest Selloff | Standard Deviation | Coefficient of Variation | |
| Daily Change | 0.04% | 9.39% | -14.27% | 1.35% | 37.26 |
| 5 – Day Change | 0.18% | 22.79% | -26.04% | 2.97% | 16.35 |
| 22 – Day Change | 0.81% | 28.80% | -41.27% | 6.20% | 7.63 |
| Daily Range | 1.36% | 13.37% | 0.12% | 1.08% | 0.80 |
| 10 September 1987 – 31 August 2022 | |||||
Table 2 S&P 500 – Historic Risk and Return, 1987 to 2022
| Mean | Maximum Upside | Greatest Selloff | Standard Deviation | Coefficient of Variation | |
|
Daily Change |
0.04% | 11.58% | -20.47% | 1.18% | 33.02 |
| 5 – Day Change | 0.17% | 19.11% | -27.33% | 2.20% | 13.85 |
| 22 – Day Change | 0.76% | 25.05% | -33.67% | 4.70% | 6.20 |
| Daily Range | 1.26% | 22.80% | 0.15% | 0.97% | 0.77 |
| 10 September 1987 – 31 August 2022 | |||||
The average daily range of both indices is similar – 1.26% for the S&P 500 versus 1.36% for the Russell 2000. As would be expected, the S&P 500 has bigger moves to the upside. Also as expected, the Russell 2000 has a Greater Maximum monthly move to the downside, -41.27% versus -33.67%. However, counterintuitively, when looked at on a Weekly and Daily basis, it is the S&P 500 that has experienced more extreme moves, especially in the daily time period where the maximum selloff was -20.47% versus -14.27% for the Russell 2000.
One of the factors contributing to the overall underperformance of the Russell 2000 is illiquidity, which is most keenly felt on volatile trading days. In order to analyze days with extreme volatility, I made arbitrarily groupings where the market closed plus or minus 2 percent from the previous day. “Up Days” are days where the market has risen by 2 percent or more, and “Sell Offs” are days where the market has fallen by 2 percent or more. The results are illuminating.
Table 3: Number of Volatile Days, 1987 to 2022
| Up Days: +2% or Greater Move | Sell Offs: -2% or Greater Move | Total Volatile Days | Sell Offs as Proportion of Total | |
| S&P 500 | 290 | 328 | 518 | 63.3% |
| Russell 2000 | 453 | 466 | 919 | 50.7% |
| 10 September 1987 – 31 August 2022 | ||||
Three things are significant; 1) The Russell 2000 has a much greater number of volatile days, 2) The Russell 2000 has a much greater number of Sell Offs, but, 3) The proportion of volatile days that are Sell Offs is much greater for the S&P 500 as opposed to the Russell 2000. In other words, the Russell 2000 has more Sell Offs, but, these appear to be smaller in scale. Little and often doesn’t just apply to eating habits designed to promote weight loss.
Were the past 10-years similar to the first 25?
I wouldn’t want to make a living trading off of a pattern that materialized four decades ago for which I have no recent analysis to determine if the pattern still holds, and for which I have no explanation. Plenty of people have lost their shirt from ‘data mining’, the practice of finding patterns in large data sets for which there is no underlying explanation, which subsequently turn out to be random. One possible explanation for this anomaly is that a greater proportion of small caps are owned by founders, the family of founders, and / or insiders, than is the case for Fortune 500 firms. If so, and I caution that I have not tested this assumption because it would mean analyzing 10-Qs for 2500 companies, then it is likely that the owners of small caps are legally prohibited from selling shares of their companies, and/or they are unwilling to do so on down days because it would provide a negative signal to outside investors and employees, and/or, they have other reasons such as legacy, not to sell.
Illiquidity is another potential explanation. Anecdotally, there has been a decrease in market liquidity over the last decade. Traditionally, one of the biggest providers of liquidity to the market has been trading desks at banks and investment banks. As these activities were one of the contributing causes of the Credit Crunch, regulators have since taken the view that it is inappropriate for a commercial bank that takes retail deposits to then use this liquidity to fund punts on the market. Banks now have to apply much greater amounts of capital to support these business lines, and these increased capital requirements are subject to stress tests which can further increase capital usage. As a result, banks have curtailed their trading activities and the loss of this liquidity is felt most on days where there are extreme market moves. To some extent day traders on Robin Hood have filled this vacuum, but it makes sense that given the asymmetric returns and margin requirements for short positions, they participate more frequently to the upside when markets are rising. Results for the past decade seem to partially bear this out.
Table 4: Daily Risk and Return Comparison, 2012 to 2022
| Mean | Maximum Upside | Greatest Selloff | Standard Deviation | Average Daily Range / Std Dev | |
|
Russell 2000 |
0.04% | 9.39% | -14.27% | 1.37% | 1.44% / 0.98% |
| S&P 500 | 0.05% | 9.38% | -11.98% | 1.08% | 1.05% / 0.80% |
| 1 September 2012 – 31 August 2022 | |||||
As was the case for the entire 35-years of data, over the last 10-years, the average daily return for both indices was similar, and the Russell 2000 was more risky as indicated by the average trading range and standard deviation. Unlike the overall period, it also had a greater maximum sell off than the S&P 500. Finally, the difference between the average daily trading range for both indices has increased. Over the entire 35 years, the average daily range is quite similar 1.36% versus 1.26%, with the Russell 2000 having the wider range. However, over the past 10 years, this difference has grown; 1.44% versus 1.05%. This seems to indicate that there are fewer market makers and less liquidity for the Russell 2000 than was previously the case.
Table 5: Number of Volatile Days, 2012 to 2022
| Up Days | Sell Offs | Total Volatile Days | Sell Offs as Proportion of Total | Expected Total vs. Actual Total * | |
|
Russell 2000 |
129 | 127 | 256 | 49.6% | 248 Expected vs. 256 Actual |
| S&P 500 | 56 | 85 | 141 | 60.3% | 148 Expected vs. 141 Actual |
| 1 September 2012 – 31 August 2022 | |||||
* Expected Volatile Days equals 28.6% of Total Volatile Days over entire 35 year period
As per Table 5, the actual number and frequency of volatile days over the past 10 years is very close to what was expected. Further, once again, the Russell 2000 experienced both a greater number of total volatile days and a lower proportion of sell offs than the S&P 500 did. Once again, there were approximately 12 days when the Russell 2000 sold off by at least 2%, for every 10 days that the S&P 500 did so. When compared to the S&P 500, the Russell 2000 still appears to experience smaller initial sell offs followed by a greater number further down days.
Table 6: Average Return After Sell Offs
|
1987 – 2022 Next 5 Days |
2012 – 2022 Next 5 Days | 1987 – 2022 Next 22 Days | 2012 – 2022 Next 22 Days | |
| Russell 2000 | 0.34% | 0.96% | 0.36% | 4.71% |
| S&P 500 | 0.80% | 0.57% | 3.07% | 8.09% |
Both indices have the greatest average returns after Sell Offs. For example, over the past 10 years, the Russell 2000 has deceased on average by 0.04% in the week after an Up Day, increased on average by 0.21% in the week after a non-volatile day, and increased by 0.36% in the week after a Sell Off. I have therefore only shown the data for Sell Offs. What immediately jumps out is the significant positive performance of both indices after a sell off, and how much this has increased in the last decade. Indeed, without the positive 4.71% return that the Russell 2000 experienced over the last 10 years, the 35 year figure of positive 0.36% for this index would be negative. What also jumps out is how much the S&P 500 has outperformed the Russell 2000 after Sell Offs, 8.09% in the month after a Sell Off versus 4.71% for the Russell 2000. It appears that when bad news moves the market, the S&P 500 reacts quicker and sells off more deeply than the Russell 2000. Perhaps as speculated, this is because there are more founders and insiders who are reluctant to sell the shares of their company, or because there are more insiders who must file regulatory notices, or who are in black out periods before earning reports. Further, the decrease in trading desks at banks over the last decade means that there are fewer pools of capital who will go short an index, either as a prop trade, or to provide liquidity to a customer. Accordingly, it would make sense that the S&P 500 will initially sell off faster and further than the Russell 2000, and then later experience a greater rebound over the next month, and that this trend has increased.
Conclusion
If you are a long term investor, your best course of action is to underweight the Russell 2000, or to avoid it altogether.
The results of my analysis suggest that a good time to rotate out of small caps into to S&P 500 is after market sell offs. The absence of liquidity and potential reluctance of founders / insiders to sell a small cap means that such stocks, and the index that they are part of, may be priced at an artificially high level. If you are a Long/Short trader, shorting the Russell 2000 and going long the S&P 500 after a sell off may be appropriate.
I would caution; Finding a pattern that can be traded on is rare, and many of the assumptions that I have made, while explanatory, are untested. As well, I would have liked to have determined if the results are statistically significant, but that was beyond this article. So, as always when speculating, make sure you do your own analysis.
Be the first to comment