

naphtalina/iStock via Getty Images
Background
For those who are interested in John and Jane’s full background, please click the following link here for the last time I published their full story. The details below are updated for 2022.
- This is a real portfolio with actual shares being traded.
- I am not a financial advisor and merely provide guidance based on a relationship that goes back several years.
- John retired in January 2018 and now only collects Social Security income as his regular source of income.
- Jane officially retired at the beginning of 2021, and she is collecting Social Security as her only regular source of income.
- John and Jane have decided to start taking draws from the Taxable Account and John’s Traditional IRA to the tune of $1,000/month each. These draws are currently covered in full by the dividends generated in each account.
- John and Jane have other investments outside of what I manage. These investments primarily consist of minimal risk bonds and low-yield certificates.
- John and Jane have no debt and no monthly payments other than basic recurring bills such as water, power, property taxes, etc.
The reason why I started helping John and Jane with their retirement accounts is that I was infuriated by the fees they were being charged by their previous financial advisor. I do not charge John and Jane for anything that I do, and all I have asked of them is that they allow me to write about their portfolio anonymously in order to help spread knowledge and to make me a better investor in the process.
Generating a stable and growing dividend income is the primary focus of this portfolio, and capital appreciation is the least important characteristic. My primary goal was to give John and Jane as much certainty in their retirement as I possibly can because this has been a constant point of stress over the last decade.
Dividend Decreases
No stocks cut their dividend/distribution that was payable during the month of March.
Dividend And Distribution Increases
Four companies paid increased dividends/distributions or a special dividend during the month of March in the Taxable Account.
Arbor Realty – ABR remains one of the best dividend investments in John and Jane’s portfolio with dividends increased from $1.00/share per year in 2018 to $1.48/share per year in 2022. ABR has continued to perform well although the current yield looks undervalued based on what it has averaged in prior years. ABR has been good about raising its dividend (it has managed to do so for the last 7 quarters straight) but it has reached the coveted mark of a Dividend Champion with it having reached 10 consecutive years of dividend increases.
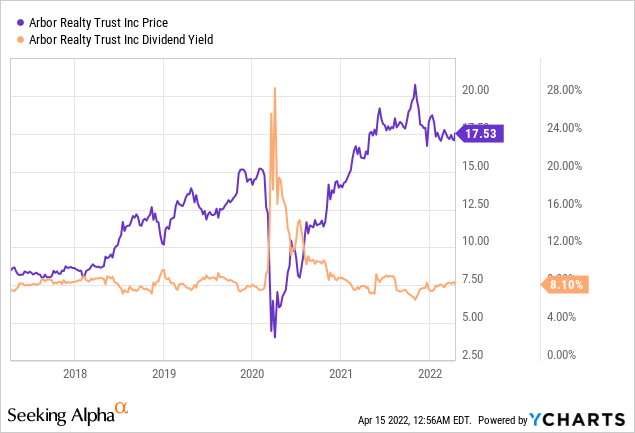
The dividend was increased from $.36/share per quarter to $.37/share per quarter. This represents an increase of 2.8% and a new full-year payout of $1.48/share compared with the previous $1.40/share. This results in a current yield of 8.56% based on the current share price of $17.53.
Archer-Daniels-Midland – ADM has benefitted tremendously from the current economic uncertainty and inflationary concerns with challenges becoming more apparent with the worldwide food supply chain. Wheat futures have been especially volatile with the situation in Ukraine and restrictions placed on their own wheat shipments outside of their territory (Ukraine and Russia produce approximately 25% of the world’s wheat supply). ADM’s price has reached a level that is well-above historical levels and is priced with the idea that volatility will reign supreme for the next several years. At best, ADM is a hold and worth keeping in the portfolio, but I would be hard-pressed to suggest adding shares at this point in time.
Archer Daniels Midland (FastGraphs)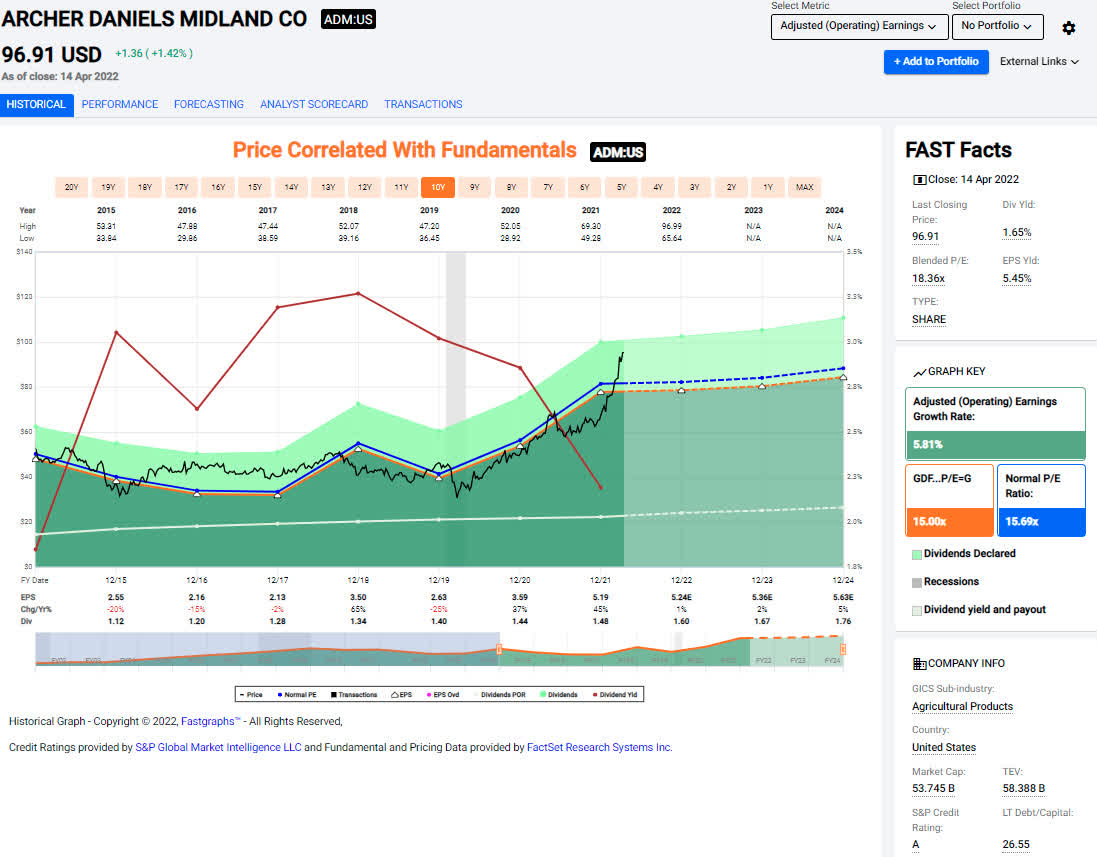
The dividend was increased from $.37/share per quarter to $.40/share per quarter. This represents an increase of 8.1% and a new full-year payout of $1.60/share compared with the previous $1.48/share. This results in a current yield of 1.67% based on the current share price of $96.91.
Equinix – We have continued to add a share or two at a time to John and Jane’s Taxable portfolio whenever we see a dip in share price (preferably below $700/share). Although the outlook isn’t exactly positive for EQIX in the short term I do think that their expansion into Africa offers the kind of catalyst that can spark future growth. Future estimates look promising which is why EQIX remains attractive at the right price.
Equinix (FastGraphs)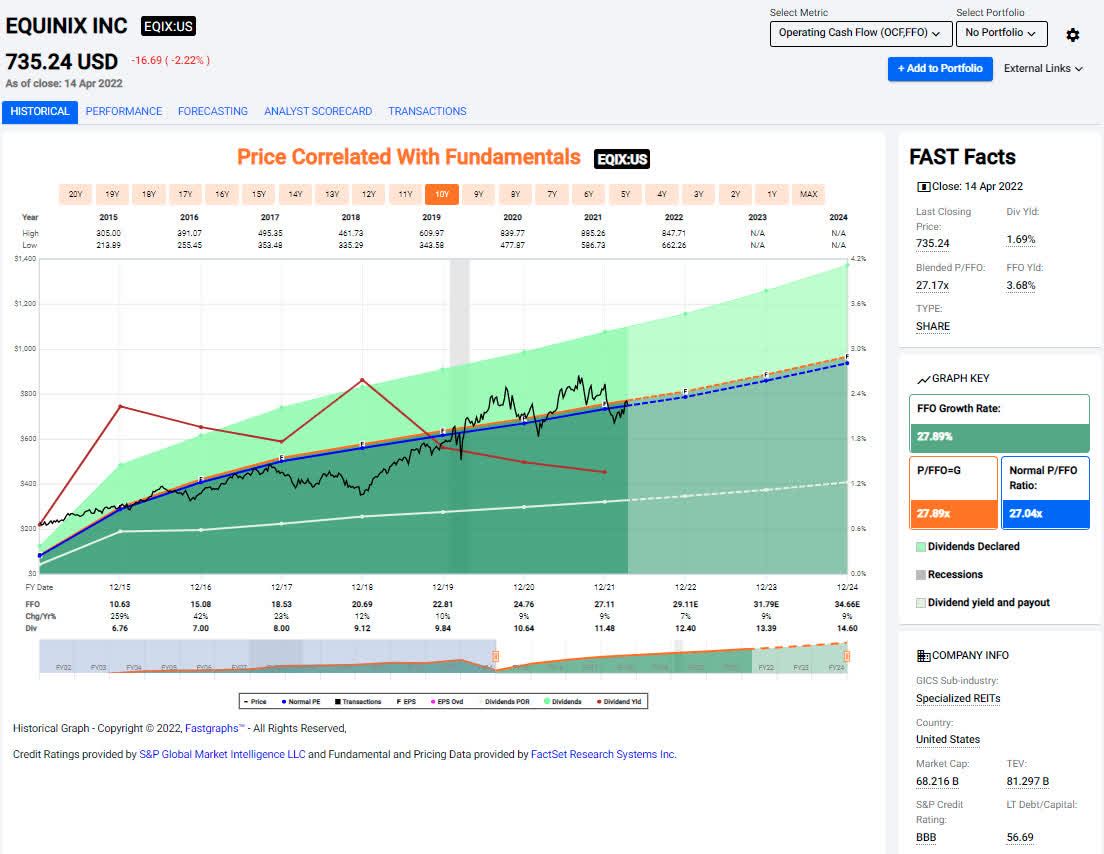
The dividend was increased from $2.87/share per quarter to $3.10/share per quarter. This represents an increase of 8% and a new full-year payout of $12.40/share compared with the previous $11.48/share. This results in a current yield of 1.65% based on the current share price of $735.24.
Old Republic International – ORI’s net income excluding investments was up over 20% year-over-year and resulted in strong earnings and subsequent special dividends that have made ORI one of John and Jane’s highest dividend-paying stocks. ORI is known for its conservative dividend increases and whopping special dividend payouts when the business is performing well. John and Jane carry a full position in ORI but we would consider adding to this position if shares dip below $23/share.
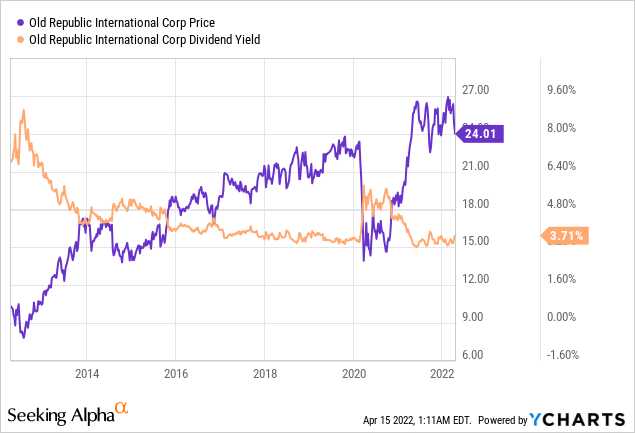
The dividend was increased from $.22/share per quarter to $.23/share per quarter. This represents an increase of 4.5% and a new full-year payout of $.92/share compared with the previous $.88/share. This results in a current yield of 3.81% based on the current share price of $24.01.
Positions
The Taxable Account currently consists of 45 unique positions at market close on April 14, 2022. There were several trades that took place during the month of March.
2022 – March Taxable Transaction History (Charles Schwab)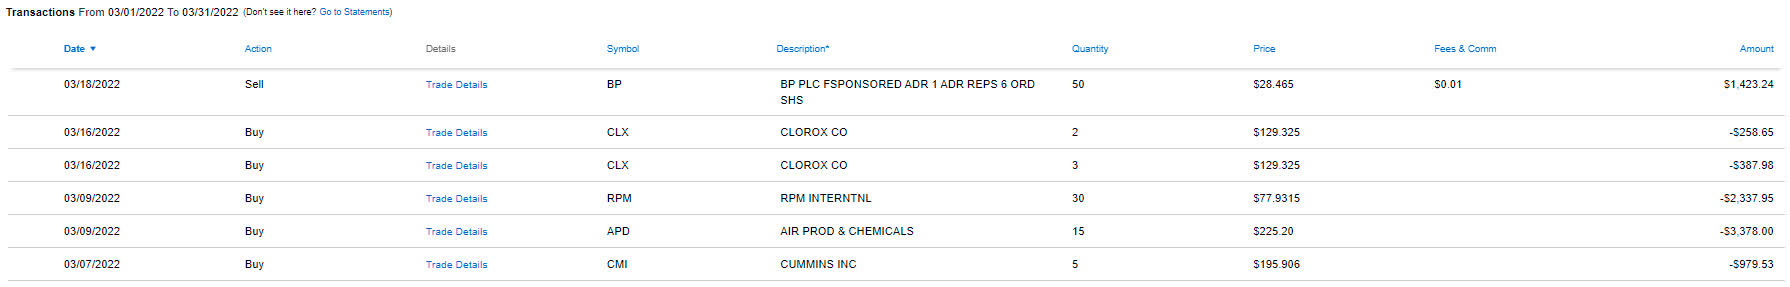
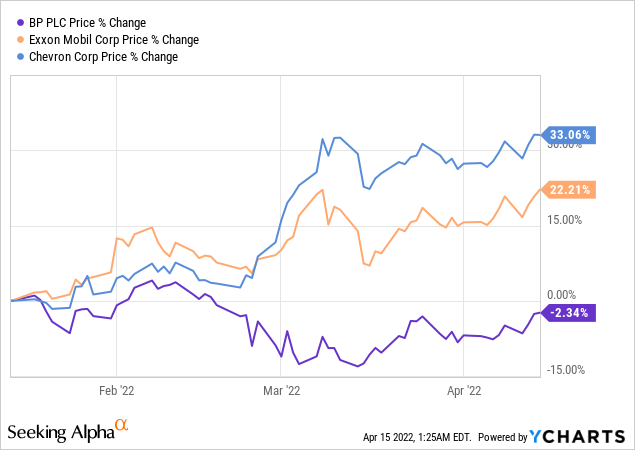
We sold shares of BP in order to reduce exposure with the plan of potentially eliminating shares from the Taxable Account. When compared to other energy holdings in John and Jane’s portfolio (including retirement accounts) we can see that BP has severely lagged the performance of Exxon Mobil (XOM) and Chevron (CVX) which can be seen in the chart below.
The remaining transactions in the Taxable Account for purchases included two new companies that were not already a part of the portfolio. Air Products & Chemicals (APD) and RPM International (RPM) were the two stocks that were added to the Taxable Account due to their ridiculously low stock price. Is also worth noting that both of these companies have seen their stock prices bounce off their 52-week-low.

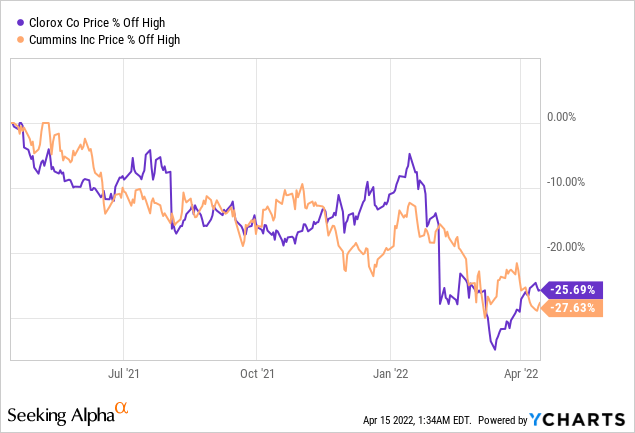
The smallest number of shares that we added to the Taxable Account was for Clorox (CLX) and Cummins (CMI) at five shares apiece. Both stocks are off their recent highs of more than 25% and currently, they offer an attractive dividend yield which further supports the stock being undervalued.
March Income Tracker – 2021 Vs. 2022
With large special dividends issued in 2021, we now must deal with the consequences of looking at dividend income in 2022 without them (but we would love it even more if those companies decided to payout again!). As you might expect, monthly dividend income looks like it has dropped significantly because of the elimination of $2,500 of special dividends that came from ORI. This results in the Taxable Account generating an estimated average of $1,570.70/month of dividend income in 2022. This is substantially lower than the average monthly income of $1,704.23 generated in 2021 (running at about -7.8% behind 2021 performance).
A new item for readers to consider is the impact of draws on the Taxable Account which started in January in the amount of $1,000/month. The good news is that the portfolio generates more monthly income from dividends and distributions than John and Jane are looking to withdraw. The challenge for me is that I am used to running an account that is typically flush with cash. Therefore, I will need to be more considerate of cash balances available at a given time. This also underscores the importance of the Cash Balance table in the images below that tracks the amount of cash on hand.
SNLH = Stocks No Longer Held – Dividends in this row represent the dividends collected on stocks that are no longer held in that portfolio. We still count the dividend income that comes from stocks no longer held in the portfolio, even though it is non-recurring. All images below come from Consistent Dividend Investor, LLC. (also referred to as CDI as the source below).
2022 – March – Taxable Dividend Breakdown (CDI)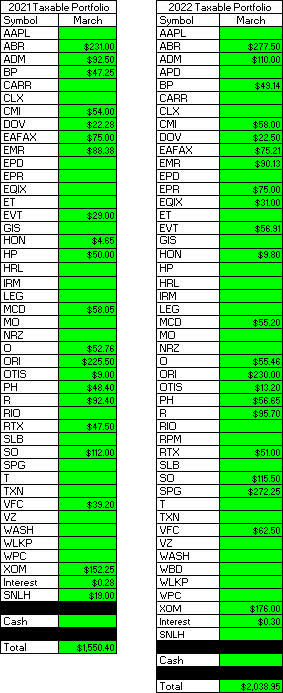
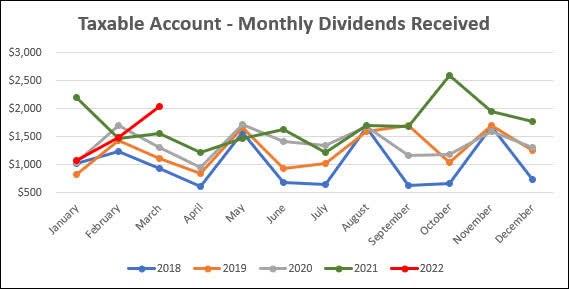
Here is a graphical illustration of the dividends received on a monthly basis. I have begun updating the chart to also reflect the dividends earned going back to January of 2018.
2022 – March – Taxable Monthly Dividend Graph (CDI) 2022 – March – Taxable Monthly Dividend Line Graph (CDI)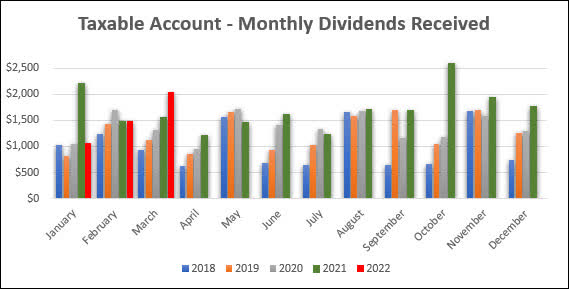
The table below represents all income generated in 2021 and collected/expected dividends in 2022.
2022 – March – Taxable Annual Estimate (CDI)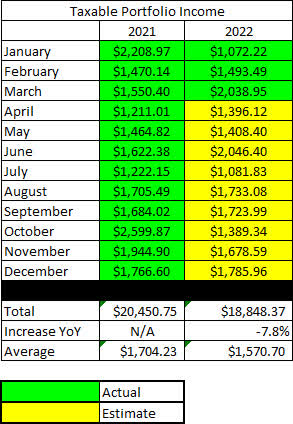
Below gives an extended look back at the dividend income generated when I first began writing these articles.
2022 – March – Taxable Dividend History (CDI)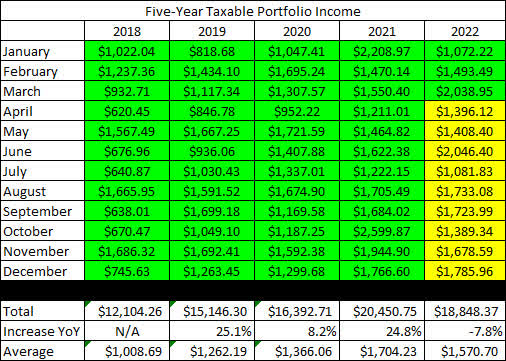
The Taxable Account balances below are from March 31, 2022, and all previous months are taken from the end-of-month statement provided by Charles Schwab.
2022 – March – Taxable Month End Balance (CDI)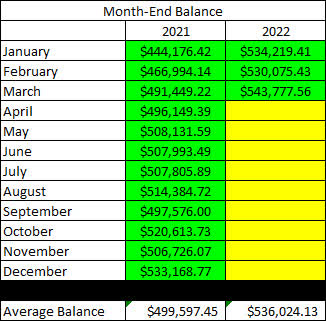
The next image is the only new table being added to the report for 2022. As mentioned previously, this is the first year that John and Jane will begin taking withdrawals from their Taxable Account (and John’s Traditional IRA). For this reason, I want to keep a record of these withdrawals because they will also have an impact on the account balance in the cash balance table (after this image).
2022 – March – Taxable Withdrawals (CDI)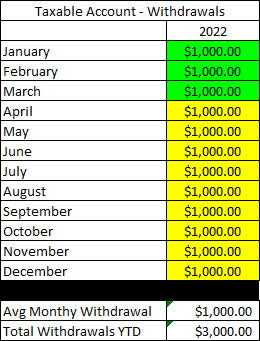
The next image indicates how much cash John and Jane had in their Taxable Account at the end of the month as indicated on their Charles Schwab statements.
2022 – March – Taxable Cash Balance (CDI)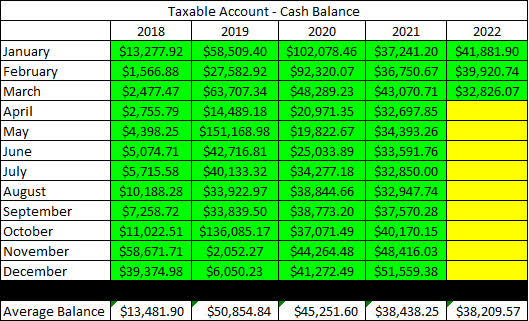
There were large changes in cash at the end of 2019 and then again in 2020 (this was from the purchase of a physical asset and the sale of another) which explains why the balance fluctuated so much during this time. A lot of cash was deployed in March and April of 2020 as the pandemic caused share prices to plummet. John and Jane no longer qualify to make contributions to their Traditional or Roth IRAs, so there will also not be any funds taken from the Taxable Account to cover these contributions (which is what they typically did in the past).
The next image provides a history of the unrealized gain/loss at the end of each month going back to the beginning in January of 2018.
2022 – March – Taxable Unrealized Gain-Loss (CDI)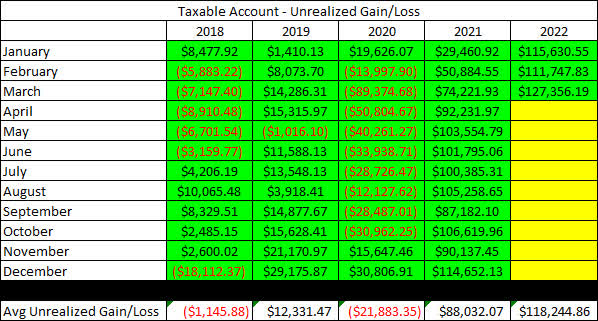
The main reason for including this is to help readers understand that the key to this strategy is to accept the risk, and I personally find that this table is an excellent representation of the volatility in the account. It is important to remember that tolerance for risk can vary significantly, but John and Jane are okay with additional risk because they are focused on generating income from these stocks.
In an effort to be transparent about John and Jane’s Taxable Account, I like to include an unrealized Gain/Loss summary. The numbers used are based on the closing prices from April 13, 2022.
2022 – March – Taxable Gain-Loss Update (CDI)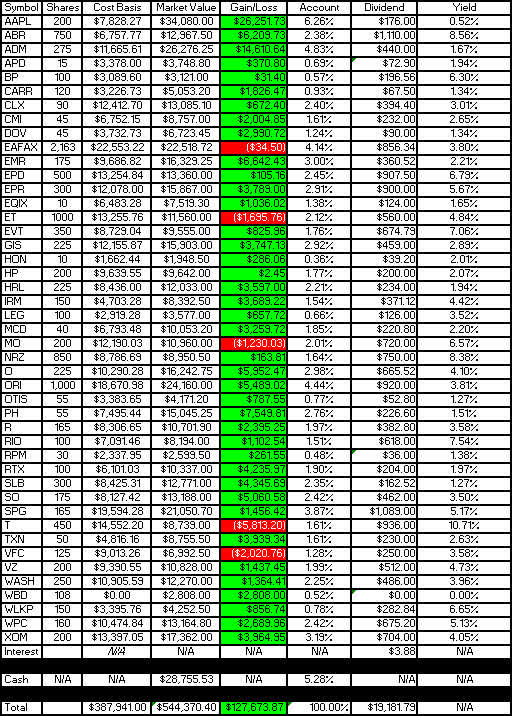
When reading the yield column, it is important to understand that the dividend yield is dependent on whether or not we have received a full year of income (this is the only way to keep it mostly accurate without requiring a lot of manual input or calculation on my part). I have updated these for the start of the year, so all yields reflected in the last column are accurate. I actually prefer this method because it will show the reduced yield of a position added partway through the year (thus reflecting an accurate benefit vs. inflated benefit).
Lastly, I wanted to include the Monthly Year-Over-Year Income Comparison to show how the Taxable Account is trending.
2022 – March – Taxable Monthly Year-Over-Year Comparison (CDI)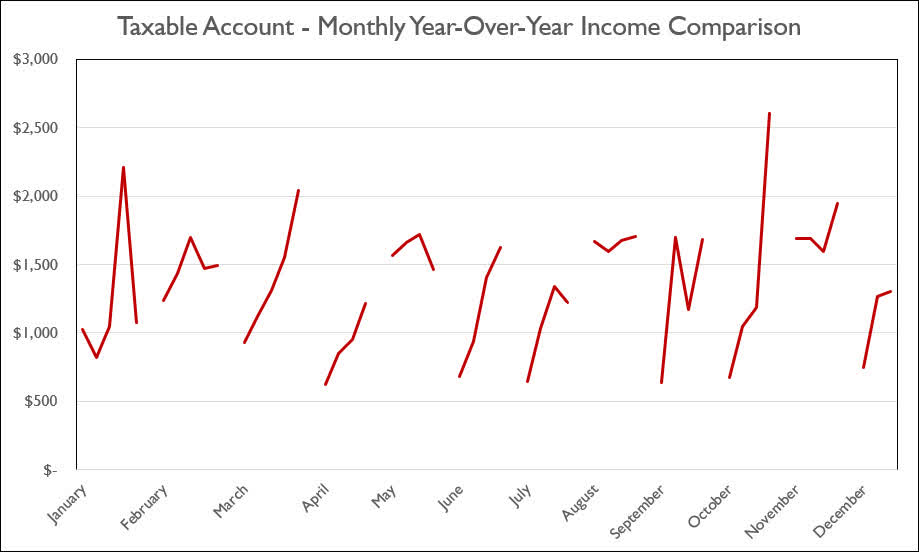
Conclusion
March marks another month where John and Jane’s dividend income in their Taxable Account exceeded $2,000 and I fully expect that we will see dividends reach this level a few more times over the course of 2022.
John and Jane have deployed a fair amount of cash over the last three months in order to take advantage of high-quality stocks like APD, CLX, and RPM that were selling at 52-week-lows. We are constantly reviewing the portfolio to determine if we need to trim or eliminate positions that have become excessively valued (think 52-week-highs).
In John and Jane’s Taxable Account, they are currently long the following mentioned in this article: Apple (NASDAQ:AAPL), Arbor Realty (NYSE:ABR), Archer-Daniels-Midland (NYSE:ADM), Air Products and Chemicals (APD), BP (NYSE:BP), Carrier Global Corporation (NYSE:CARR), Clorox (NYSE:CLX), Cummins (NYSE:CMI), Dover Corporation (NYSE:DOV), Eaton Vance Floating-Rate Advantage Fund A (MUTF:EAFAX), Emerson Electric (EMR), Enterprise Products Partners (NYSE:EPD), EPR Properties (NYSE:EPR), Equinix (NASDAQ:EQIX), Energy Transfer (NYSE:ET), Eaton Vance Tax-Advantaged Dividend Income Fund (NYSE:EVT), General Mills (NYSE:GIS), Honeywell (NASDAQ:HON), Helmerich & Payne (NYSE:HP), Hormel (NYSE:HRL), Iron Mountain (NYSE:IRM), Leggett & Platt (NYSE:LEG), McDonald’s (MCD), Altria (NYSE:MO), New Residential (NYSE:NRZ), Realty Income (O), Old Republic International (ORI), Otis Worldwide Corporation (NYSE:OTIS), Parker-Hannifin (NYSE:PH), Ryder System (NYSE:R), Rio Tinto (RIO), RPM International (RPM), Raytheon Technologies (NYSE:RTX), Schlumberger (NYSE:SLB), Southern Company (NYSE:SO), Simon Property Group (SPG), AT&T (NYSE:T), Texas Instruments (NASDAQ:TXN), V.F. Corporation (VFC), Verizon (NYSE:VZ), Washington Trust (NASDAQ:WASH), Warner Bros Discovery (WBD), Westlake Chemical (NYSE:WLKP), W. P. Carey (NYSE:WPC), and Exxon Mobil (XOM).
Editor’s Note: This article discusses one or more securities that do not trade on a major U.S. exchange. Please be aware of the risks associated with these stocks.
Be the first to comment