

sommart
Background
For those who are interested in John and Jane’s full background, please click the following link here for the last time I published their full story. The details below are updated for 2022.
- This is a real portfolio with actual shares being traded.
- I am not a financial advisor and merely provide guidance based on a relationship that goes back several years.
- John retired in January 2018 and now only collects Social Security income as his regular source of income.
- Jane officially retired at the beginning of 2021, and she is collecting Social Security as her only regular source of income.
- John and Jane have decided to start taking draws from the Taxable Account and John’s Traditional IRA to the tune of $1,000/month each. These draws are currently covered in full by the dividends generated in each account.
- John and Jane have other investments outside of what I manage. These investments primarily consist of minimal-risk bonds and low-yield certificates.
- John and Jane have no debt and no monthly payments other than basic recurring bills such as water, power, property taxes, etc.
I started helping John and Jane with their retirement accounts because I was infuriated by the fees their previous financial advisor was charging them. I do not charge John and Jane for anything that I do, and all I have asked of them is that they allow me to write about their portfolio anonymously in order to help spread knowledge and to make me a better investor in the process.
Generating a stable and growing dividend income is the primary focus of this portfolio, and capital appreciation is the least important characteristic. My primary goal was to give John and Jane as much certainty in their retirement as I possibly can because this has been a constant point of stress over the last decade.
Dividend Decreases
No stocks in Jane’s Traditional or Roth IRA paid a decreased dividend during the month of July.
Dividend And Distribution Increases
Six companies paid increased dividends/distributions or a special dividend during the month of July in the Traditional and Roth IRAs.
- American Tower (AMT)
- Alexandria Real Estate (ARE)
- Bank of Nova Scotia (BNS)
- Canadian Imperial Bank of Commerce (CM)
- Realty Income (O)
- W. P. Carey (WPC)
I covered Realty Income and W. P. Carey in the Taxable Account update so I will only include information about the dividend increase. For those interested in reading the summary of these two companies the link is included at the end of the article.
American Tower
AMT saw strong Q2-2022 earnings resulted in a raised AFFO/share outlook to $9.62-$9.86/share and continued with the streak of regular quarterly increases. The only real concern I had was the material impact on earnings from the rise in interest rates since this impacts the purchase of CoreSite (COR) back at the end of 2021 in an all-cash deal for $10.1 billion. AMT’s stock price has seen a stronger recovery in comparison to Crown Castle (CCI) over the last several months.
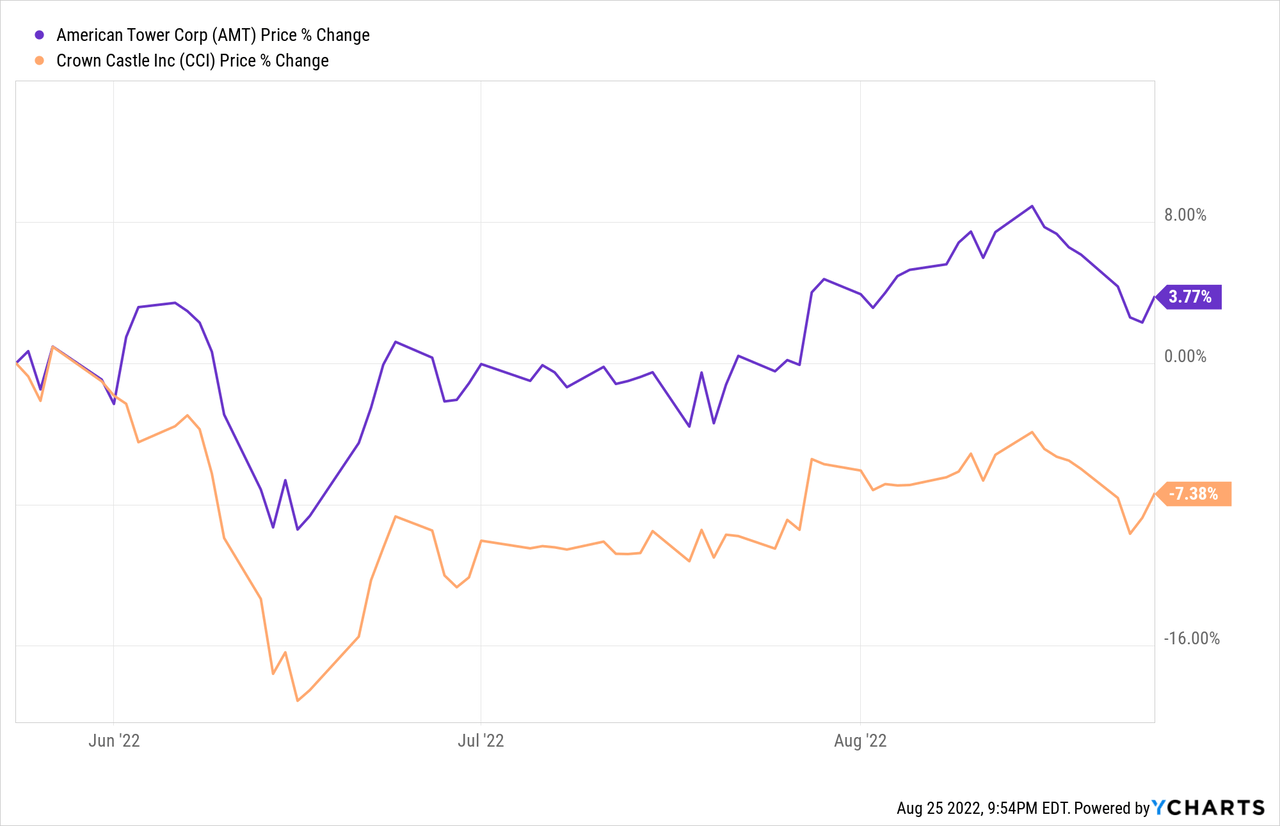
The dividend was increased from $1.40/share per quarter to $1.43/share per quarter. This represents an increase of 2.1% and a new full-year payout of $5.72/share compared with the previous $5.60/share. This results in a current yield of 2.13% based on the current share price of $268.24.
Alexandria Real Estate
We recently established a position and then doubled the size of that holding in the last week. In my recent article, The Retirees Dividend Portfolio: Recent Purchases And Limit Trades Through August 19th, I noted ARE is seeing an “overall discount relative to the rest of the REIT market including other sectors that we have been bullish on such as communications infrastructure. With stocks like American Tower (AMT) fully recovering their share price we saw ARE as a strong alternative that offers both capital appreciation, current yield, and potential dividend growth.” We still see a lot of capital appreciation upside ahead for ARE as the current discount continues to shrink.
ARE – FastGraphs – 2022-8 (FastGraphs)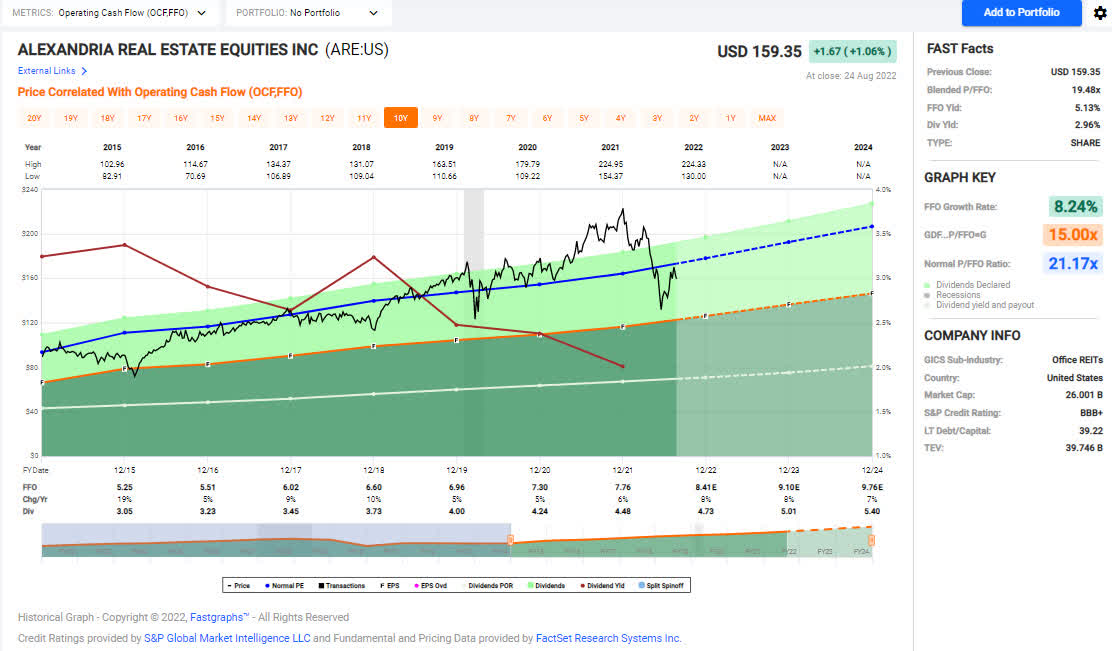
The dividend was increased from $1.15/share per quarter to $1.18/share per quarter. This represents an increase of 2.6% and a new full-year payout of $4.72/share compared with the previous $4.60/share. This results in a current yield of 2.91% based on the current share price of $161.95.
Bank of Nova Scotia
BNS is one of two Canadian banks that increased their dividend in the month of July. We recently trimmed the position in BNS a few months ago due to limited upside. After about three months the stock price is below what we sold the positions for and reinvested in other sectors. One of my concerns in the event of a recession is that the impact to Canada’s housing market could potentially trigger major losses at financial institutions since they continue to hold most of the mortgages they originate. To be clear, I am not saying that I see collapse on the horizon but we have trimmed the size of the position for that reason.
BNS – FastGraphs – 2022-8 (FastGraphs)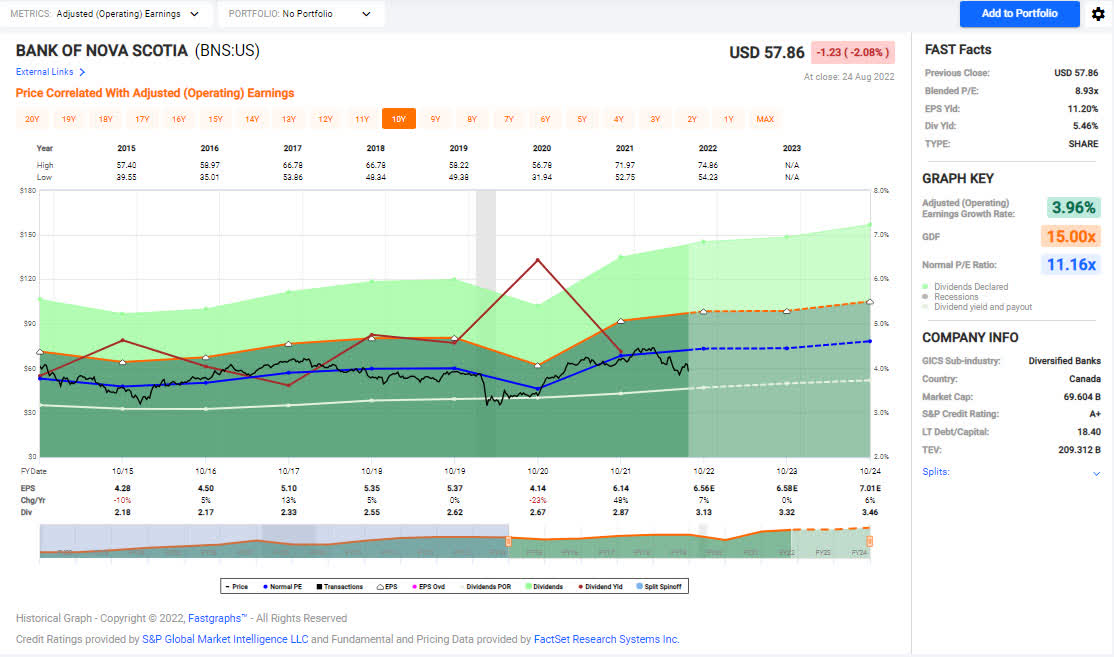
The dividend was increased from $1.00/share CAD per quarter to $1.03/share CAD per quarter. This represents an increase of 3% and a new full-year payout of $4.12/share CAD compared with the previous $4.00/share CAD. This results in a current yield of 5.49% based on the current share price of $57.86.
Canadian Imperial Bank of Commerce
CM is the other Canadian bank that increased its dividend that was payable during the month of July. We also trimmed the high-cost shares for a small gain and would prepare to add more shares if the price dipped into the low $40/share range. CM faces the same issues as BNS in the sense that its yields are increasing but these are being offset by setting aside more loan/loss reserves to cover the increase in expected future losses.
CM – FastGraphs – 2022-8 (FastGraphs)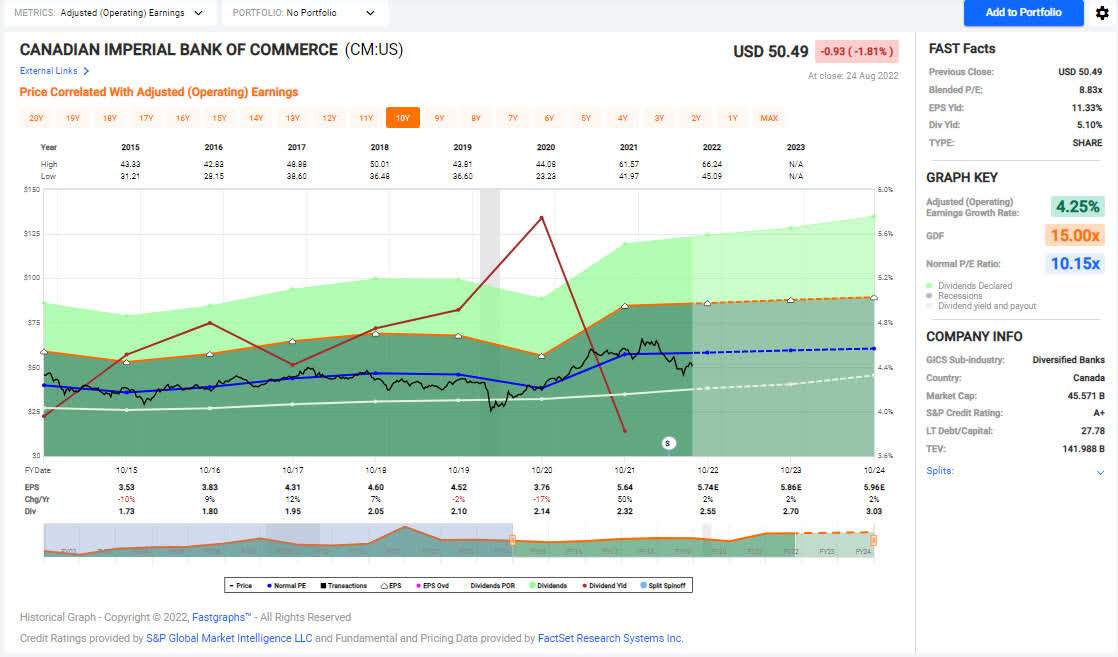
The dividend was increased from $.81/share CAD per quarter to $.83/share CAD per quarter. This represents an increase of 3.1% and a new full-year payout of $3.32/share CAD compared with the previous $3.24/share CAD. This results in a current yield of 5.06% based on the current share price of $50.56.
Realty Income
The dividend was increased from $.2470/share per month to $.2475/share per quarter. This represents an increase of .2% and a new full-year payout of $2.97/share compared with the previous $2.964/share. This results in a current yield of 4.18% based on the current share price of $71.02.
W. P. Carey
The dividend was increased from $1.057/share per quarter to $1.059/share per quarter. This represents an increase of .2% and a new full-year payout of $.4.236/share compared with the previous $4.228/share. This results in a current yield of 4.89% based on the current share price of $86.69.
Retirement Account Positions
There are currently 39 different positions in Jane’s Traditional IRA and 23 different positions in Jane’s Roth IRA. While this may seem like a lot, it is important to remember that many of these stocks cross over in both accounts and are also held in the Taxable Portfolio.
Below is a list of the trades that took place in the Traditional IRA during the month of July.
Traditional IRA – 7-2022 – Trades (Charles Schwab)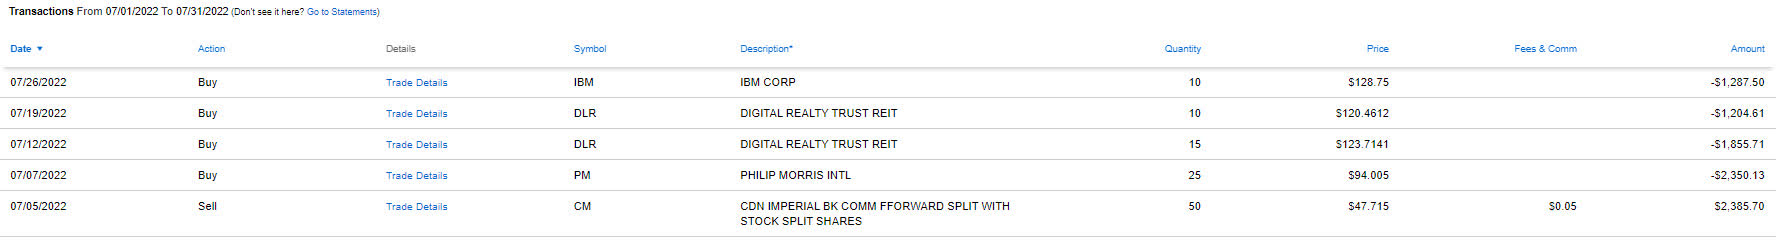
Below is a list of the trades that took place in the Roth IRA during the month of July.
Roth IRA – 7-2022 – Trades (Charles Schwab)
For a more detailed discussion about these trades and the rationale behind them please see my articles on Recent Purchases and Limit Trades.
July Income Tracker – 2021 Vs. 2022
Income for the month of July was flat year-over-year for Jane’s Traditional IRA and up modestly for the Roth IRA. The average monthly income for the Traditional IRA in 2022 is expected to be up about 11.1% based on current estimates (this is up from 5.3% in May due to LYB’s special dividend) and the Roth IRA is looking to grow by 6.3%. This means the Traditional IRA would generate an average monthly income of $1,539.41/month and the Roth IRA would generate an average income of $629.74/month. This compares with 2021 figures that were $1,386.13/month and $592.61/month, respectively.
SNLH = Stocks No Longer Held – Dividends in this row represent the dividends collected on stocks that are no longer held in that portfolio. We still count the dividend income that comes from stocks no longer held in the portfolio even though it is non-recurring.
All images below come from Consistent Dividend Investor, LLC. (Abbreviated to CDI).
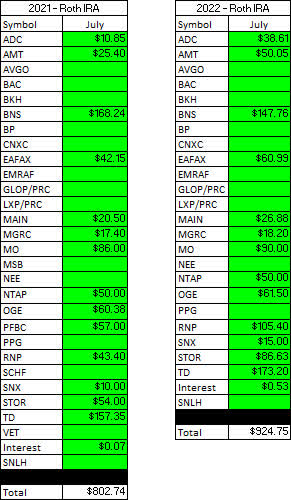
Traditional IRA – 2021 V 2022 – July Dividends (CDI) Roth IRA – 2021 V 2022 – July Dividends (CDI)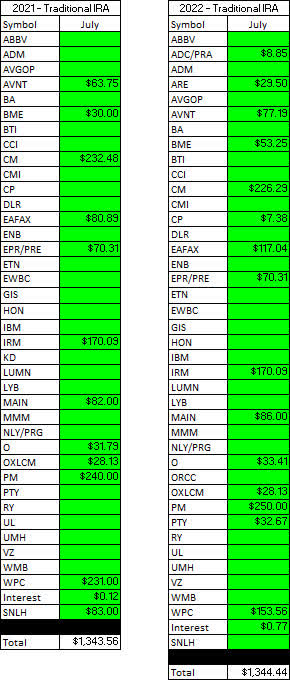
Here is a graphical illustration of the dividends received on a monthly basis for the Traditional and Roth IRAs.
Retirement Projections – 2022 – July – Monthly Dividends (Bar Graph) (CDI)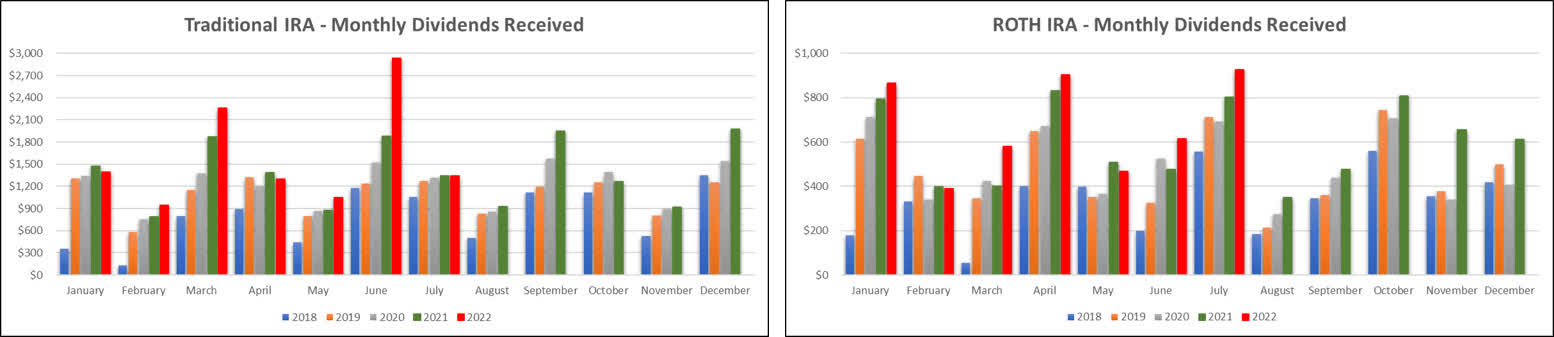
The table below represents the actual full-year results for 2022 and the prior year.
Retirement Projections – 2022 – July (CDI)
Below is an expanded table that shows the full dividend history since inception for both the Traditional IRA and Roth IRA.
Retirement Projections – 2022 – July – 5 YR History (CDI)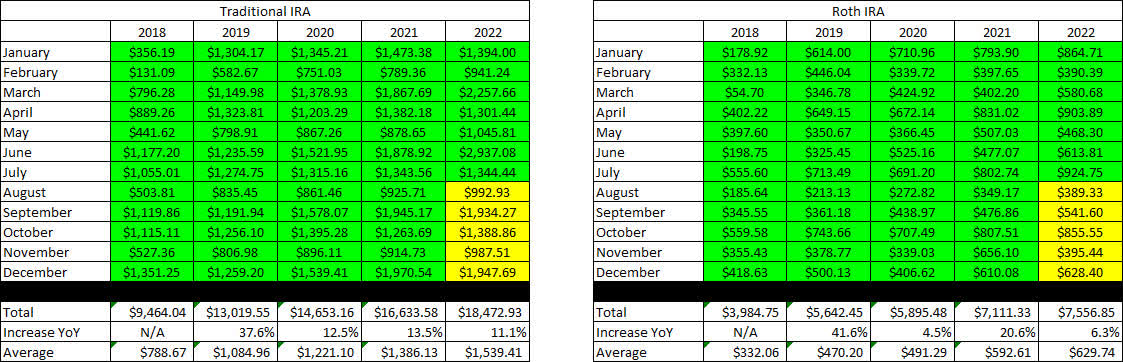
I have included line graphs that better represent the trends associated with Jane’s monthly dividend income generated by her retirement accounts. The images below represent the Traditional IRA and Roth IRA, respectively.
Retirement Projections – 2022 – July – Monthly Dividends (CDI)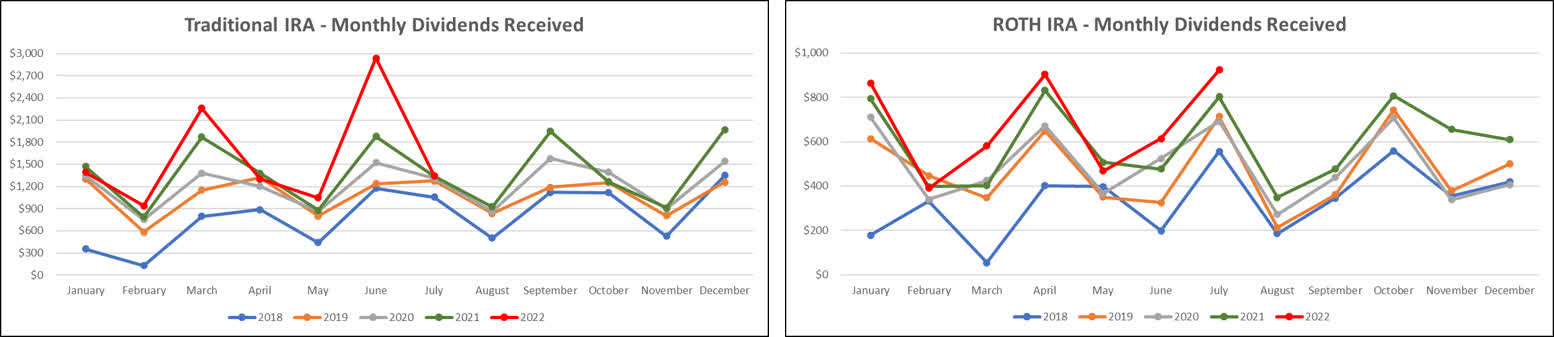
Here is a table to show how the account balances stack up year over year (I previously used a graph but believe the table is more informative).
It is worth noting that with John and Jane Retired, there will be no additional contributions to these accounts. In fact, they have already begun to take regular distributions from the Taxable Account and John’s Traditional IRA.
Retirement Account Balances – 2022 – July (CDI)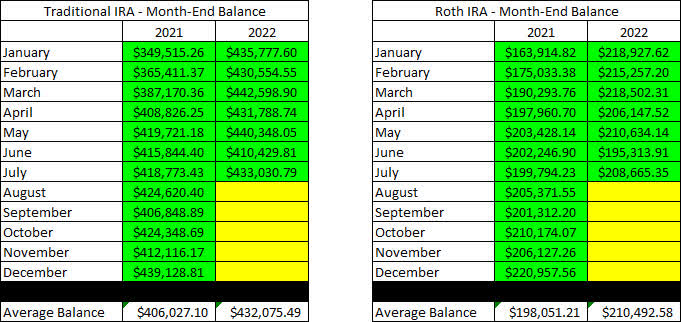
The next images are the tables that indicate how much cash Jane had in her Traditional and Roth IRA Accounts at the end of the month as indicated on their Charles Schwab statements.
Retirement Projections – 2022 – July – Cash Balances (CDI)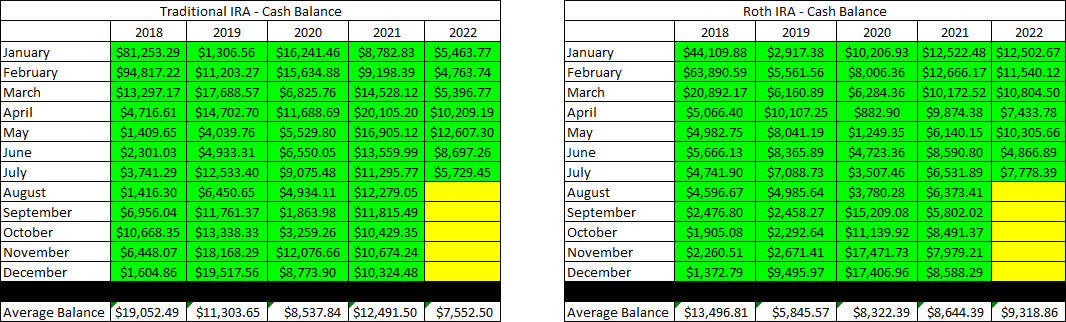
The next image provides a history of the unrealized gain/loss at the end of each month in the Traditional and Roth IRAs going back to the beginning in January of 2018.
Retirement Projections – 2022 – July – Unrealized Gain-Loss (CDI)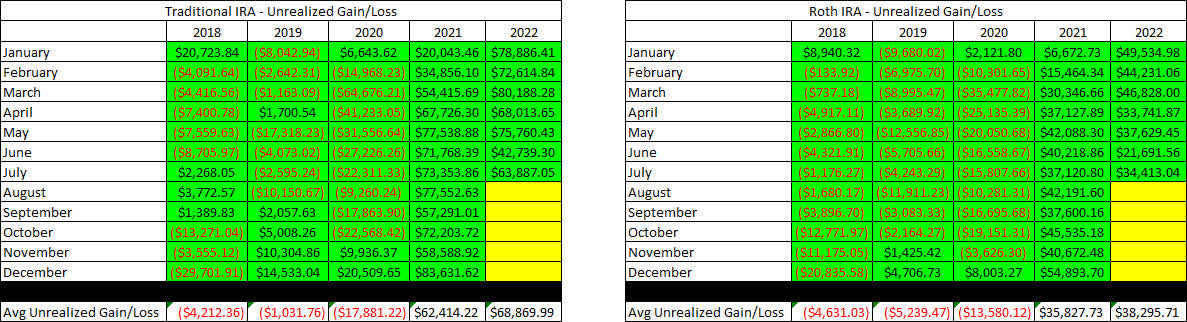
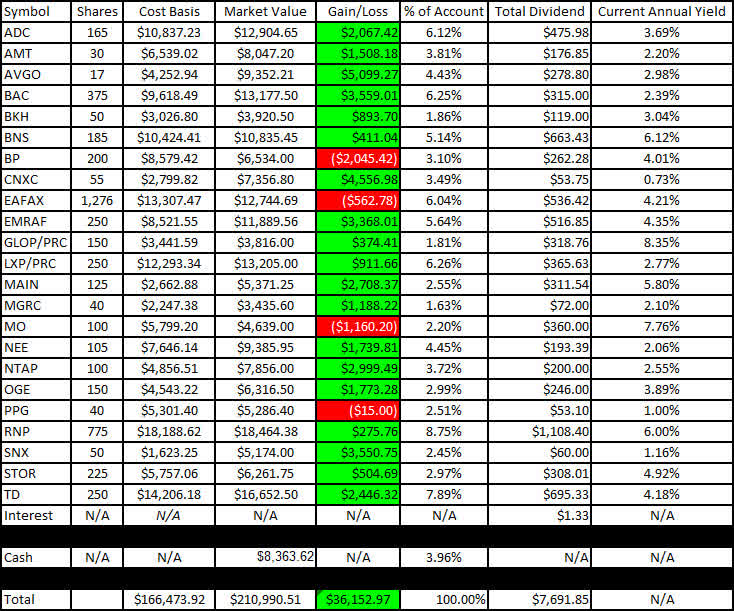
I like to show readers the actual unrealized gain/loss associated with each position in the portfolio because it is important to consider that in order to become a proper dividend investor, it is necessary to learn how to live with volatility. The market value and cost basis below are accurate at the market close on August 25th.
Here is the unrealized gain/loss associated with Jane’s Traditional and Roth IRAs.
Traditional IRA – 2022 – July – Gain-Loss (CDI) Roth IRA – 2022 – July – Gain-Loss (CDI)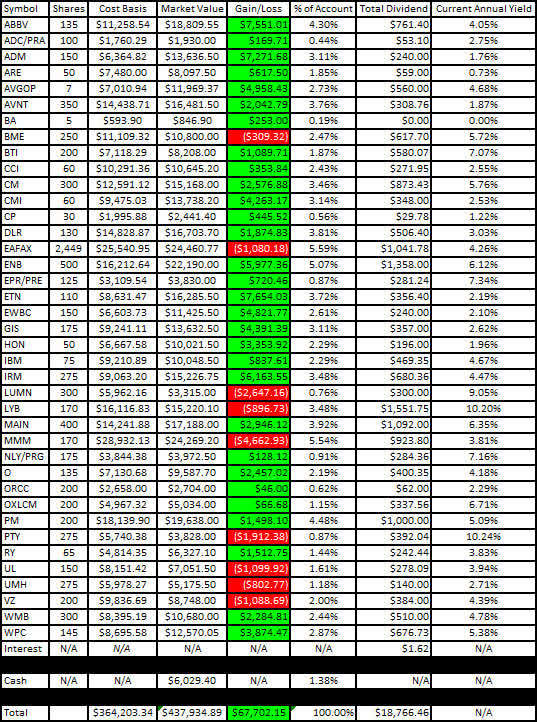
The last two graphs show how dividend income has increased, stayed the same, or decreased in each respective month on an annualized basis. I believe that the graph will continue to become more valuable as more years of data become available (with the fifth year of data being added, we can really see the trajectory of the income change for each month).
Traditional IRA – 2022 – July – Monthly Year-Over-Year Comparison (CDI) Roth IRA – 2022 – July – Monthly Year-Over-Year Comparison (CDI)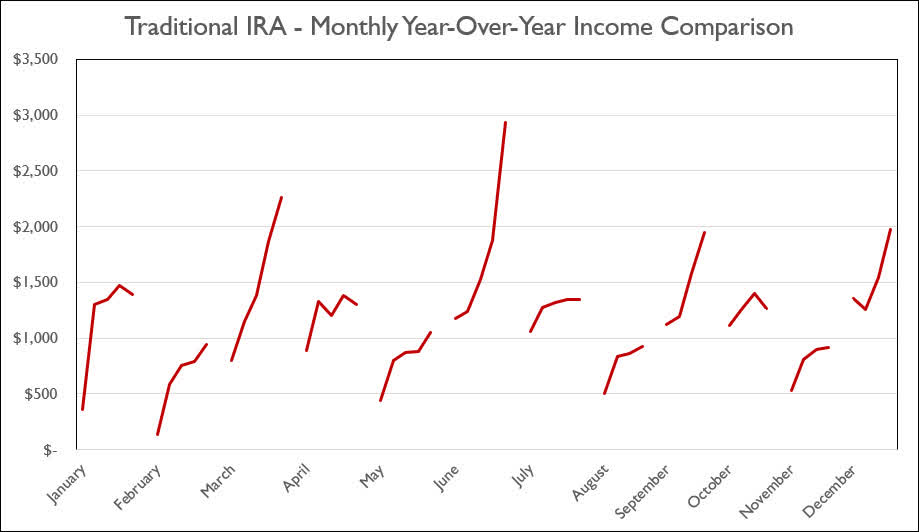

Conclusion
July saw balances recover considerably and we also saw the Roth IRA produce the highest amount of dividends ever. All of the retirement accounts for John and Jane have continued to push higher and produce record-high monthly income. This is welcome news because COVID was a moderate setback for dividend growth (John’s portfolio was negatively impacted greater than Jane’s retirement portfolio).
July Articles
I have provided the link to the July 2022 Taxable Account below.
The Retirees’ Dividend Portfolio: John And Jane’s July Taxable Account Update
In Jane’s Traditional and Roth IRAs, she is currently long the following mentioned in this article: AbbVie (NYSE:ABBV), Agree Realty (NYSE:ADC), Agree Realty Preferred Series A (ADC.PRA), Archer-Daniels-Midland (NYSE:ADM), Broadcom (NASDAQ:AVGO), Avient (NYSE:AVNT), Broadcom Preferred Series A (NASDAQ:AVGOP), Boeing (NYSE:BA), Bank of America (NYSE:BAC), Black Hills Corp. (NYSE:BKH), BlackRock Health Sciences Trust (NYSE:BME), Bank of Montreal (NYSE:BMO), Bank of Nova Scotia (NYSE:BNS), BP (NYSE:BP), British American Tobacco (NYSE:BTI), Canadian Imperial Bank of Commerce (NYSE:CM), Cummins (NYSE:CMI), Concentrix (NASDAQ:CNXC), Digital Realty (NYSE:DLR), Eaton Vance Floating-Rate Advantage Fund A (MUTF:EAFAX), Enbridge (NYSE:ENB), EPR Properties Preferred Series E (NYSE:EPR.PE), Eaton Corporation (NYSE:ETN), Emera Inc. (OTCPK:EMRAF), East West Bancorp (NASDAQ:EWBC), General Mills (NYSE:GIS), GasLog Partners Preferred C (NYSE:GLOP.PC), Honeywell (NASDAQ:HON), International Business Machines (NYSE:IBM), Iron Mountain (NYSE:IRM), Lexington Realty Preferred Series C (NYSE:LXP.PC), Lumen Technologies (NYSE:LUMN), LyondellBasell (NYSE:LYB), Main Street Capital (NYSE:MAIN), McGrath RentCorp (NASDAQ:MGRC), 3M (NYSE:MMM), Altria (NYSE:MO), Annaly Capital Preferred Series G (NYSE:NLY.PG), NextEra Energy (NYSE:NEE), NetApp (NASDAQ:NTAP), Realty Income (NYSE:O), OGE Energy Corp. (NYSE:OGE), Oxford Lane Capital Corp. 6.75% Cum Red Pdf Shares Series 2024 (NASDAQ:OXLCM), Philip Morris (NYSE:PM), PPG Industries (NYSE:PPG), PIMCO Corporate & Income Opportunity Fund (PTY), Cohen & Steers REIT & Preferred Income Fund (NYSE:RNP), Royal Bank of Canada (NYSE:RY), TD SYNNEX Corp. (NYSE:SNX), STORE Capital (NYSE:STOR), Toronto-Dominion Bank (NYSE:TD), Unilever (NYSE:UL), UMH Properties (UMH), Verizon (NYSE:VZ), Williams Companies (NYSE:WMB), W. P. Carey (NYSE:WPC).
Be the first to comment