

Pgiam/iStock via Getty Images
In two prior articles (here) and (here), we discussed the long-term results of investing in the 3X ProShares S&P 500 fund (UPRO) and the 2X ProShares 500 fund SSO since 2010. Now we want to look at the long-term results of a leveraged Nasdaq ETF.
The ProShares Ultra QQQ (NYSEARCA:QLD) is a leveraged ETF designed to earn two times the daily return of the Nasdaq 100. The ProShares’ statement concerning this ETF is the same as the others, which we’ll repeat here:
This leveraged ProShares ETF seeks a return that is 2x the return of the Nasdaq 100 for a single day, as measured from one NAV calculation to the next.
Due to the compounding of daily returns, holding periods of greater than one day can result in returns that are significantly different than the target return, and ProShares’ returns over periods other than one day will likely differ in amount and possibly direction from the target return for the same period. These effects may be more pronounced in funds with larger or inverse multiples and in funds with volatile benchmarks.
The performance goal of QLD is a one-day goal, and ProShares does a pretty good job of achieving it except during extreme market conditions when futures’ index prices diverge from the actual index. Due to this short-time leveraged setup, many short-term traders use 2X and 3X ETFs for three-to-five-day trades trying to scalp gains. If the holding period of the trade is short, investors may realize the 2X or 3X performance of the underlying index.
Long-term results
However, as traders soon learn, many short-term trades end up as long-term investments when market goes against one. So, what has been the long-term performance of QLD?
To measure results, we chose February 6th, 2010 as the starting date since it allows us to compare all ProShares leveraged funds over the same time span. The outcome for QLD is shown in the chart below.
Long Term Graph of QLD versus QQQ (Michael McDonald)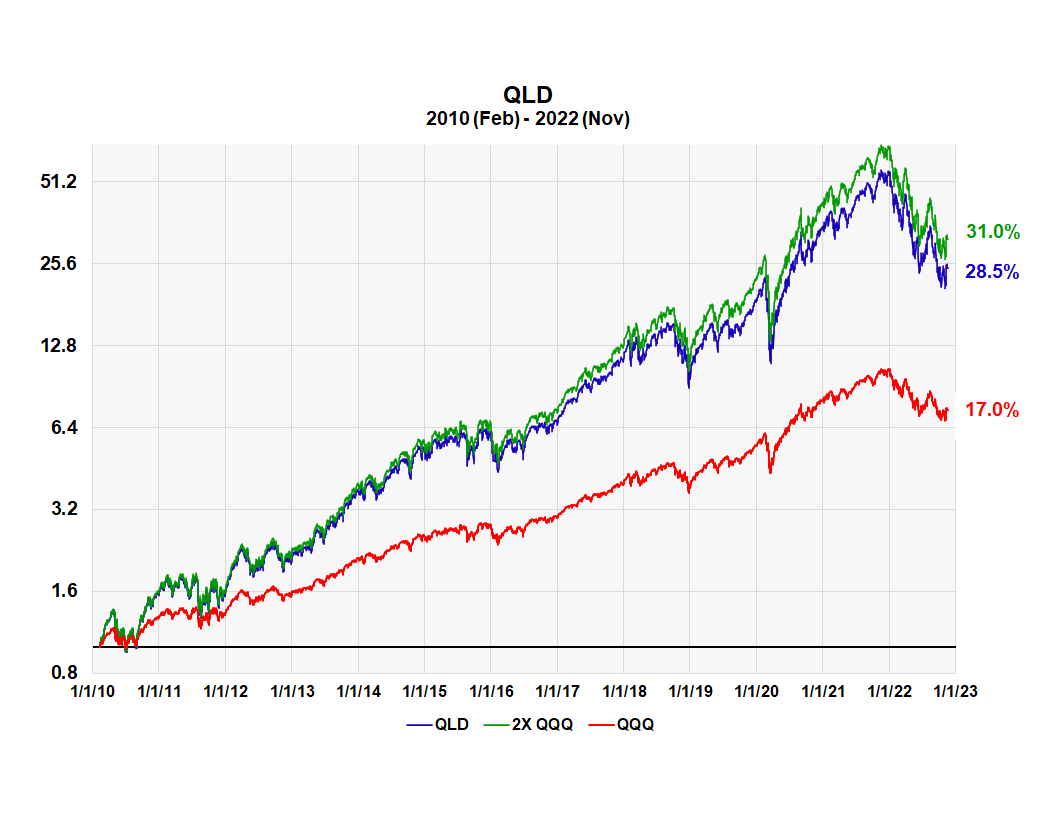
Without including dividends, the basic QQQ averaged an annual price return (less dividends) of 17%, whereas QLD had an annual return of 28.5%. This is 1.68 times the annual price return of QQQ (it’s interesting to note that this is the exact same ratio that SSO had with SPY). The green curve is our proxy for doing 2X the daily return of the QQQ, compounded daily. The annual theoretical return was 31%.
What does this mean dollar-wise? A $1,000 investment in QLD on the start date in 2010 would have increased to $54,250 by December 31st of last year. But, because there’s been a bear market since that date, the $54,250 has decreased to $24,750 as of November 18th. This is still quite a large return.
As we indicated in the other two articles on leveraged ETFs, most of this large gain is due to the long bull market that started after the financial crisis of 2007 and 2008. This bull market has been very strong so, as the motto says, one should never mistake brains for a bull market.
QLD through two bear markets
Like we did with SSO and UPRO, to see how QLD did through two bear markets, we set the start date to January 1, 2020, at the top of the market and just before the start of the COVID-induced bear market. The results are shown in the following graph.
QQQ and QLD through the two bear markets of the last three years. (Michael McDonald)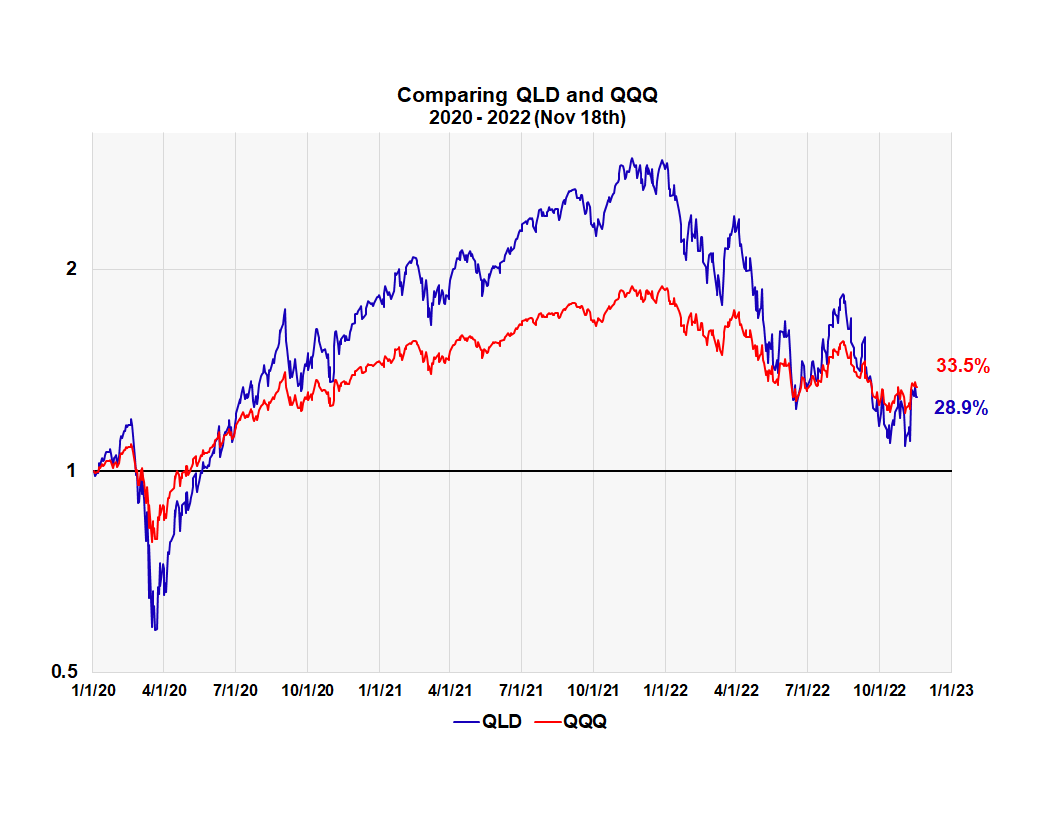
The 2020 COVID-induced bear market was followed by such a robust comeback that the Nasdaq 100’s (QQQ) overall return through the three-year period, not including dividends, is 33.5%. The QLD earned slightly less at 28.9%. While it’s not 2X or even 1.67 times the QQQ, it is still a decent return considering.
Why we think QLD is currently a long-term buy
We view QLD as a long-term buy because we view the entire market as a long-term buy. This is due to the extreme levels of bearish pessimism this bear market has generated through the summer and up to now in almost every sentiment indicator. We’ve detailed this and the theory behind it since June in the following articles: (here), (here), (here), (here), (here), (here), and (here).
That said, many sources speak to the risk of investing long term in a leveraged ETF. One primary risk is a market that goes up and down and goes nowhere. For example, suppose we have a market that goes up 3.1% one day then down 3% the next, and it does this every day for one year. What would be the expected returns?
At the end of one year, the QQQ would have a return of 4%, while the QLD would have a -14.4% return. So, to get the full advantage of the leverage long term, one needs a market that consistently advances with few corrective periods.
Summary
Barring unusual market conditions, traders in QLD should realistically anticipate achieving 2X the return of the QQQ over any short-term trade.
Long term, the picture gets cloudier as far as what to expect return-wise. As we know, the twelve-year return of QLD through one of the greatest bull markets in history averaged 1.6 times the long-term price return of QQQ. But that included extended periods of qualitative easing and abnormally low interest rates, which affect the carrying costs of leveraged investments. In other words, that period was a perfect storm as the saying goes, for leverage investments like QLD. If interest rates and carrying costs stay high, one should probably expect a lower multiple return compared to QQQ.
Also, while QLD has done well through the last two bear markets, if we are wrong about the long-term trend of the market and get into an extended up and down period with little price advance, while QQQ might have a small positive return, there is little doubt QLD would show a measurable decline.
Be the first to comment