

nevarpp
By Craig Lazzara
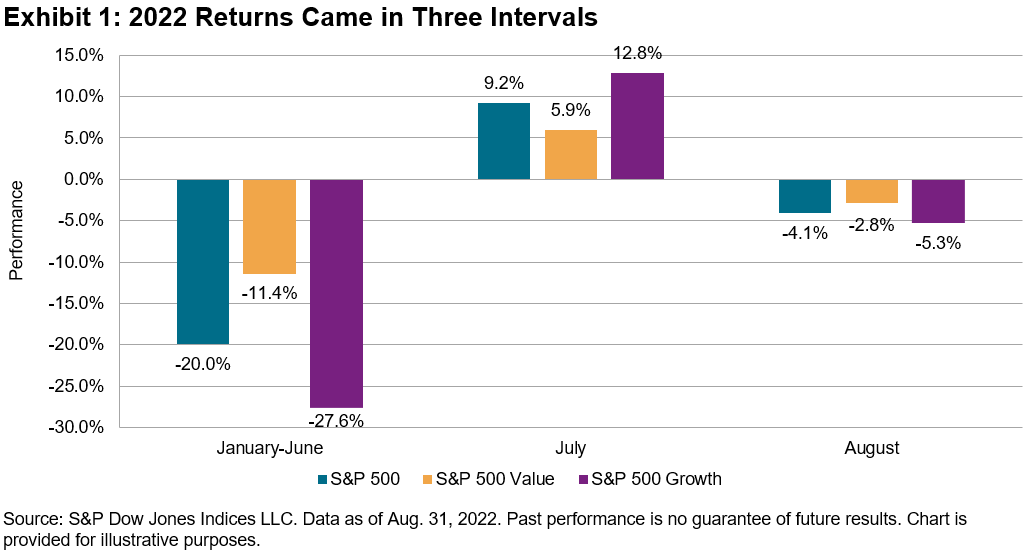
At some risk of oversimplification, the 16.1% decline in the S&P 500 for the first eight months of 2022 can be divided into three intervals, as the market fell by 20.0% through June, rallied in July, and then resumed its decline in August.
This story, of course, is still evolving: for all we now know, the market might continue to decline, penetrating its June lows. Alternatively, we might already be in the early stages of the next bull market. Some things, these among them, are knowable only well after the fact.
Exhibit 1 shows this year’s pattern of returns for the S&P 500, as well as for its Growth and Value components. When the market declined, Value outperformed, while Growth was the better-performing style in July’s rally.
Neither of these behaviors is particularly surprising. Growth typically outperforms when the market rises, and Value when the market falls (although Value’s defensive credentials are much less impressive than those of such stalwarts as Low Volatility or Dividend Aristocrats).
Although the direction of the style indices’ performance is unsurprising, the magnitude of the spread between their returns was remarkably large, as Exhibit 2 shows.
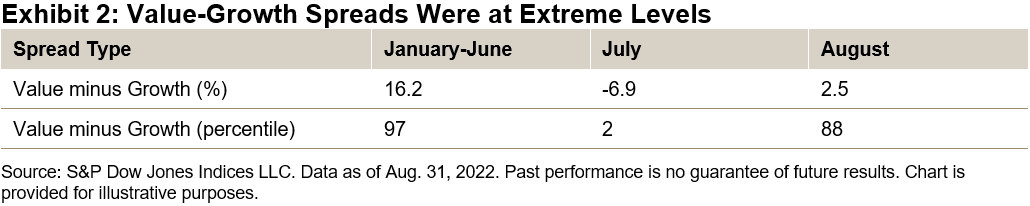
Taken over all six-month intervals in the history of our style indices, the 16.2% spread between Value and Growth in the first six months of the year was at the 97th percentile.
The tables turned in July, as the spread was at the opposite extreme of all one-month intervals. Results in August looked like those from the first six months. (If we calibrate the Value-Growth spread in dispersion units, the results are even more extreme.)
Given the size of the spreads (both positive and negative) between Value and Growth indices, it’s reasonable to ask what impact value and growth scores had on the performance of other factors.
We regularly score every stock in our database, and we therefore can compute aggregate value and growth scores for our most prominent factor indices. Exhibit 3 shows, for the first six months of 2022, the relationship between each factor index’s relative performance and the difference between its value and growth scores. Given the size of the Value-Growth spread in the first six months, the upward slope in Exhibit 3 is unsurprising.
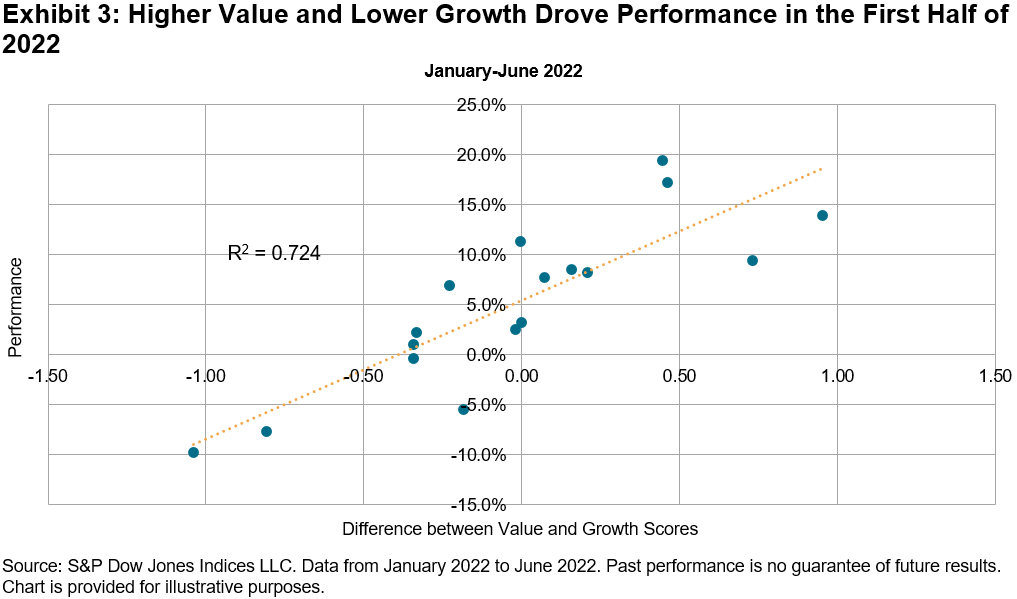
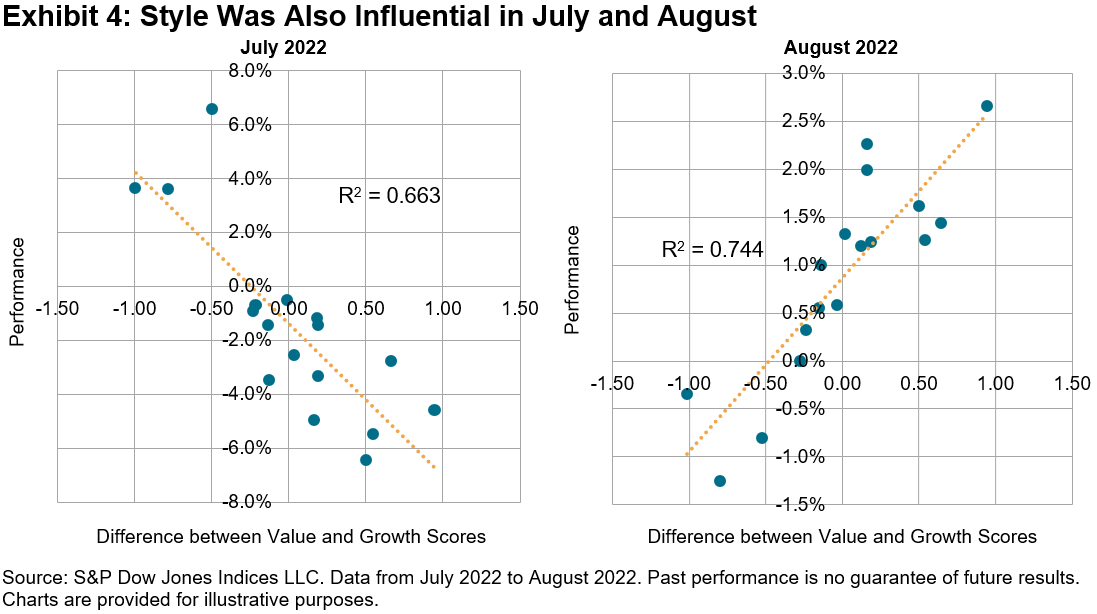
Exhibit 4 shows that the relationship ran in the opposite direction in July, whereas in August we again see a strong upward-sloping relationship. The predictive power in both cases is impressive for a single month.
We said earlier that it was too soon to say whether the bear market that began in January was over or merely quiescent, and the same is true about the influence of style on returns.
What seems reasonable to say is that if the differential performance of Value and Growth indices remains wide, the influence of style on other factors is likely to continue.
Disclosure: Copyright © 2022 S&P Dow Jones Indices LLC, a division of S&P Global. All rights reserved. This material is reproduced with the prior written consent of S&P DJI. For more information on S&P DJI please visit www.spdji.com. For full terms of use and disclosures please visit Terms of Use.
Editor’s Note: The summary bullets for this article were chosen by Seeking Alpha editors.
Be the first to comment