

undefined undefined/iStock via Getty Images
Retail sales rebounded strongly:
Advance estimates of U.S. retail and food services sales for January 2022, adjusted for seasonal variation and holiday and trading-day differences, but not for price changes, were $649.8 billion, an increase of 3.8 percent (±0.5 percent) from the previous month, and 13.0 percent (±0.9 percent) above January 2021. Total sales for November 2021 through January 2022 period were up 16.1 percent (±0.7 percent) from the same period a year ago. The November 2021 to December 2021 percent change was revised from down 1.9percent (±0.5percent) to down 2.5 percent (±0.3percent).
Here’s a chart of the data:
Retail Sales, FRED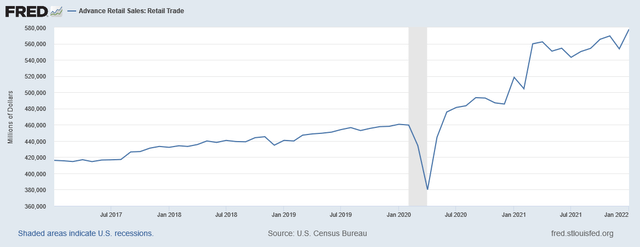
Sales are now at a 5-year high.
The US isn’t the only economy with an inflation problem. This is the latest CPI release for the UK:
The Consumer Prices Index including owner occupiers’ housing costs (CPIH) rose by 4.9% in the 12 months to January 2022, up from 4.8% to December 2021. This is the highest recorded 12-month inflation rate in the National Statistic series, which begins in January 2006, and the highest rate since CPIH stood at 5.1% in May 1992 in the historical modelled estimates. Inflation rates are currently influenced by the effects of the coronavirus (COVID-19) lockdowns in the previous year. The Office for National Statistics’ (ONS’) blog Beware Base Effects describes how relatively low prices for some items during those periods influence current inflation rates.
And the accompanying chart from the report:
UK CPI (Office of Statistics, UK)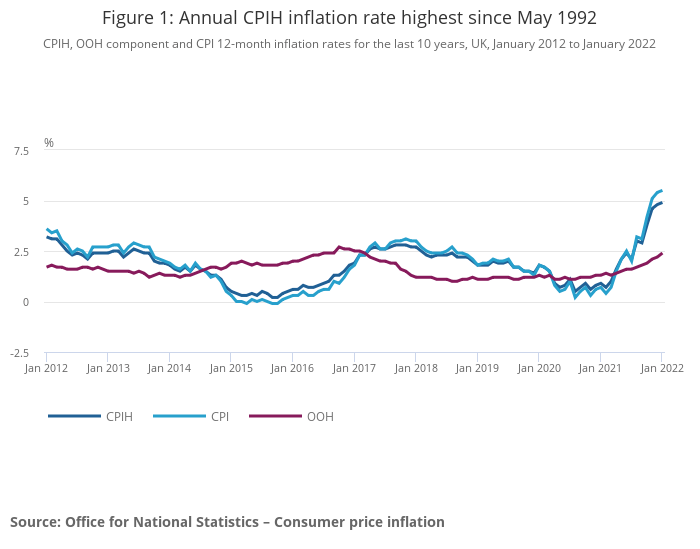
As a result, the UK recently raised interest rates.
The Bank of England’s Monetary Policy Committee (MPC) sets monetary policy to meet the 2% inflation target, and in a way that helps to sustain growth and employment. At its meeting ending on 2 February 2022, the MPC voted by a majority of 5-4 to increase Bank Rate by 0.25 percentage points, to 0.5%. Those members in the minority preferred to increase Bank Rate by 0.5 percentage points, to 0.75%.
Here is the inflation section from that release:
Twelve-month CPI inflation rose from 5.1% in November to 5.4% in December, almost 1 percentage point higher than expected at the time of the November Report. Inflation is expected to increase further in coming months, to close to 6% in February and March, before peaking at around 7¼% in April. This projected peak is around 2 percentage points higher than expected in the November Report. The projected overshoot of inflation relative to the 2% target mainly reflects global energy and tradable goods prices.
This is more or less a blueprint for the Federal Reserve.
Today, let’s take a look at three groups of charts to place current activity into a longer perspective.
1-year, 6-month, and 3-month SPY charts, FRED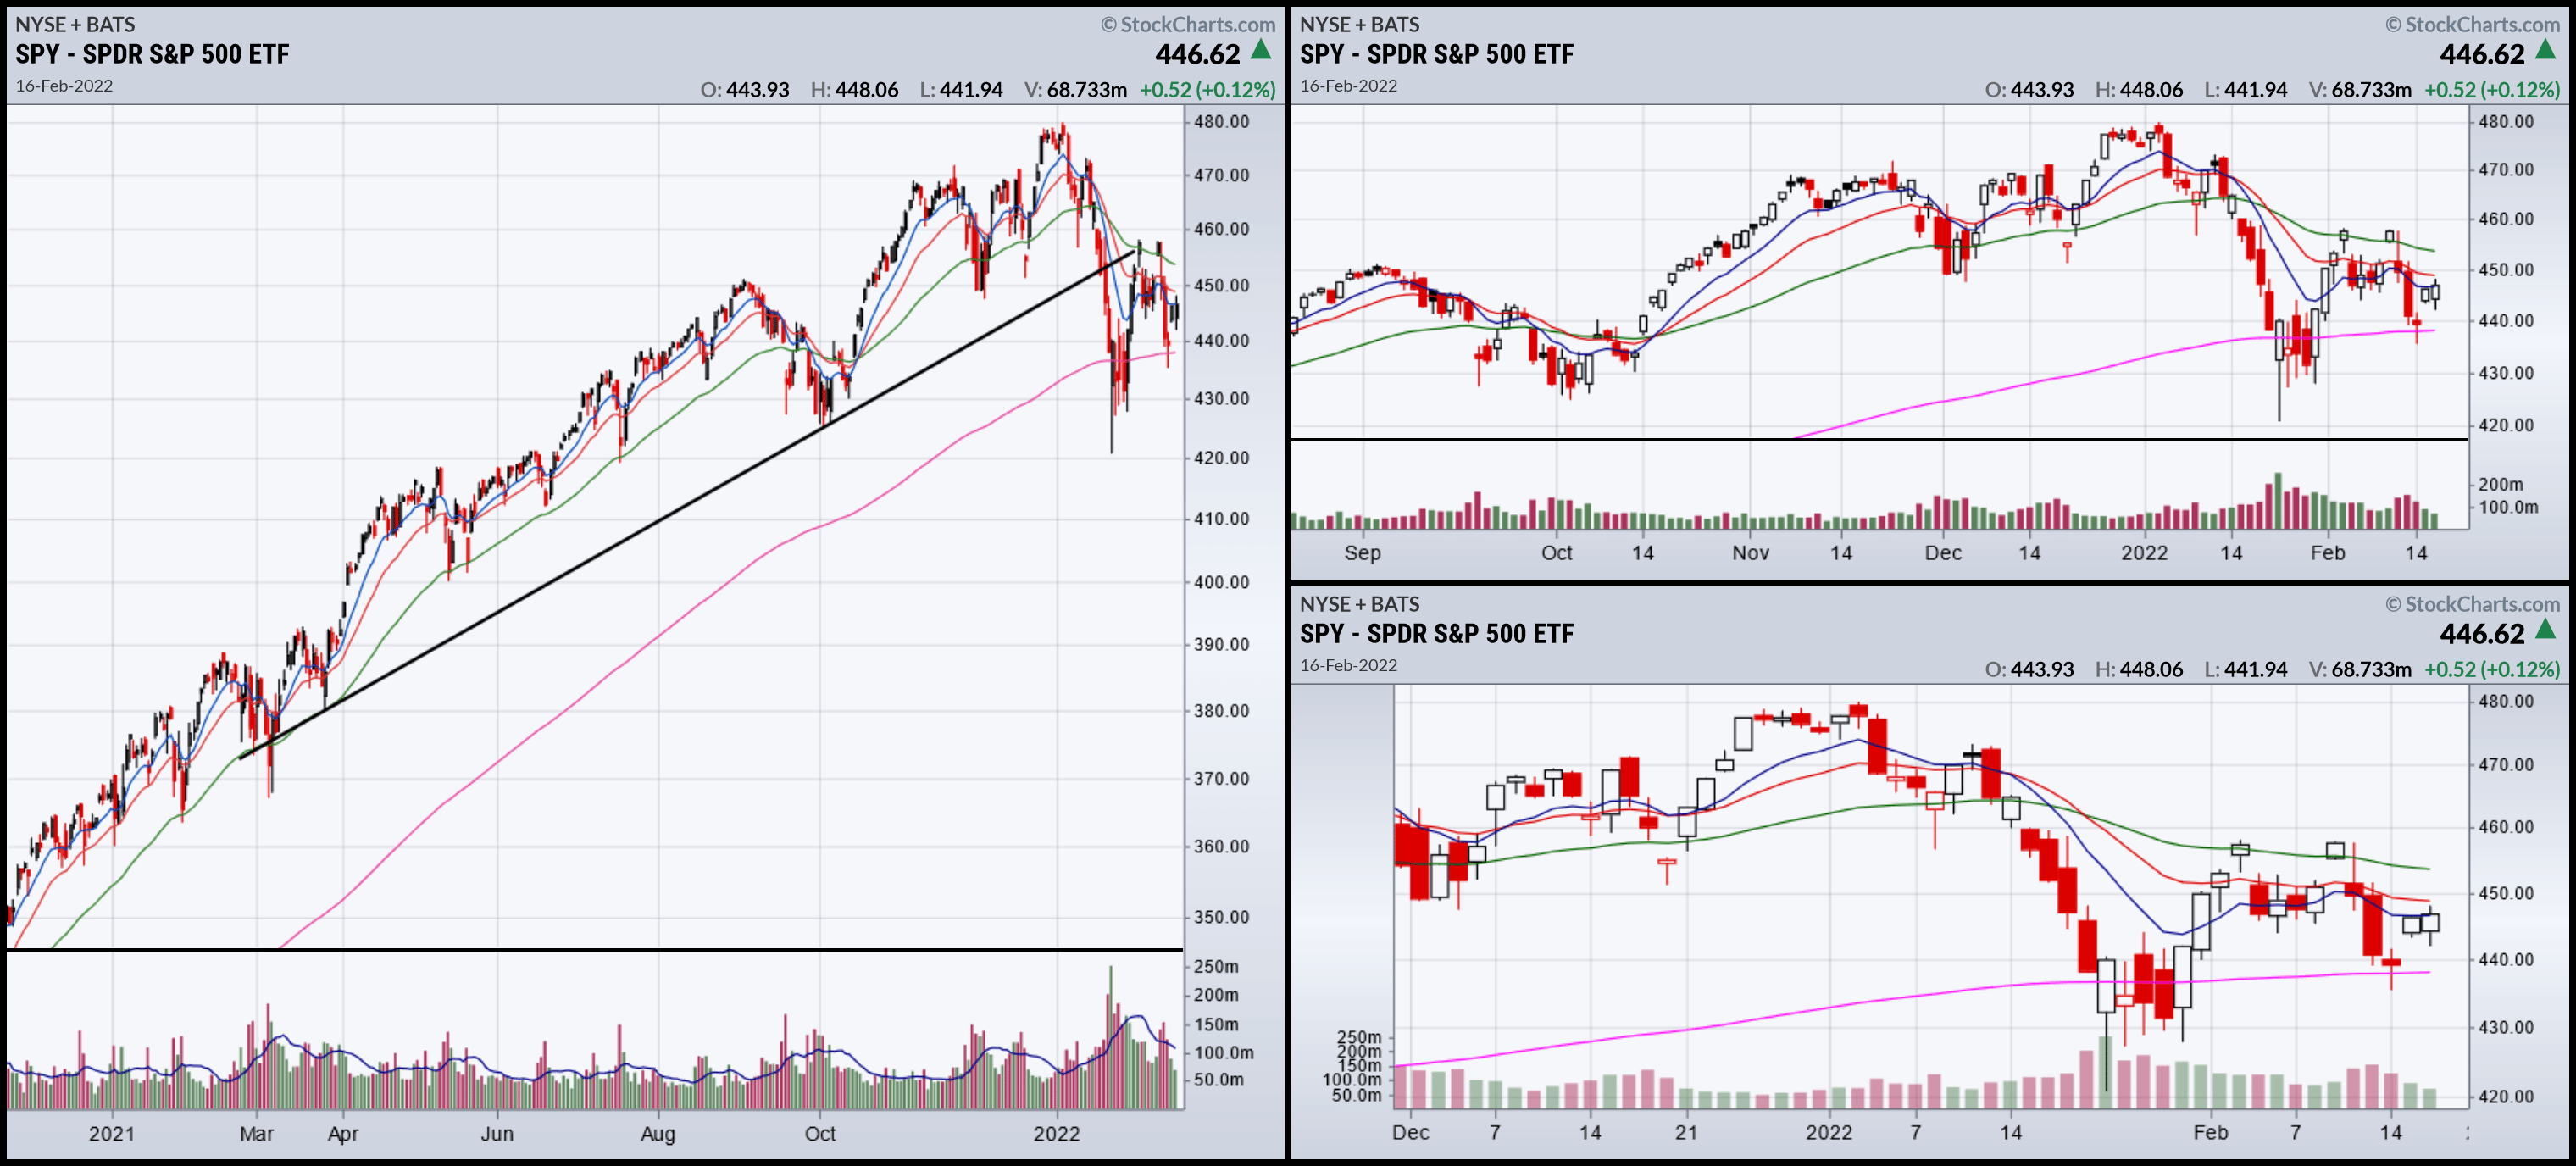
The SPY has clearly broken an uptrend (left). The two charts on the right show that prices are settling around the 200-day EMA.
1-year, 6-month, and 3-month charts of QQQ, FRED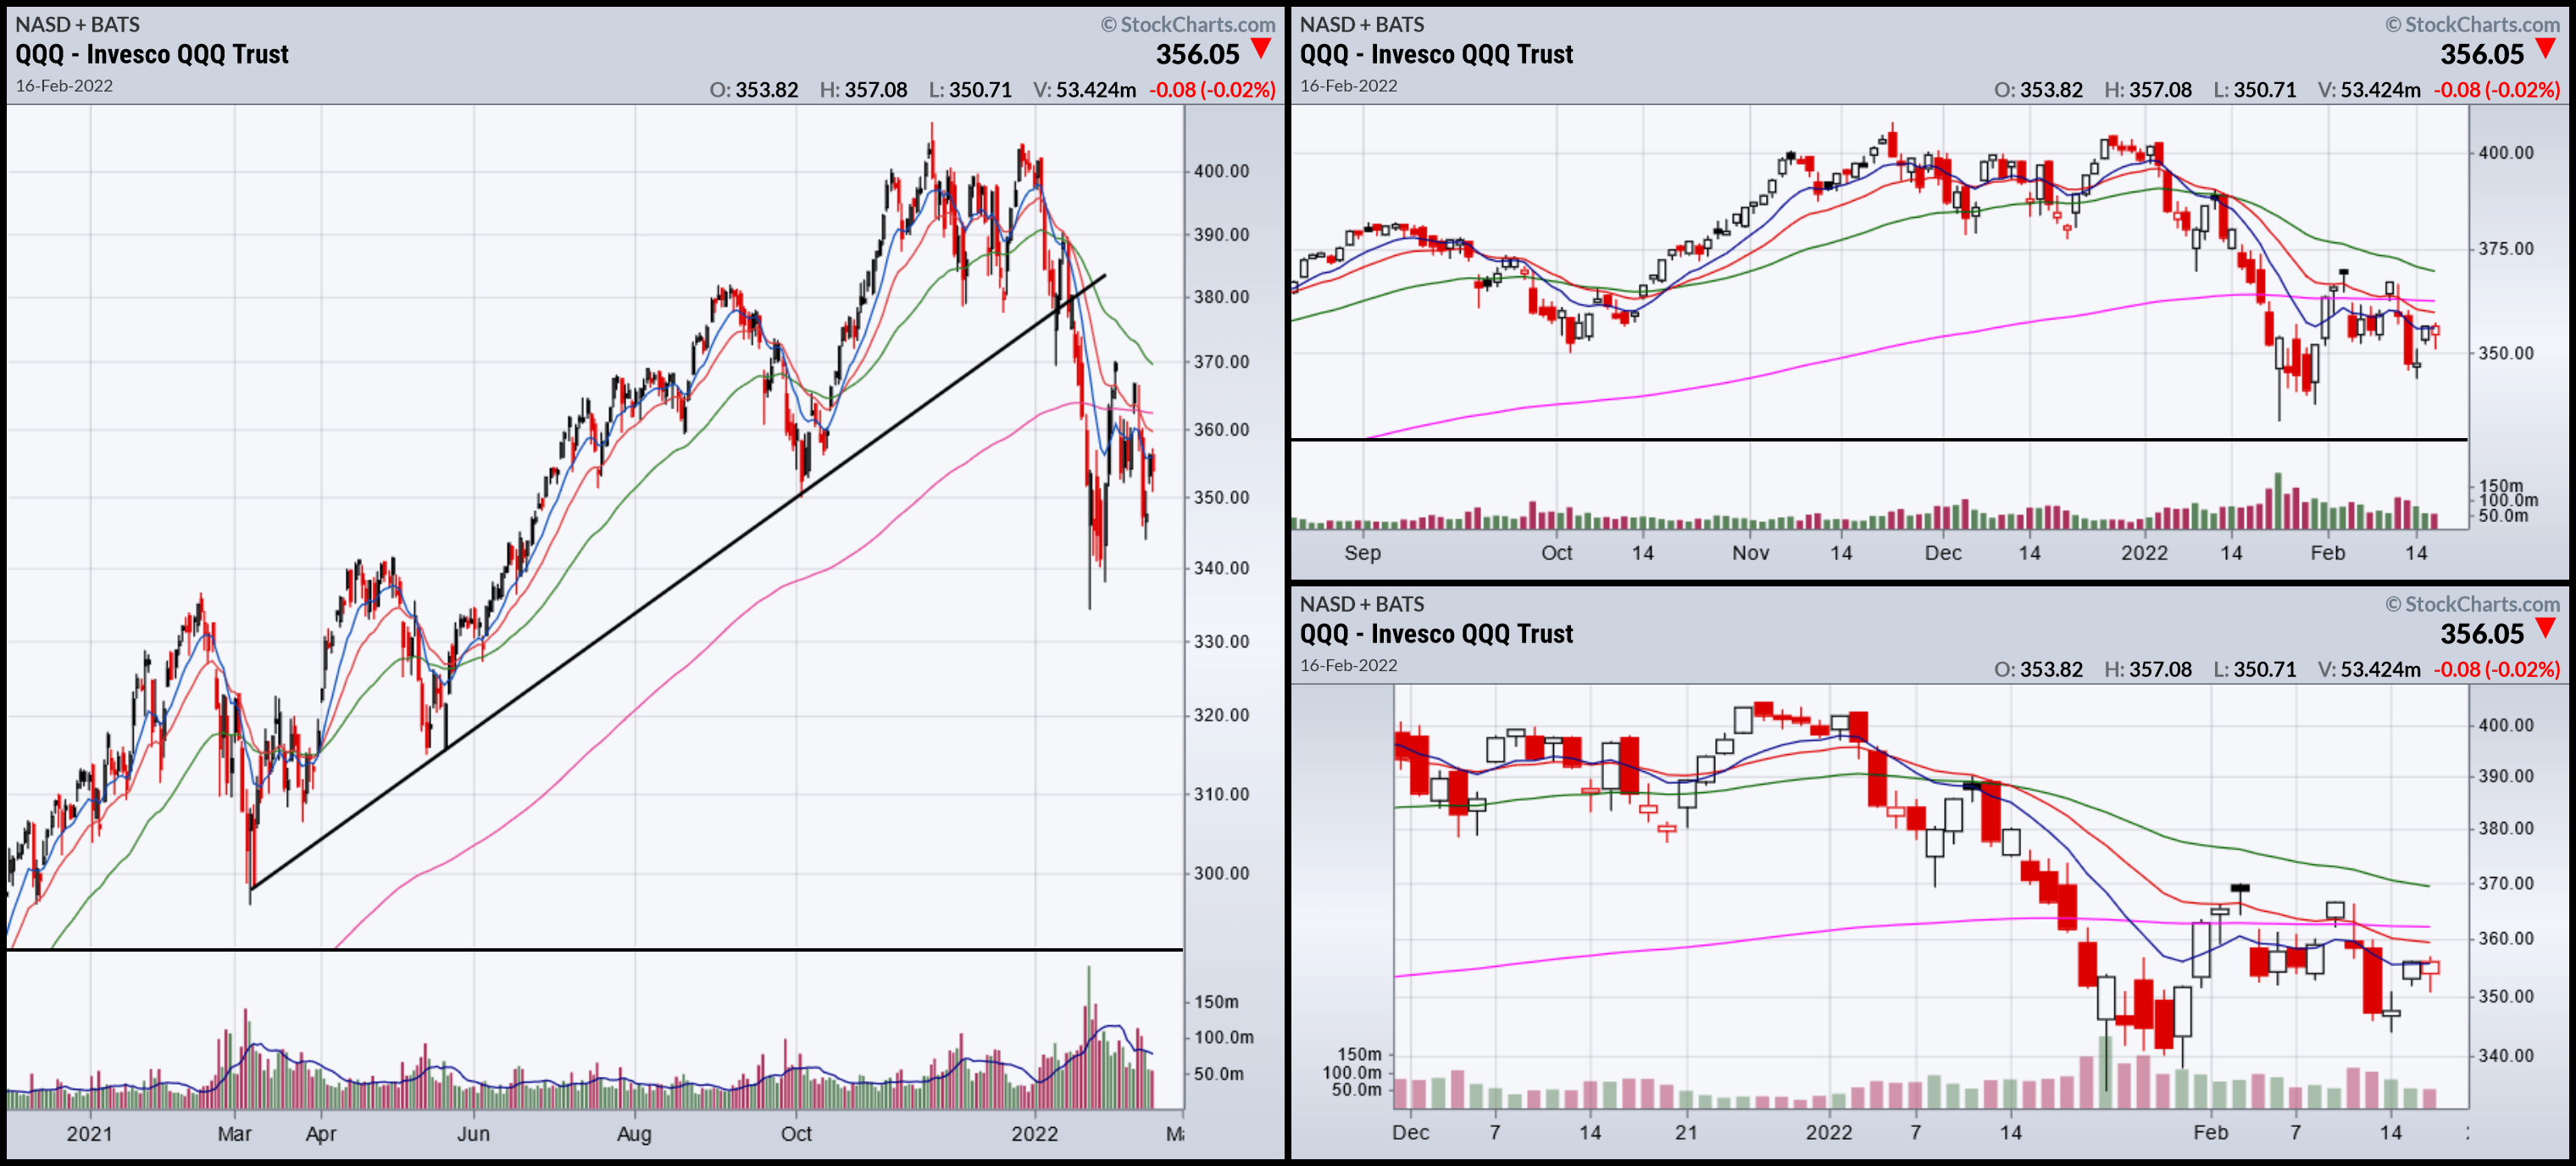
The QQQ has the same pattern as the SPY, except it’s consolidating below the 200-day EMA. This is a bit weaker, technically, as there is no moving average for support.
1-year, 6-month, and 3-month charts of QQQ, FRED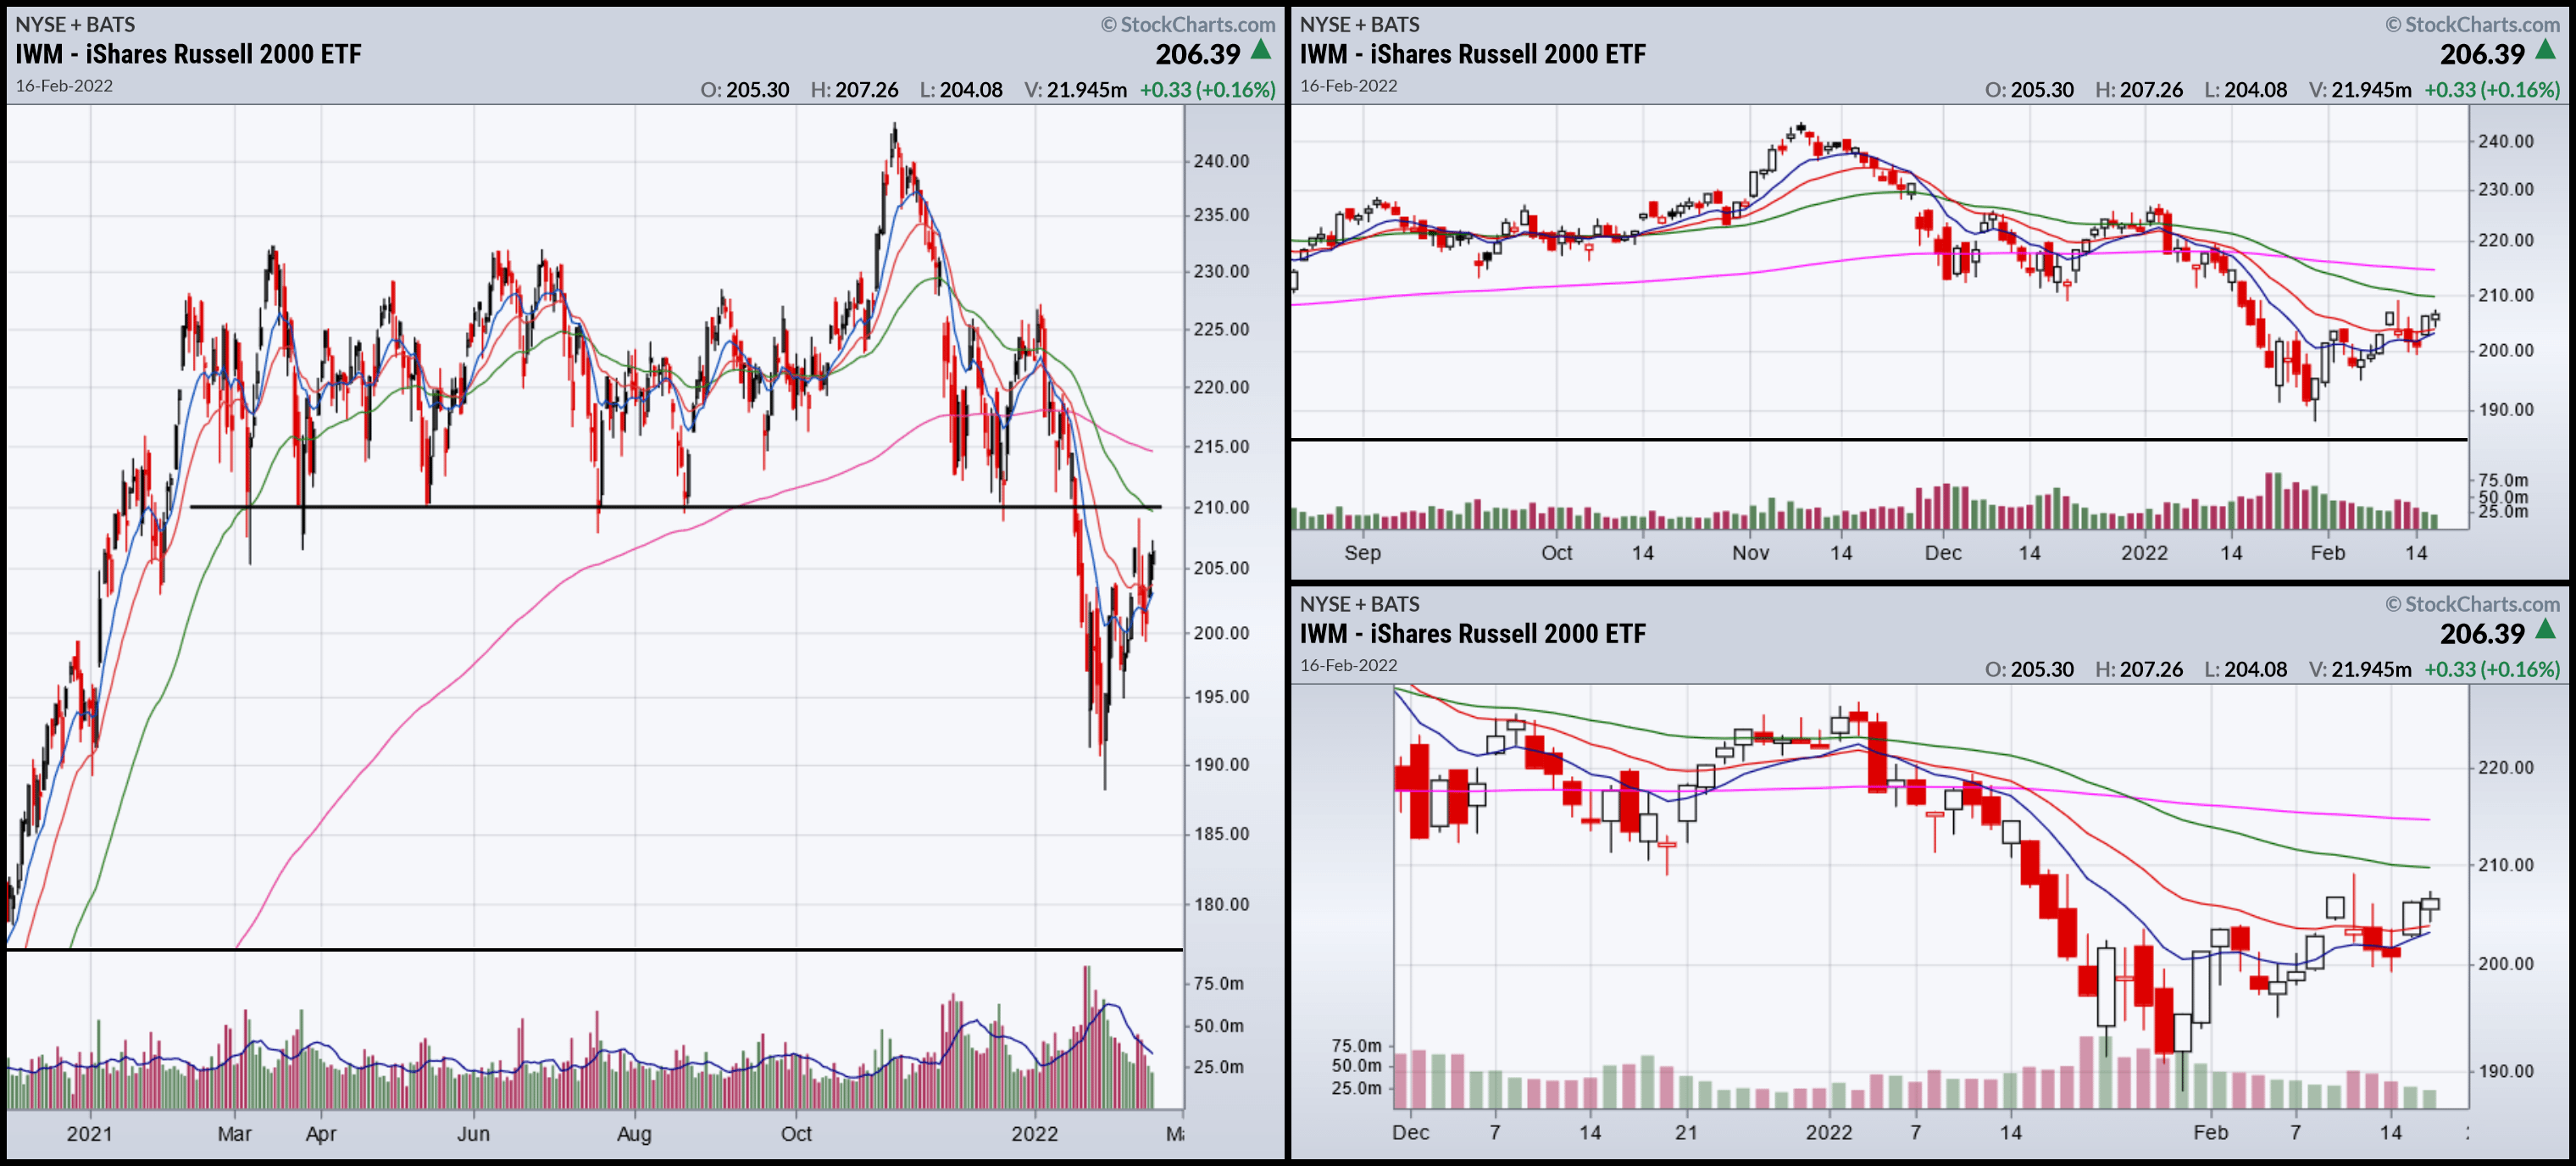
The IWM consolidated sideways for most of last year. Prices broke support at the beginning of the year. Currently, it looks as though prices are in a clear counter-rally.
The overall pattern is pretty clear: higher-risk equities led the way lower. Now the markets are rethinking the economic and risk calculus. But, the overall tenor is still modestly bearish.
Be the first to comment