

imaginima
OPEC cut oil output quotas in its meeting on September 5th. Since then, oil prices have reportedly fallen from intensified recessionary worries, but there was a strong rally on September 9th (Friday), which erased most of the losses. In this article, I will first cover why the symbolic output cut is of great significance to oil prices and more importantly to Chevron (NYSE:NYSE:CVX) and Occidental Petroleum (NYSE:NYSE:OXY), two oil stocks that Berkshire Hathaway (BRK.A) (BRK.B) has bought a lot of at prices not much lower than current market prices.
Part I: Rise of the “OPEC Put”: The historic significance of recent OPEC output cuts
This represents the first time in history that OPEC has cut oil output when prices are at such high levels.
The chart below shows OPEC’s output cuts historically. We can see they have all occurred when prices were relatively low. This is the first time OPEC has cut output, even symbolically, at such high prices.
OPEC cuts compared with oil prices
As discussed previously, OPEC+ may be shifting to a strategy of maximizing profits as oil producers worry about future demand uncertainty and are less willing to invest in capacity expansion:
Historical OPEC output (macrotrends.net + public info)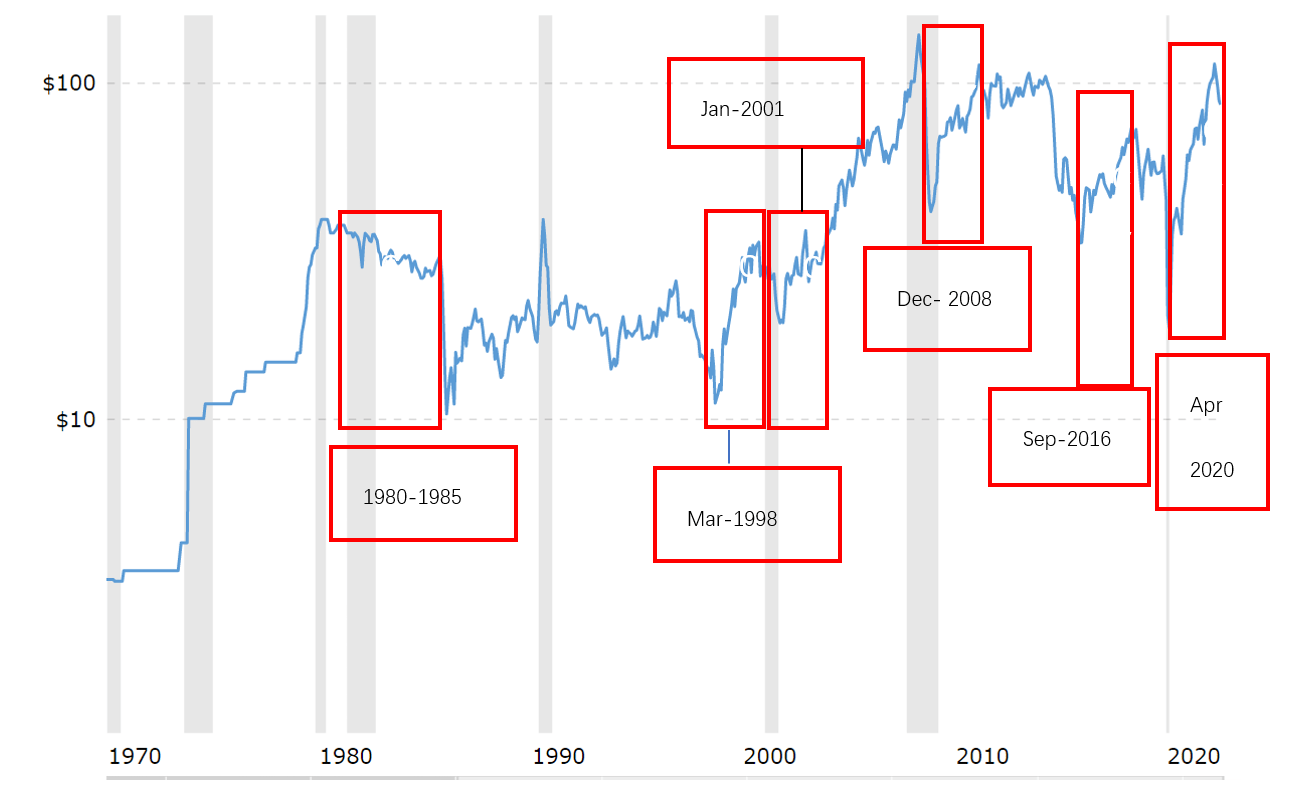
Note: the above boxes indicate rough period when output cuts started, they do not illustrate the exact end time.
- By cutting output, OPEC+ has made good on its threat to cut output anytime. Saudi Arabia has also solidified its control over OPEC+ with the price wars of 2020, which showed everyone it is unafraid to flood the market to negative prices. This had the added benefit of pushing independent shale out of the market (into the hands of other big corporations that are also like-minded to “rationalize” production). The success (from OPEC+ perspective) of this strategy has probably bolstered Saudi’s position in the group so the others are more willing to follow.
- This practice differs greatly from the past where OPEC cut output when prices were very low, and did not want oil prices to be so high that there would be demand destruction. Well, there is demand destruction now from the highly anticipated growth in renewables and electric vehicles. Whether or not electric vehicles actually do work out (e.g. many have pointed out concerns such as the lack of materials to make EVs) or not is a separate question, but right now this poses a credible enough threat to future demand forecasts, so this decreases the incentive of oil producers to increase production.
What are the implications of OPEC shifting to a profit maximization strategy?
- In the short run, this may make little difference, as many analysts point out, OPEC+’s current production level is below the output guidance anyway, so short term supply/demand dynamics have larger influence on short term oil prices. But I believe it is wrong to underestimate the symbolic nature behind this move.
- This may signal the rise of the “OPEC put”, as OPEC rushes to verbally intervene when oil prices just soften slightly, akin to the hallowed “Fed put” in the equities market, where the Fed used to verbally reassure stock markets whenever there was a correction (that is before the current bout of monetary tightening in 2022). Given that OPEC+ exports 60-70% of the world’s tradeable oil and that many oil majors are forecasting small if not nil production growth in the next five years, if OPEC+ has a “whatever it takes” attitude to maintaining high prices, there are good chances it will succeed.
- It may lead to significant higher prices for oil than the market are currently pricing in, as shown below, the WTIC futures price curve ranges to from about $87 for October to low $65 by 2026 and all the way to $57 by 2029 and after (Oddly enough, the 3 years future prices was c.$60 during the depths of the coronavirus pandemic as well). OPEC appears to be aiming higher, as they are floating and enacting these cuts at $90. If the market is currently pricing in such oil prices (and stocks of oil companies at these oil prices), then if OPEC+ succeeds to continuously manage oil prices higher, then this could mean significantly upside for shareholders of oil stocks.
WTIC oil futures price curve (Public info)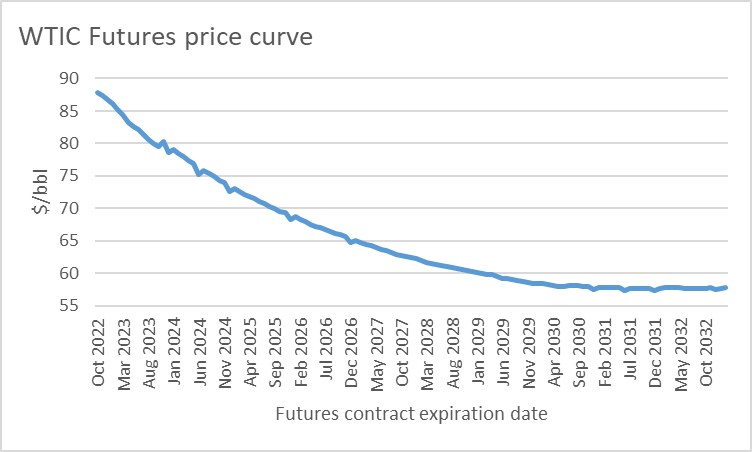
Part II: Implication of the OPEC put on CVX and OXY
If the OPEC cut is able to keep oil prices at $80-$90 for the next 5 years and perhaps longer, specifically speaking how does this impact Chevron and Occidental? I will analyze these two in detail as they have Berkshire’s stamp of approval.
I will focus my analysis on the upstream oil business as: (i) the “OPEC put” will mostly impact the sale price of oil, rather than natural gas prices and refinery margins, and (ii) the upstream oil business accounts for the majority of the free cashflow (FCF) generated.
Market Consensus
Currently the market consensus is heavily discounting the upside, as consensus EPS estimates forecast EPS to drop off sharply in line with strip oil prices (i.e. somewhere along $60 for long term oil prices). Given future capex guidance by these companies are relatively stable, the estimated EPS change magnitude is indicative of estimated FCF, whereby Occidental would see decline c.75% in 2026 compared to 2022 levels (FCF to equity holders will decline at a less rate as Occidental pays down its debts in the next few years). With such consensus forecasts, it is understandable why many question whether Occidental and Chevron are a great buy.
Consensus Estimated EPS per share
|
$/share |
2022 |
2023 |
2024 |
2025 |
2026 |
|
Chevron |
19.01 |
16.72 |
13.83 |
11.17 |
9.62 |
|
Occidental |
10.77 |
8.44 |
6.04 |
2.73 |
2.45 |
Source: Seeking Alpha
I have done an illustrative high level summary comparison of Chevron and Occidental below, before we do a deep dive into each Company and this will be used as a reference below when discussing each Company.
Illustrative Comparison of EVs and FCF
|
USD billions except oil prices which are in $/barrel |
FY21 avg realized oil prices ($/barrel) |
H1-FY22 avg realized oil prices($/barrel) |
H1-FY22 Operating cashflow |
FY22 forecast capex |
FY22F free cashflow |
Market cap |
Debt (including borrowings, preferred shares (if any), asset retirement and other debt-like obligations) |
EV |
|
A |
B |
C=2*A-B (rounded down) |
D |
E |
F=D+E |
|||
|
Chevron (CVX) |
$65 |
$97.74* |
21.8 |
15.3 |
28 |
313 |
45 |
358 |
|
Occidental (OXY) |
$66 |
$100.10 |
10.4 |
4 |
16 |
61 |
37 |
100 |
Source: public filings
*For Chevron, average realized oil prices shows international $97.74/barrel rather than the US ($82/barrel which seems low, due to a mix change – a higher proportion of liquids sales is “natural gas liquids”).
** I include a broader definition of debt includes borrowings, preferred shares (if any), asset retirement and other debt-like obligations to be safe.
Chevron
The below will use data from Chevron’s annual report, investor presentation slides (link), conference calls etc.
From 2022-2026:
- At $75/barrel Brent prices, Chevron sees c.$200bn cashflow from operations, and after taking out roughly $75bn in cash capex, this leaves about $120bn (give or take a few billion) FCF for buybacks and dividends;
- At $50/barrel, this would be FCF of $75bn.
Chevron 2022-2026 5 year cumulative FCF (Investor presentation)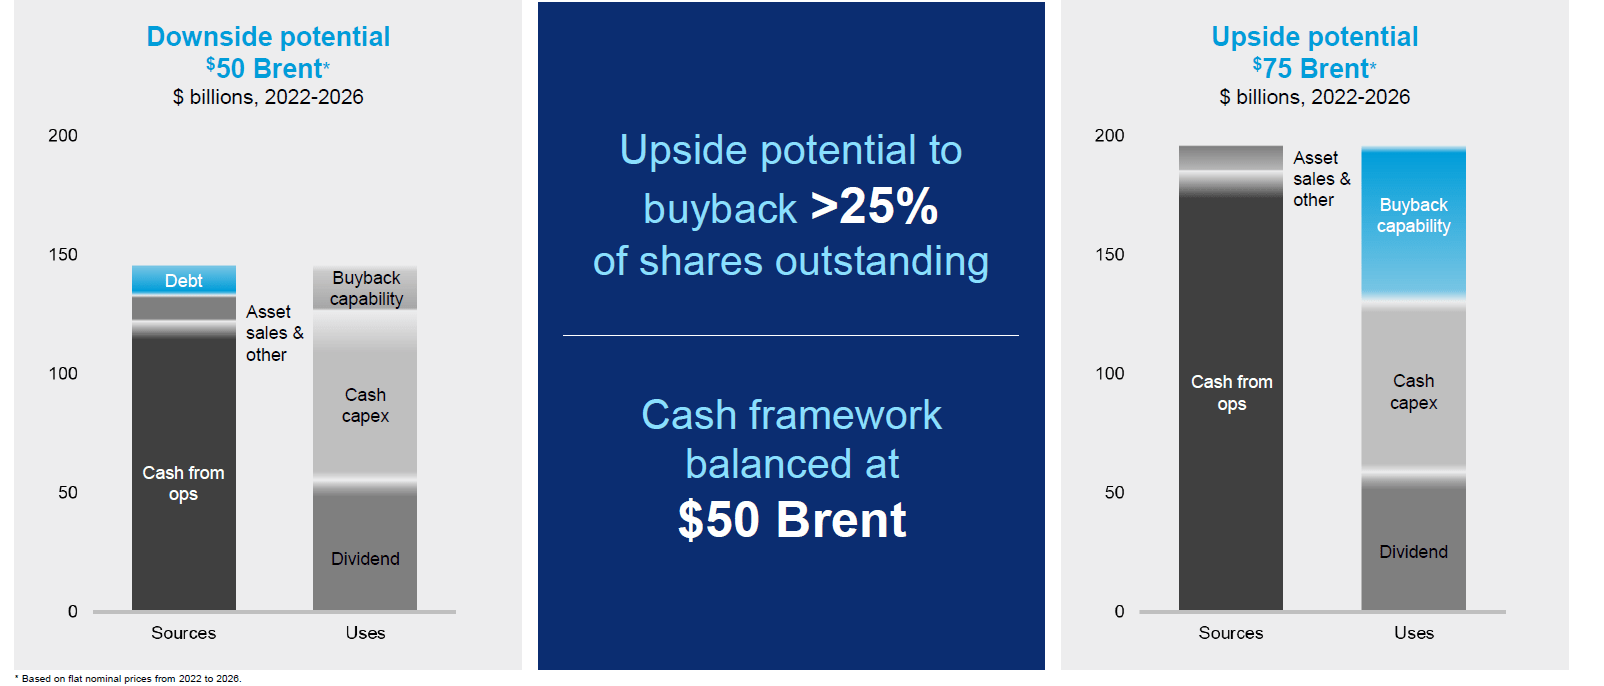
- This is roughly consistent with Management’s estimated sensitivity per $1 change in Brent oil price, which is $400 million in after-tax earnings (roughly equal to FCF), extrapolated across a spectrum of $50-$100/barrel shown below:
Chevron 2022-2026 5 year cumulative FCF sensitivity to oil prices
|
Brent oil price per barrel ($/barrel) |
50 |
60 |
75 |
90 |
100 |
|
5 year cumulative FCF ($bn) |
75 |
90 |
120 |
150 |
170 |
Source: Author’s calculations based on Company disclosed information and certain assumptions outlaid above
Note: the above extrapolation is based on sensitivities based on Company provided inputs and are just for illustrative purposes rather than representing Management’s view.
Management projects a 10% CAGR increase in CFFO (cashflow from operations) from FY21 levels up until 2026. FY21’s CFFO was $29bn, so there is about $17.7bn of improvement. By FY26, CFFO would be $46.7bn, minus $16bn in midpoint capex guidance, would be c.$30bn in FCF. Given FY21 average realized prices was $65/barrel, subtract $2 billion to normalize it to $60/barrel, which would give $28bn annually in FCF at $60/barrel.
Chevron 2026 single year FCF sensitivity to oil prices
|
Brent oil price per barrel ($/barrel) |
50 |
60 |
75 |
90 |
100 |
|
FCF ($bn) |
24 |
28 |
34 |
40 |
44 |
Source: Author’s calculations based on Company disclosed information and certain assumptions outlaid above
Per Chevron’s FY21 investor presentation slides, its main strategy to achieve the above for the upstream (i.e. production of oil and gas) business is to increase ROCE (return on capital employed) by (i) reducing per unit capex and opex and (ii) increasing its production in Permian etc areas.
- Upstream capex will be massively decreased compared with the previous decade, while production is slightly ramped up.
upstream C&E (chevron FY21 investor presentation)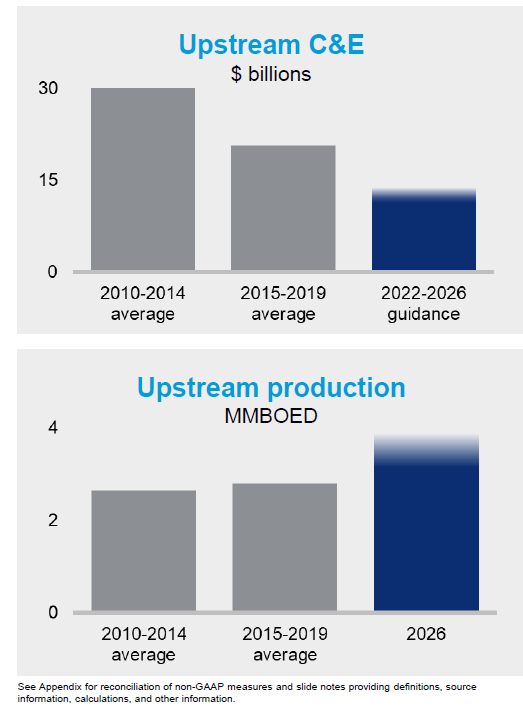
- Upstream FCF improves from lower opex and capex per barrel. Upstream cash per barrel after capex would be $10-$15 per barrel by 2026 even assuming a Brent oil price of $60.
upstream opex (chevron FY21 investor presentation)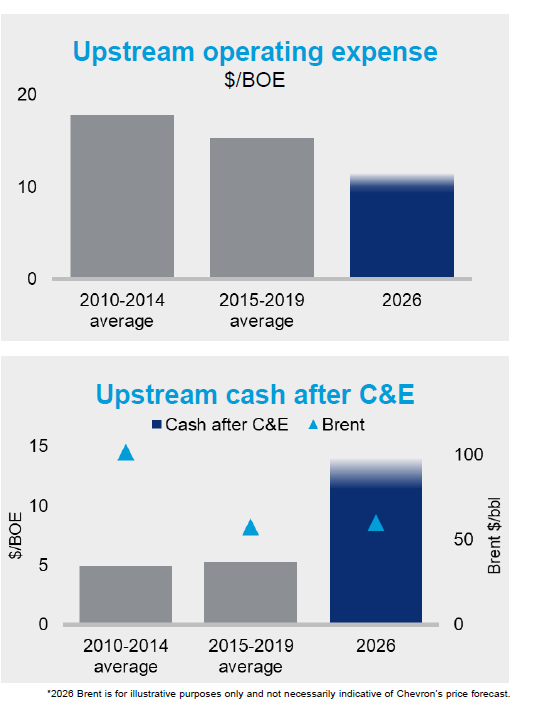
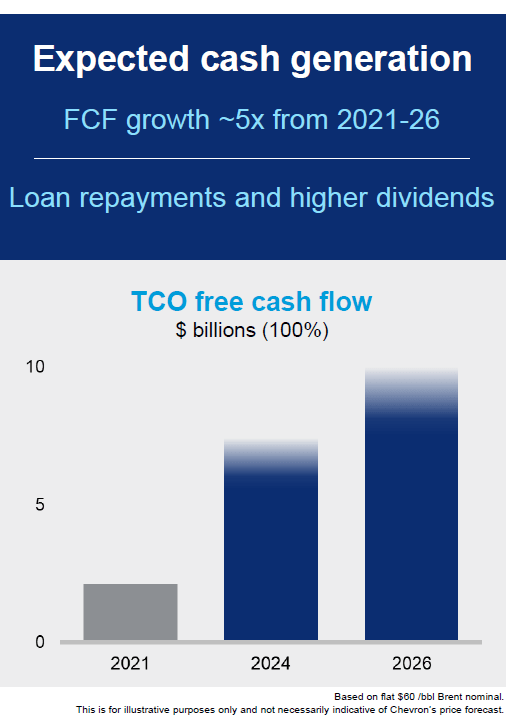
The first chart is Permian and the second is TCO. It appears FCF would mainly be driven by TCO (Chevron’s JV Tengizchevroil in Kazakhstan, which it owns 50% equity interests), as a Permian basin FCF increase will be relatively smaller (from c.$3bn in 2022 to >$4bn in 2026) while TCO FCF explodes (note that the below shows 100% TCO FCF, while Chevron owns 50% of TCO).
Permian returns (chevron FY21 investor presentation) TCO FCF (chevron FY21 investor presentation)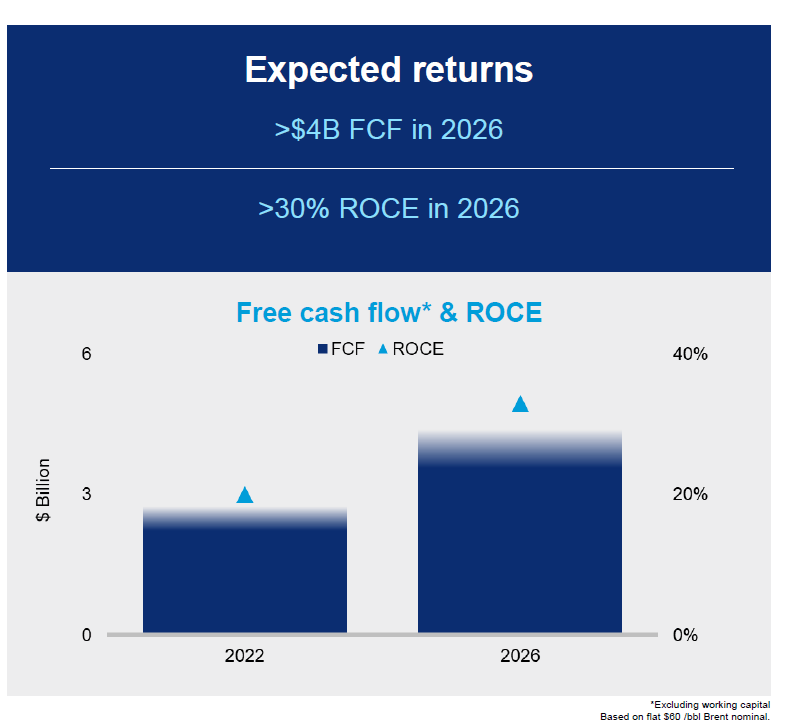
- Production is expected to grow, mainly driven by Permian and other Shale & Tight growth. This makes sense given their drilling spots and past experience.
Production forecast (chevron FY21 investor presentation)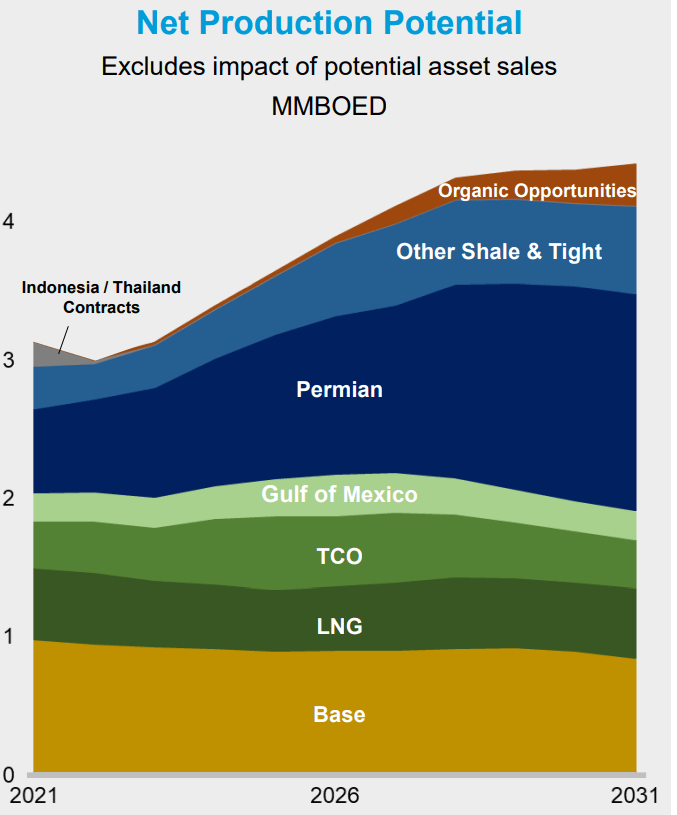
Upon first glance, it would appear that Chevron is not super undervalued – even if Brent oil remains at $90-$100 from FY22-26, Chevron would only generate $150-$170bn in FCF, compared to an EV of $340bn.
- However, Chevron has immense staying power with its strong resource base. For example, it forecasts the Permian production ramping up until 2030 and then stabilizing all the way till 2040.
Permian production outlook (chevron FY21 investor presentation)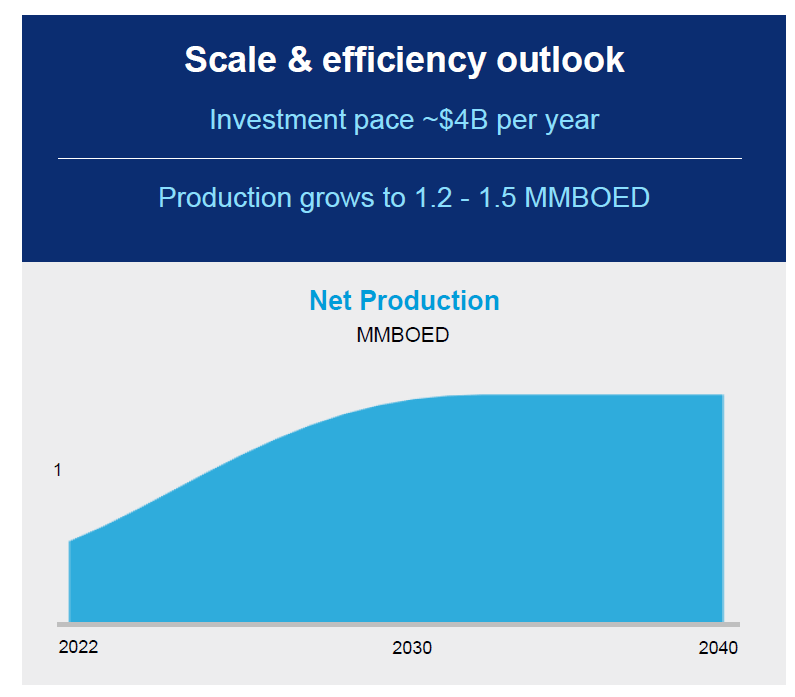
- Net proven reserves for liquids at year-end 2021 were 6.1 billion barrels (2010 was 5.7 billion barrels) so Chevron has been able to keep adding to its reserves over the past decade.
Let’s plug the above knowledge into a DCF model based on 3 scenarios using a 7% discount rate (it appears recent research reports on CVX and OXY use 7%-ish discount rate so let’s use that):
CVX DCF in 3 scenarios
CVX DCF 3 scenarios (author’s calc based on company data and certain assumptions outlaid)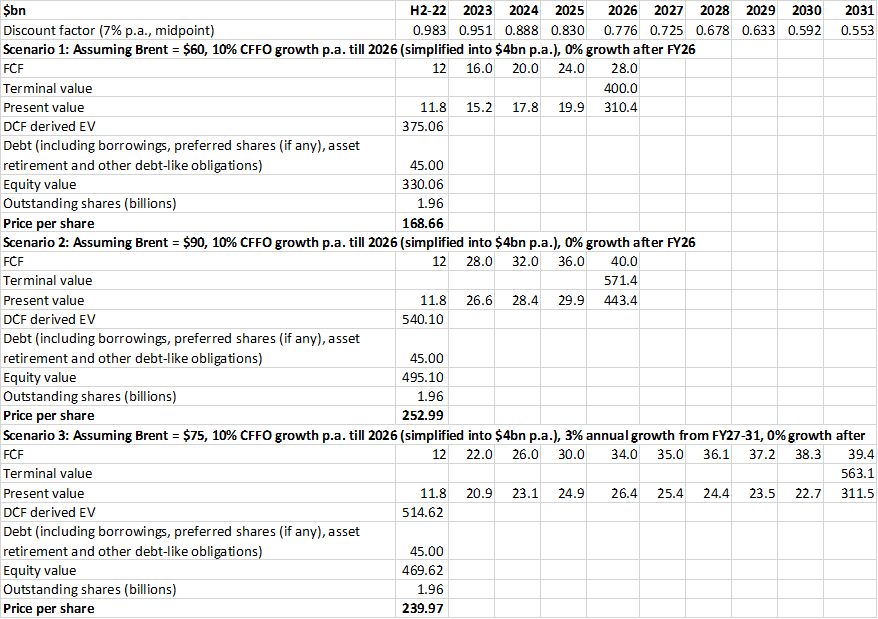
Source: author’s calculations based on company info and assumptions outlaid above and below
Three scenarios are shown above (calculations are shown as well in case the reader wants to build on top of it)
- For simplicity purposes, we start from H2-FY22: to derive H2 FY-22 we use the above extrapolated FCF for FY22 ($28 bn at @$100), assume average Brent of $90 for H2-FY22 and deduct according to the sensitivity to reach ($28bn-$400mm*10)*50%=$12bn).
- Scenario 1: $60 oil, assuming 10% CFFO growth from FY22 to FY26 (which is simplified into $4bn FCF growth per year), and 0% growth after FY26, the price per share would be slightly above current market price.
- Scenario 2 is same as Scenario 1 except assuming $90 oil.
- Scenario 3 assumes $75 oil and 3% FCF growth from FY27 to FY31.
- DCF would indicate a significantly higher price per share under Scenarios 2 and 3.
- Bottom line is that CVX is a relatively safe buy even if the OPEC put only keeps oil prices at a long term $60 and there is 0% long term growth other than Management realizing its FCF improvements up to FY26 (which seem quite plausible), while there is significant upside if oil prices are slightly higher and Management realizes some extra growth.
- As a benchmark, Berkshire purchased 121 million shares (roughly 75% of his total holdings in CVX) in 2022Q1, where the price ranged between $114 to $171 (simple average of $142.5), so Buffett’s entry price isn’t materially below the current market price.
Occidental
The story for Occidental is largely similar, though details are bit sparser. Oil production growth is forecast to be 0-5% annually long term and sensitivity is $225 million in after tax earnings per each $1 change in price of oil. Assuming the FCF of OXY does not see any growth and the only input is oil prices, long term FCF would be the below:
OXY Annual FCF sensitivity analysis
|
WTIC oil price per barrel ($/barrel) |
50 |
60* |
75 |
90 |
100 |
|
Annual FCF ($bn) |
4.75 |
7 |
10.4 |
13.75 |
16 |
*As a cross-check, FCF was $7.5bn in FY21 (when realized oil prices were about $66/barrel for OXY), so $7bn a year steady state @$60 oil prices seems reasonable.
Source: Author’s calculations based on Company disclosed information and certain assumptions outlaid above
Note: the above extrapolation is based on sensitivities based on Company provided inputs and are just for illustrative purposes rather than represent Management view.
If we do a DCF as well:
OXY DCF in 3 scenarios
OXY DCF 3 scenarios (author’s calcs and Company info)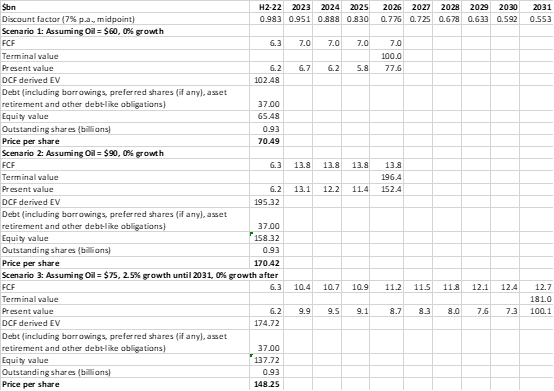
Source: author’s calculations based on company info and assumptions outlaid above and below
- For simplicity purposes, we start from H2-FY22: we use the above extrapolated FCF for FY22 ($16 bn at @$100), assume average WTIC of $85 for H2-FY22 and deduct according to the sensitivity to reach ($16bn-$225mm*15)*50%=$6.3bn) .
- The scenario assumptions are similar to those used for Chevron. Occidental is currently undervalued in scenarios 2 and 3. Scenario 1 is consistent with current market prices.
- As a benchmark, Berkshire purchased 158 million shares in 2022Q1 and 2022Q2, mostly after the price went above the $50s, so current price is just about 20% or so above Buffett’s average price.
Occidental does not give too much of a forecast out 5 or 10 years down the road (unlike Chevron), however, by comparison the main differences between Occidental and Chevron appear to be:
- Chevron’s FY21 and FY22 FCF still does not fully reflect operational improvements while Occidental is already at its “steady state”.
- Occidental is more leveraged: Occidental has higher leverage than Chevron and it is focused on reducing debt and getting back to investment grade before distributing more to shareholders, if oil prices fall, this could take a while, though if they remain at these current levels (FCF $16bn a year at $100 oil prices compared to $22bn in debt), it could take maybe a year or two. But if oil is at $60, then FCF is $7bn and it could take several years to deleverage before more substantial cash is returned to shareholders.
Summary
The OPEC put may provide long term support for oil prices:
- If the OPEC put does not work out and oil prices converge to the long term $60/barrel priced in by the market, CVX and OXY are currently fairly valued (even assuming 0% growth).
- Whereas if the OPEC put works out better than anticipated and the market revalues long term oil up to $75 or $90 or if CVX and OXY manage to eke out some growth, there could be significant upside.
- With Buffett’s stamp of approval and his purchases at prices not significantly lower than the current market prices, odds are favoring the undervalued case and buying the dip. As some analysts pointed out, Buffett has been wrong before. Of course he could be mistaken, but given how many times he’s trounced the naysayers (remember Apple (AAPL)?) I’d give him the benefit of the doubt especially when market prices are probably not far off Buffett’s average purchase price.
Be the first to comment